MNB WORKING
PAPERS
2008/7
PÉTER BAKOS–PÉTER BENCZÚR–DÓRA BENEDEK
The Elasticity of Taxable Income:
Estimates and Flat Tax Predictions Using the
Hungarian Tax Changes in 2005
The Elasticity of Taxable Income:
Estimates and Flat Tax Predictions Using the
Hungarian Tax Changes in 2005
October 2008
Published by the Magyar Nemzeti Bank Szabadság tér 8–9, H–1850 Budapest
http://www.mnb.hu
ISSN 1585 5600 (online)
The MNB Working Paper series includes studies that are aimed to be of interest to the academic community, as well as researchers in central banks and elsewhere. Starting from 9/2005, articles undergo a refereeing process, and their
publication is supervised by an editorial board.
The purpose of publishing the Working Paper series is to stimulate comments and suggestions to the work prepared within the Magyar Nemzeti Bank. Citations should refer to a Magyar Nemzeti Bank Working Paper. The views
expressed are those of the authors and do not necessarily reflect the official view of the Bank.
MNB Working Papers 2008/7
The Elasticity of Taxable Income: Estimates and Flat Tax Predictions Using the Hungarian Tax Changes in 2005* (Az adóköteles jövedelem rugalmassága:
Becslés és egy egykulcsos adórendszerre vonatkozó számítás a 2005. évi magyar adóváltozások alapján) Written by: Péter Bakos**, Péter Benczúr***, Dóra Benedek****
* We are grateful for Gábor Kézdi, László Mátyás, Ágota Scharle and participants of the Annual Meeting of the Hungarian Society of Economics (MKE), a seminar at MNB and the 2008 Annual Meeting of the European Economic Society for comments, and the Hungarian Ministry of Finance (PM) and the Tax and Financial Control Administration (APEH) for providing the data. Part of the work was done while Benczúr was a Jean Monnet fellow at the Robert Schuman Center for Advanced Studies, Florence. The views expressed herein are ours and have not been endorsed by PM, APEH or MNB. ** Royal Bank of Scotland, e-mail: peter.bakos@rbs.com.
*** Magyar Nemzeti Bank and Central European University, Budapest, e-mail: benczurp@mnb.hu.
Abstract
4
1 Introduction
5
2 Related literature
8
3 The empirical framework
10
Methodology
10
Marginal tax rate (MTR)
11
Data
13
4 Estimation results
15
Robustness
16
5 Revenue predictions
20
6 Conclusion
27
Bibliography
28
Appendix
30
A. Changes in the Hungarian tax system, 2004–2005
30
B. The identification scheme
31
Many Central and Eastern European countries are adopting flat tax schemes in order to boost their economies and tax revenues. Though there are signs that some countries do manage to improve on both fronts, it is in general hard to distinguish the behavioral response to tax changes from the effect of increased tax enforcement. This paper addresses this gap by estimating the elasticity of taxable income in Hungary, one of the outliers in terms of not having a flat tax scheme. We analyze taxpayer behavior using a medium-scale tax reform episode in 2005, which changed marginal and average tax rates but kept enforcement constant. We employ a Tax and Financial Control Administration (APEH) panel dataset between 2004 and 2005 with roughly 215,000 taxpayers. Our results suggest a relatively small but highly significant tax price elasticity of about 0.06 for the population earning above the minimum wage (around 70% of all taxpayers). This number increases to around 0.3 when we focus on the upper 20% of the income distribution, with some income groups exhibiting even higher elasticities (0.45). We first demonstrate that such an elasticity substantially modifies the response of government revenues to the 2004-2005 tax changes, and then quantify the impact of a hypothetical flat income tax scheme. Our calculations indicate that though there is room for a parallel improvement of budget revenues and after-tax income, those gains are modest (2% and 1.4%, respectively). Moreover, such a reform involves important adverse changes in income inequality, and its burden falls mostly on lower-middle income taxpayers.
JEL codes:H24, H31.
Keywords:elasticity of taxable income, tax reform, behavioral response, revenue estimation, flat tax.
Az elmúlt évek során számos kelet-közép-európai (KKE) ország vezetett be egykulcsos adórendszert gazdasága élénkítése és adóbevételei növelése céljából. Bár úgy tûnik, hogy egyes országoknak sikerül a kettõt egyszerre megvalósítani, általában ne-héz egymástól szétválasztani az adózásbeli változások által kiváltott viselkedési reakciókat és a szigorúbb adóbehajtás hatása-it. Jelen tanulmány ezt a rést kívánja betölteni, a magyarországi adóköteles jövedelmek rugalmasságának becslésével. Erre a 2005. évi személyi jövedelemadó-változások adnak lehetõséget, ahol az adókulcsok változása nem járt az adóbehajtás szigo-rodásával. Vizsgálatunkhoz az APEH kétéves (2004., illetve 2005. évi), kb. 215 000 adófizetõre vonatkozó paneljének adat-állományát használjuk fel. Eredményeink azt mutatják, hogy az éves minimálbérnél magasabb jövedelmûek (az adófizetõk kb. 70%-a) esetében viszonylag kicsi, kb. 0,06-os, de erõsen szignifikáns adóár-rugalmasság tapasztalható. Ez a szám mintegy 0,3-ra nõ, ha a jövedelemeloszlás felsõ 20%-os sávját vizsgáljuk, sõt egyes jövedelemcsoportok még ennél is magasabb (0,45-ös) elasztikusságot mutatnak. Elõször megmutatjuk, hogy egy ilyen mértékû rugalmasság alapvetõen módosítja a költségvetési vételek alakulását a 2004–2005. évi adóváltozások nyomán, majd számszerûsítjük egy hipotetikus egykulcsos adórendszer be-vezetésének hatásait. Számításaink azt mutatják, hogy lehetséges a költségvetési bevételek és az adóköteles jövedelmek párhu-zamos növelése (az elõbbi kb. 2%-kal, az utóbbi 1,4%-kal nõ), ugyanakkor egy ilyen reform jelentõsen növeli a jövedelmi egyenlõtlenségeket, és terhét fõként a közepes jövedelmû adófizetõk viselik.
Abstract
Motivated by their simplicity, easy administration and effective monitoring, “flat tax” experiments have become practically the rule in Central and Eastern European (CEE) countries. Although involving a large cut in personal income taxes and thus often having adverse implications for income inequality, such reforms tend to boost budget revenues. It is not immediate, however, that this is evidence for some kind of a Laffer curve, since the introduction of a flat tax always comes together with additional changes in tax rates (like an increase in capital income tax rates). More importantly, there is often an increase in enforcement as well.1
One cannot easily distinguish the influence of these factors from each other, though it would be essential for the design of tax reforms in any of these countries.2If there is indeed a substantial labor supply (more precisely: taxable income) response,
that is indicative of huge welfare gains from an overall shift away from labor income taxation, regardless whether it is a flat tax or not. If, on the other hand, there is little labor supply response, then the effect must be mostly due to increased enforcement, hence new reformers should concentrate their efforts on enhancing tax discipline, and use tax cuts mostly to compensate taxpayers for harsher enforcement; again, regardless whether all this takes a form of a flat tax or not. Alternatively, a tax cut can serve as a focus point in switching to a ‘high tax morale’ equilibrium.3
This paper aims at quantifying the response of taxable income to changes in tax schedules in Hungary, one of the outliers in the CEE region without a flat tax. Though there are some studies aimed at describing the structure of the Hungarian tax system (Bakos et al., 2008), or redistributional aspects of flat tax schemes (Benedek and Lelkes, 2006), we are not aware of any study analyzing the elasticity of taxable income.4Using a medium-scale tax reform episode of 2005 and a large panel of
personal income tax files, we obtain an estimate for the behavioral response of taxable income to the marginal and average tax rate, keeping tax enforcement unchanged.
In particular, we use a Tax and Financial Control Administration (APEH) panel data for the years 2004 and 2005, with roughly 480,000 raw observations. This allows us to compare taxpayer behavior before and after the 2005 tax changes. This reform episode reduced the number of personal income tax brackets from three to two, increased the employee tax credit, raised the maximum annual amount of pension contribution and introduced a gradual, income-dependent phase-out of certain tax allowances (also raising marginal tax rates for some). Together with the “bracket creep” of not adjusting tax brackets to inflation, these led to various changes in marginal and average tax rates, without any major change in tax enforcement.5
The feature that marginal tax rates are heavily influenced by the deduction status of the taxpayer makes it even more important to use actual tax data, as opposed to household surveys: without detailed information on tax deductions, one cannot calculate the marginal tax rates correctly.
Our focus on taxable income as opposed to labor supply itself is motivated by a long research line in public economics (Feldstein, 2002). The early research focusing on the effect of taxation on labor supply – as reviewed by Heckman (1993) – suggested that the labor supply of primary earners is rather insensitive to tax rates. Following the seminal paper of Feldstein (1995), a new literature has emerged which has been analyzing a broader context of labor supply. This approach is based on the observation that taxable income can vary not only with labor supply, but also with work effort, household investment, tax-deductible activities, the form of compensation, or with a change in tax compliance. Moreover, all these components are crucial both for assessing the deadweight loss of taxation and for revenue predictions of tax reforms. As summarized and surveyed by Gruber and Saez (2002), there is ample evidence that taxable income is quite sensitive to taxation.
1 Introduction
1See for example: Ivanova et al. (2005) on Russia, and Moore (2005) on Slovakia.
2Gorodnichenko et al. (2008) is an empirical attempt to measure the response of tax evasion to the Russian tax reform, using a household panel survey. 3This point is further elaborated in Papp and Takáts (2008).
4There is some empirical literature on the behavioral effects of taxation in Hungary. Examples include: Semjén and Tóth (2004), and Vidor (2005).
5Hungary has recently strengthened its employment legislation in order to reduce tax evasion. This campaign, however, started only in 2006 (see for example Eppich
Taxable income can adjust through three main channels: (i) taxpayers indeed work more, better or more intensively, and thus produce higher income, (ii) taxpayers declare a bigger portion of their total earnings, i.e., there is a decrease in tax deductions and avoidance, and finally, (iii) there is a shift between wage income and fringe benefits. Though one cannot separate these three elements based on tax file data, any other data source would lead to a much less precise estimate of the total effect. Besides data availability and the important feature of the analyzed episode that there were changes in tax rates without changes in enforcement,the relationship of taxable income and labor tax rates in Hungary is an issue interesting on its own right. In an OECD comparison, Hungary has the third highest overall labor tax wedge; while its labor income tax revenue per GDP ratio is around the OECD median (see Figure 1).
This aggregate cross-section evidence suggests an important elasticity of taxable income to taxation in Hungary. Maybe surprisingly, our Hungarian estimates indicate that the elasticity of taxable income to marginal tax rates is quite low for the upper 70% of wage earners (those earning at least the minimum wage) – in contrast to the canonical US findings of around 0.4 (Gruber and Saez, 2002), it is around 0.06. This means that wage income taxation leads to little welfare losses, but for a large enough change in marginal tax rates, even these low elasticities imply a substantial change in taxable income. Moreover, the elasticity is much higher for the upper 20% of the income distribution (0.34), and for some groups, it is as high as 0.45, meaning that high marginal tax rates do lead to substantial distortions in certain income ranges.
The population average coefficient of average tax rates (the income effect) is zero for the upper 70% of the income distribution, but, unlike Gruber and Saez (2002), we find a very significant and substantial income effect for the upper 20% (-0.27). It means that the uncompensated taxable income elasticity is around 0.06 in both income subsamples – an increase in average tax rates makes taxpayers poorer and induces them to generate more income (“work more”), almost matching the reduction due to higher marginal tax rates. Consequently, an uncompensated tax increase (when marginal rates are raised but tax brackets are not adjusted to compensate taxpayers for losses) is very likely to increase revenues.
Now consider a flat tax experiment which is designed to be revenue neutral without any behavioral response. This means that there is some increase in marginal and average tax rates for low and middle income taxpayers; while for high income taxpayers, there is some decrease in average tax rates and a substantial decrease in marginal tax rates. Taking into account the heterogeneity of compensated elasticities and income effects over the income distribution, one can expect a non-negligible
MAGYAR NEMZETI BANK
Figure 1
Labor tax wedges and labor income tax revenue per GDP ratios in OECD countries
35 30 25 20 15 10 5 0 10% 15% 20% 25% 30% 35% MEX TUR DEN SW HUN 40% 45% 50% 55% 60% pit+sec/GDPtax wedge on labour (as a % on labour cost, at 100% of AWP) Source: Krekó and P. Kiss (2007), OECD 2004, 2005.
increase in total income and also in income inequality. Indeed, our hypothetical flat income tax6simulation shows a parallel
improvement in budget revenues and after-tax income (2% and 1.4%, respectively). Though positive, these improvements are rather modest. Moreover, there are important changes in the income distribution, and the overall burden falls heavily on taxpayers in income deciles 5-7.
Comparing our results to those of the US literature, we get quite comparable elasticities for high income taxpayers, and much smaller elasticities for the entire sample. In our view the difference between the two overall elasticity results can be traced to differences in tax schemes. In the US, most deductions are applied to taxable income, and as Gruber and Saez (2002) highlight, the taxable income sensitivity is to a large degree due to such itemized deductions. In Hungary most of the deductions in the personal income scheme are subtracted directly from the tax itself, which does not affect taxable income. Self-employed individuals (entrepreneurs), on the other hand, are able to deduct various expenses from their tax base and there is indirect evidence that they do so excessively (Krekó and P. Kiss, 2007). However, the majority of entrepreneurial income is taxed separately in Hungary. It is less surprising to find a low elasticity for taxable income (which only contains income falling under the personal income tax scheme). In fact, the surprising finding is that high income individuals do exhibit substantial elasticities even without having access to deductions from the tax base.
The paper is organized as follows. Section 2 reviews the most relevant empirical literature in some details. The next section explains our empirical approach, section 4 presents and discusses our main results. Section 5 performs three revenue prediction exercises, while section 6 concludes. Finally, the Appendix contains some skipped details.
INTRODUCTION
6Our hypothetical flat tax system is a bit different from a “textbook flat tax”: it provides tax exemption up to the minimum wage, but levies a uniform social security
The key parameter of interest is the elasticity of taxable income with respect to the change in thetax price(net-of-tax income per marginal pretax dollar, i.e., one minus the marginal tax rate). The elasticity estimates are diverse, ranging from Feldstein’s (1995) result at the high end to close to zero at the low end. This variety reflects the different approaches applied in these papers such as the different definition of income, sample and source of identification. Below we give a brief overview of the evolution of the consensus US estimates for taxable income (see Gruber and Saez, 2002, for details), and comment on some international results.
The applied empirical strategy is very similar in all these papers. They estimate the effect of the tax price on the taxpayers’ income (in logs):
(1) where yitis taxable income, MTRitis the marginal tax rate, ciis the fixed effect for individual iand ytis a time-specific effect. The variables xiin are individual characteristics that do not vary over time, but may have a time-varying effect on yit(like wealth, entrepreneurial skills, regional dummies). Finally, βis the elasticity of taxable income, the key parameter of interest. Equation (1) is estimated in first differences.
Lindsey (1987) analyses the U.S. personal tax cuts from 1982 to 1984, measures the response of taxpayers to changes in income tax rates and then uses the results to predict the revenue maximizing rate of personal income taxation. The paper finds large tax elasticities: the results of the constant elasticity specification are always above one. Because of data limitations, he does not use panel data, instead, he compares taxpayers in similar income percentiles for different time periods. The main limitation of this approach is that it assumes a static income distribution over the investigated period.
To overcome this problem Feldstein (1995) uses a US Treasury Department panel of more than 4000 individual’s tax returns before and after the 1986 tax reform. The analysis compares tax returns for 1985 and 1988, and finds an elasticity of at least one.
Auten and Carroll (1999) also analyze the effect of the 1986 tax reform using a larger panel of tax returns of 14,425 taxpayers. They report a significantly lower (0.6) tax-price elasticity. Besides data issues, the major reason for the difference is the inclusion of additional controls (“nontax factors”), past income in particular. This highlights the need of controlling for individual income profiles (mean reversion).
Gruber and Saez (2002) use a long panel of tax returns over the 1979-1990 period with roughly 46,000 observations. They relate changes in income between pairs of years to the change in marginal rates between the same pairs of years with a time length of three years. Their empirical strategy distinguishes the income and substitution effect of tax changes.
To identify these effects separately, they need variations in the average tax rate7that are orthogonal to variations in the
marginal tax rate. This is supplied by the fact that the same change in the marginal tax rate implies a different change in the average tax rate for individuals with different incomes within the same tax bracket. In case of a single tax episode, however, that variation can be highly correlated with initial income controls, which are crucial to account for mean reversion and, as the authors argue, changes in the overall income distribution. Using a long panel dataset covering many tax reforms, they overcome all these difficulties and find that the overall elasticity of taxable income is approximately 0.4, which is primarily due to a very elastic response of taxable income for taxpayers who have incomes above $100,000 per year and for itemizer taxpayers. They also find an insignificant income effect.
log(1
)
,
it i t t i it it
y
= + +
c
γ α
x
+
β
−
MTR
+
u
2 Related literature
7
Gruber and Saez (2002) work with virtual income instead of the average tax rate. Virtual income is the intercept of the budget line using the current tangent (one minus the marginal tax rate) as its slope. Non-labor income differs from virtual income as long as the marginal tax rate is not constant. The Appendix shows that virtual income and the average tax rate lead to the same specification.
Using a methodology similar to Auten and Carrol (1999) and an exceptionally large dataset (nearly 500,000 prime age taxpayers) covering the 1988 Canadian tax reform, Sillamaa and Veall (2001) find that the responsiveness of income to changes in taxes is substantially smaller in Canada (0.25) than in the Auten and Carrol (1999) study for the US. They also report much higher responses for seniors and high income individuals.
Aarbu and Thoresen (2001) find even lower elasticity measures for Norway analyzing the 1992 Norwegian tax reform. They employ a panel dataset of more than 2000 individuals, and find that estimates for the elasticity of taxable income range between -0.6 and 0.21. Focusing on regressions which contain a measure for mean reversion in income, their baseline estimates are between 0 and 0.21.
In contrast, Ljunge and Ragan (2005) obtain comparable compensated elasticities to Gruber and Saez (2002), of around 0.35, for the Swedish tax reform in 1991 (“the tax reform of the century”), using a six-year panel of 109,000 individuals. However, they also find a sizable and significant income effect, implying a much lower uncompensated elasticity.
METHODOLOGY
We estimate the effect of the change in the marginal tax rate on the taxpayers’ reported taxable income following a slightly modified version of Gruber and Saez (2002). Taxpayers derive utility from consumption c and disutility from income generation efforts (‘labor’) y,and face a budget set which is locally linear: c=y(1–τ)+R.Here τis the marginal tax rate (one minus the local slope of the budget line) and R is the intercept of the local budget line (virtual income). Utility maximization yields an income supply function y(τ,R)– see point A1in Figure 2. Notice that a tax change in general affects both the marginal tax rate and the intercept of the budget line (or alternatively, the average tax rate, ATR) – see point A2in Figure 2.
Consequently, the response of income to a tax change (dτ,dR)can be written as:
Introducing the uncompensated tax price elasticity parameter βu=(1–τ)/y(∂y/∂(1–τ)), the income effect parameter
φ=(1–τ)∂y/∂Rand the compensated tax price elasticity β=βu
–φ (from the Slutsky equation), we obtain
For non-infinitesimal tax changes, it is more appropriate to discretize this equation in a log-log specification. Replacing dy/y
by Δlogy, dτ/(1–τ) by Δlog(1-MTR)and (dR-ydτ)/(y(1-τ))by Δlog(1-ATR),8we get
(2) Looking back to Figure 2, one can see now the key intuition beneath the empirical separation of the substitution effect (β)
and the income effect (φ). Without a behavioral response, taxpayer A moves from point A1to A2, while B moves from B1to B2. This implies the same change in the marginal tax rate for both, but a different change in their average tax rate, as the increased marginal tax rate applies to a different fraction of their income.
(
1
)
log
(
1
)
.
log
log
y
i=
Δ
−
MTR
i+
Δ
−
ATR .
iΔ
β
φ
( )
.
1
1
dy
d
dR yd
y
y
τ
τ
β
φ
τ
τ
−
=−
+
−
−
( )
1
.
y
y
dy
d
dR
R
τ
τ
∂
∂
=−
+
∂ −
∂
3 The empirical framework
Figure 2
The nonlinear budget set
y A1 R1 R2 A2 yA yB B1 B2 c Slope: 1-τ1 Slope: 1-τ2 8
In addition to the terms in equation (2), income may change from year to year due to nontax factors as well. As Auten and Carroll (1999) and Gruber and Saez (2002) point out, one needs to control for additional covariates xithat do not vary over time but may have a time-varying effect on income (such as wealth or entrepreneurial skills), and initial income y0(to control for mean reversion in income and changes in the overall income distribution). This gives our full specification:
(3) Notice that this also coincides (apart from the presence of the average tax rate) with the first difference of equation (1). The endogeneity of actual tax rates is a major problem in estimating equation (3). The Appendix contains a formal discussion of the identification procedure; here we only outline its main ingredients. On the one hand, the MTR can change both because of the change in legislation (exogenous variation) and because of an unexplained shift of taxable income (endogenous variation). This latter is characteristic of progressive tax systems: a negative income shock can cause – holding other factors fixed – a decrease in the MTR.
This means that cov(Δlog(1–MRTi),ui)≠0, hence all parameter estimates are inconsistent. To overcome this problem, the usual procedure9is to instrument the log change in the true tax price by the log difference of the synthetictax price in 2005
and the actual tax price in 2004. We calculate this synthetic MTR (SMTR) by applying the 2005 rules to inflated 2004 income and tax allowances. The synthetic MTR is the marginal tax rate that would have been applicable in 2005 had the taxpayer’s real income not changed.
There is an identical endogeneity problem with the average tax rate as well, which can be treated by instrumenting the second period 1-ATR by the synthetic 1-ATR. We calculate this synthetic ATR (SATR) similarly to SMTR.
To use the synthetic tax rates as instruments, they need to be exogenous in equation (3) and correlated with the appropriate realized tax rate once the other explanatory variables have been netted out. If the error term ui is uncorrelated with all the right hand side variables, then the exogeneity of the instruments is satisfied by construction, because they are calculated using the 2004 income inflated to 2005. We check the second condition using first stage diagnostic tests (partial F statistics). We also report a test for the exogeneity of realized tax rates (the C-statistics), and the Kleibergen-Paap rk statistics for the rank condition.10
It is important to take a closer look at the role of initial income. Some taxpayers who have unusually high or low incomes in 2004 may experience large offsetting changes. This mean-reversion effect can bias the tax price elasticity estimates: a negative correlation between the income innovation ui and initial income y0iof equation 3 makes the error term correlated with initial and synthetic tax rates,too.
The exclusion of low income taxpayers from the sample can limit this bias, but in order to further control for the mean reversion effect, we include initial income in the model as Moffitt and Wilhelm (2000) suggest, and also allow an income-dependent intercept and initial income coefficient (following Gruber and Saez, 2002). This should lead to an error term ui
that is uncorrelated with initial income. This way we also treat the problem of changes in the income distribution: a widening of the income distribution, for example, would induce a positive correlation between uand y0i.
MARGINAL TAX RATE (MTR)
The variable of interest is the difference of the logarithm of the tax price11for a taxpayer in 2005 and 2004. The tax reform
episode reduced the number of tax brackets from three to two, increased the employee tax credit, raised the annual maximum of pension contributions and introduced a gradual, income-dependent phase-out of certain tax allowances (also raising
( )
log
( )
'
log
(
1
)
log
(
1
)
.
log
y
i=
y
0i+
x
iΔ
+
Δ
−
MTR
i+
Δ
−
ATR
i+
u
iΔ
γ
α
β
φ
THE EMPIRICAL FRAMEWORK
9For example, Auten and Carroll (1999), Gruber and Saez (2002) follow this approach.
10This exogeneity test estimates the equation assuming that all right hand side variables are exogenous, using the instruments as additional orthogonality conditions,
and then tests the exogeneity of the realized tax rates with the C-statistics. The Kleibergen-Paap rk statistics test for the full rank of the instruments (rank condition), in a heteroskedasticity-robust way. See Baum et al., 2007 for details.
marginal tax rates for some). These led to various changes in marginal and average tax rates.12The Appendix contains a
detailed description of the episode.
In general, it is hard to describe these tax changes as a function of taxable income itself. For example, if a tax deduction is phased out gradually above certain income levels, that leads to an increase in the marginal tax rate, depending on both income and deduction status. Moreover, all deductions and the employee tax credit are limited by broad income and not taxable income.13
The distribution of average and marginal tax rates in 2004 (which include social security contributions as well), and the full impact of all changes (including the “bracket creep” of not adjusting tax brackets to inflation) is summarized by Figure 3. For better visibility, we drop individuals above an annual income of 10,000,00014and use a 5% random sample.
The top left panel indicates that the average tax rate broadly increases with taxable income, though it starts decreasing at very high income levels (due to the annual maximum of pension contributions). Various tax deductions, however, lead to large individual differences. The top right panel plots marginal tax rates, and we see that the highest marginal rates are faced by two groups of taxpayers: those who just lose their eligibility for the employee tax credit (income range 1,000,000-2,000,000), and those who lose their eligibility for various tax deductions.15
MAGYAR NEMZETI BANK
Figure 3
Tax rates in 2004, and the 2004-2005 change in the log of synthetic tax prices in our sample
.1 .2 .3 .4 .5
Average tax rate
0 2,000 4,000 6,000 8,000 10,000
2004 income Average tax rates, 2004
-2 -.1 0 .1 2 Log change 0 2,000 4,000 6,000 8,000 10,000 2004 income Change in log(1-ATR), 2004-2005 1 .5 0 -.5 Log change 0 2,000 4,000 6,000 8,000 10,000 2004 income Change in log(1-MTR), 2004-2005 .2 .4 .6 .8
Marginal tax rate
10,000 0 2,000 4,000 6,000 8,000
2004 income
Marginal tax rates, 2004
12Elements of the social benefit system also have incentive effects and affect the marginal effective tax rate. Scharle (2005) argues that the marginal effectivetax rate
can be exceptionally high on low income levels, despite the fact that the tax system is designed to be progressive. It is important to note that in our analysis we only take into account the effects of the tax schedule, tax credit and social security contribution modifications and not the changes in the social benefit system. However we limit our sample to individuals above the minimum wage, therefore most taxpayers who are eligible for any social benefit are left out anyway.
13Broad income consists of wage income, non-wage labor income (the sum of these two is our taxable income measure), and other, mostly capital incomes (taxed
separately).
14The exchange rate is around 250 HUF per euro. An annual income of 10,000,000 corresponds to the top 0.5 percentile of the income distribution.
15One such example is the tax deduction for certain computer purchases (‘SULINET’ program). There is full deduction below an income level of 3,400,000, no deduction
above 4,000,000, and a gradual phase-out in between. This leads to an extra 10% marginal tax rates for those with some deductions in the income range 3,400,000-4,000,000.
The bottom two panels describe the change in the log of one minus the average and marginal tax rates (a decreasethus means a risein tax obligations). There is a general decline in the average tax rate for low and medium income taxpayers, though not universally (exceptions are largely due to the bracket creep). The most important variation in the marginal tax rate corresponds to the 636,000-4,000,000 income range (30 to 95 percentile of the income distribution). This is partly due to the employee tax credit – the legislative change points towards a decrease, but the bracket creep again leads to an increase for some. Another major source is the unchanged income limit of various tax deductions, leading to both increases and decreases. For high income taxpayers, there is some effect of the 6,000,000 overall tax deduction income limit, the increase in the annual pension contribution limit, and the introduction of an income limit to the family tax allowance. Overall, there is a substantial and non-obvious variation in average and marginal tax rates.
DATA
The source of data for our analysis is a Hungarian Tax and Financial Control Administration (APEH) panel of individual tax returns for the years 2004 and 2005. This dataset was prepared for the Hungarian Ministry of Finance and it contains data from the personal income tax forms 0453 and 0553 (unaudited). The random sampling was done by the tax authority choosing 250,000 anonymous individuals for the year 2004, and matching their tax returns for the year 2005. It is natural that some individuals fall out from the sample between years, thus the panel for the second year contains 8,9% less observations. It is still an exceptionally large panel including more than 227,000 individuals, about 5% of all taxpayers. We limit our sample by leaving out individuals with extreme rates of income changes (over 500 or below 1/500 – 16 observations). We also drop observations with nonzero foreign income (1336 observations), as it would be hard to compute their true marginal and average tax rates. Besides, those individuals are likely to differ from the rest of the population. We further drop a small number of additional observations (a total of 202) where certain data cells violate the tax code in a way that affects the tax obligation of the taxpayer. Regional indicators are missing from 583 observations. Then we limit the sample to taxpayers who filed in both years, which leads to a sample of 215,315. From this population, we limit our attention to those who had taxable income above the compulsory annual minimum wage in 2004 (636,000), a sample of 150,141. Finally, we exclude observations where reported and calculated employee tax credit numbers differ significantly (5423 observations, of which 3465 is above the minimum wage) in either tax year.16We certainly do a robustness check whether
this last deletion has an effect on our estimates (and it does not). Our full income sample has 209,892 observations; of which 146,676 are above the 2004 minimum wage.
Following the literature and Auten and Carroll (1999) in particular, we include a set of individual characteristics in the regression that are likely to be correlated with income changes. Taxpayer’s wealthis likely to be correlated with the ability to alter portfolios and labor arrangements as taxes change, thus we include a dummy for declaring any capital income in 2004 or 2005. Entrepreneurial statusmay reflect the ability of income shifting between different tax categories and the propensity of risk taking, therefore a dummy is included for income from any kind of self-employment income in 2004 or 2005. The life cycle and family status of the individual can have an effect on income changes, thus we include the age of the taxpayer in 2004, its square and a dummy for family based on claiming the family allowance.17We apply urban dummiesto control for
the difference in income growth in urban and rural areas (Aarbu and Thoresen 2001): we use a dummy for the capital
(Budapest),another for the 19 county capitals; and also a regional dummy to control for regional differences. There might be different opportunities for income growth based on gender differences. Although occupation may have a significant effect (Auten and Carroll, 1999), the dataset does not allow us to control for that.
One also needs to control for the mean-reversion of income, and potential changes in the income distribution. We include
initial incomein the model as Moffitt and Wilhelm (2000) suggest, and also allow an income-dependent intercept and initial income coefficient (following Gruber and Saez, 2002).
THE EMPIRICAL FRAMEWORK
16In these cases, the difference is between 2.1 and 12.25. This difference is negligible for the average tax rate, but it might be influential for the marginaltax rate of
some. See footnote 22 for details.
17There is no reliable information on family status in Hungarian tax reports. People claiming the family tax allowance certainly have children, but others who are not
The synthetic change in the marginal (average) tax rate is the difference in the logarithm of one minus the synthetic and the actual 2004 marginal (average) tax rate. It is calculated as follows. The 2004 income, deductions and most allowances18are
inflated to 2005 using the official statistics office annual average inflation for 2004 (6.8%). The synthetic tax rates are then equal to the appropriate tax rates of the inflated income using the 2005 tax rules. The detailed program codes are available from the authors upon request.
The dependent variable in the model is the difference in the logarithm of income in the years 2005 and 2004. Income is defined as the total income that is covered by the personal income tax schedule.
Table 1 presents the descriptive statistics of the variables in our total working sample and in the subsample of individuals with income above the 2004 minimum wage.
MAGYAR NEMZETI BANK
18
Some allowances correspond to delayed claims, which means that eligibility comes from a period prior to 2005, but the deduction itself has not been utilized for some reason. We assume that there were no behavioral responses in such cases, thus the inflated allowance was set equal to the realized allowance.
Variable
Total working sample Income above 636th
Mean Std. Dev. Mean Std. Dev.
Δlog taxable income 0.10 0.57 0.03 0.39
Δlog (1 – marginal tax rate) 0.02 0.23 0.04 0.26
Δlog (1 – exogenous marginal tax rate) 0.03 0.13 0.03 0.15 log 2004 gross income 6.88 0.96 7.33 0.61
Δlog (1 – average tax rate) 0.01 0.07 0.01 0.07
Δlog (1 – exogenous average tax rate) 0.00 0.02 0.01 0.02 Wealth dummy 0.29 0.45 0.36 0.48 Age in 2004 39.86 11.82 40.71 11.10 Age in 2004 squared 1728.38 989.79 1780.54 930.85 Entrepreneurship dummy 0.17 0.37 0.16 0.36 Family dummy 0.28 0.45 0.34 0.47 Gender dummy 0.53 0.50 0.53 0.50 Budapest dummy 0.18 0.39 0.19 0.39 Regional capital dummy 0.41 0.49 0.42 0.49 Observations 209,892 146,676
Table 1
Table 2 presents our basic results for those who earned at least the annual minimum wage in 2004 (the upper 70% of the income distribution). Model 1 includes only one regressor, the tax price. Models 2-4 gradually add further controls: first initial income, then the income effect (the change in the average tax rate), and the full set of individual characteristics (the coefficients of the regional dummies are not reported). Finally, Model 5 allows the initial income coefficient and the constant to differ across income deciles (coefficients not reported). In all cases, the exogeneity of the realized tax rates is strongly rejected, while all first stage diagnostic statistics and rank tests are perfect for the instruments.
The estimates for the tax price are significant in all specifications and vary between 0.0494-0.0743, depending on the controls included. This range is lower than most tax elasticity estimates for other countries (for example Auten and Carroll, 1999: 0.6; Gruber and Saez, 2002: 0.4 for the US; Sillamaa and Veall, 2001: 0.14 for Canada; or Aarbu and Thoresen, 2001: 0.21, for Norway; Ljunge and Ragan, 2005: 0.35 for Sweden). The difference between these elasticities can be a natural consequence
Robust standard errors in parentheses. * significant at 5%; ** significant at 1% level
Model 5 includes separate initial income and constant terms for the ten income deciles of the sample.
ΔΔlog taxable income Model 1 Model 2 Model 3 Model 4 Model 5
ΔΔlog (1 – marginal tax rate) 0.0743** 0.0528** 0.0501** 0.0494** 0.0648**
(0.011) (0.011) (0.011) (0.011) (0.016)
Δlog (1 – average tax rate) 0.145* 0.340** -0.0673 (0.064) (0.067) (0.065) Log 2004 gross income -0.0231** -0.0252** -0.0311**
(0.0022) (0.0025) (0.0028) Wealth 0.0294** 0.0265** (0.0024) (0.0023) Age 0.0143** 0.0135** (0.00094) (0.00091) Age squared -0.000208** -0.000197** (0.000012) (0.000011) Entrepreneurship 0.0196** 0.0139** (0.0034) (0.0034) Family -0.0039 -0.00653** (0.0022) (0.0021) Gender 0.00746** 0.00712** (0.0022) (0.0021) Budapest 0.00226 0.00361 (0.0051) (0.0048) Regional capital 0.00012 -0.000853 (0.0028) (0.0027) Constant 0.0288** 0.199** 0.213** (0.0011) (0.016) (0.018) p-value of the Kleibergen-Paap rk statistics
(full rank of the instruments) 0 0 0 0 0 p-value of the C statistics
(exogeneity of marginal and average tax rates) 0 0 0 0 0 First stage partial F
For the marginal tax rate 10978.05 10840.36 5665.87 5709.65 2928.02 For the average tax rate 3549.76 3318.36 2577.54 Observations 146,676 146,676 146,676 146,676 146,676
Table 2
Main results, 2004 income above 636,000
4 Estimation results
of the characteristics of the different tax systems, even if individuals in different countries exhibit identical behavioral responses (Slemrod, 1998).
Initial income is highly significant and its inclusion decreases the key elasticity by one third, while the further inclusion of the income effect and additional controls has a limited impact on the tax price elasticity. Though the income effect appears to have the wrong sign in Models 3 and 4,19it becomes insignificant once we allow for our most flexible control for changes in
the income distribution (Model 5).
Most of the control variables behave the way we expected. For example, wealth has a positive effect on the income change, family, as a proxy for having children, decreases the possibility to adjust income to tax rate changes.
The results change substantially if we concentrate on a middle income sample (2004 income above 2,000,000, top 20%).20
As Table 3 shows, the coefficient for our key regressor is now around 0.3. Initial income is still significant and it decreases the tax price elasticity estimate by 20%. The income effect has the right sign, it is quite significant and it decreases the tax price elasticity further. Additional covariates (particularly the flexible controls for initial income) then reverse this decline. Given that Model 5 has the richest set of covariates, that the income-dependent coefficients do influence certain parameters (particularly the income effect) and the finding of Gruber and Saez (2002) that mean-reversion and the change in the income distribution are more complicated than a pure control for the log of initial income, we treat Model 5 as our benchmark. Under that choice, we get a compensated elasticity of 0.337 and an uncompensated elasticity of 0.07 in the top 20% sample; and an elasticity of 0.065 in the top 70% sample, both compensated and uncompensated.
ROBUSTNESS
First we explore whether the age composition of our sample matters. Table 4 compares results for three age groups, adding a restricted sample (18-60) and prime age (23-55) for both income samples we used so far. All regressions contain the full set of controls (Model 5), with income deciles corresponding to the sample at hand. For the sample above 636,000, the tax price elasticity tends to decrease as we restrict the age composition; while for the sample above 2,000,000, the tax price elasticity increases, and the income effect coefficient becomes smaller. These changes, however, are quite modest in size.
Next we run our benchmark regression on various income groups separately. The subgroups are mostly defined in line with the tax code: 636,000-2,000,000 is roughly the range where the employee tax credit still applies; 2,000,000-4,000,000 is a range where most deductions are still active or are just being phased out; while 6,000,000 is the cutoff for the new deduction phase-out introduced in 2005.
MAGYAR NEMZETI BANK
19If log (1 – ATR) increases, that corresponds to a decrease in the average tax burden, implying an increase in net disposable income. If leisure is a normal good, its
consumption should go up, hence the generation of income (‘labor supply’) should go down (φ< 0).
20This is the range where employee tax credit is already completely phased out under the 2005 tax code; thus the variation in synthetic tax prices is not due to changes
ESTIMATION RESULTS
Robust standard errors in parentheses. * significant at 5%; ** significant at 1% level.
Model 5 includes separate initial income and constant terms for the ten income deciles of the sample.
ΔΔlog taxable income Model 1 Model 2 Model 3 Model 4 Model 5
ΔΔlog (1 – marginal tax rate) 0.402** 0.325** 0.268** 0.290** 0.337**
(0.052) (0.051) (0.047) (0.050) (0.059)
Δlog (1 – average tax rate) -0.654** -0.384** -0.267* (0.11) (0.12) (0.12) Log 2004 gross income -0.0763** -0.0849** -0.0788**
(0.0064) (0.0065) (0.0069) Wealth 0.0168** 0.0169** (0.0041) (0.0043) Age 0.0209** 0.0216** (0.0022) (0.0022) Age squared -0.000281** -0.000289** (0.000027) (0.000027) Entrepreneurship 0.0196** 0.0203** (0.0053) (0.0054) Family -0.0120** -0.0113* (0.0044) (0.0045) Gender 0.0016 0.00167 (0.0044) (0.0045) Budapest -0.0014 -0.00144 (0.0089) (0.0091) Regional capital 0.000727 0.000391 (0.0056) (0.0057) Constant 0.0171** 0.634** 0.721** (0.0022) (0.051) (0.053) p-value of the Kleibergen-Paap rk statistics
(full rank of the instruments) 0 0 0 0 0 p-value of the C statistics
(exogeneity of marginal and average tax rates) 0 0 0 0 0 First stage partial F
For the marginal tax rate 722.23 711.97 360.72 361.98 317.52 For the average tax rate 867.33 762.01 745.33 Observations 41,819 41,819 41,819 41,819 41,819
Table 3
Main results, 2004 income above 2,000,000
Robust standard errors in parentheses. * significant at 5%; ** significant at 1%.
The p-values for the Kleibergen-Paap rk statistics and the C-statistics are zero in all columns.
ΔΔlog taxable income
Income above 636,000 Income above 2,000,000
All ages 18-60 23-55 All ages 18-60 23-55
ΔΔlog (1 – marginal tax rate) 0.0648** 0.0592** 0.0576** 0.337** 0.353** 0.357**
(0.016) (0.016) (0.014) (0.059) (0.060) (0.060)
Δlog (1 – average tax rate) -0.0673 -0.0524 -0.0306 -0.267* -0.234 -0.155 (0.065) (0.064) (0.063) (0.12) (0.12) (0.12) First stage partial F
For the marginal tax rate 2928.02 2857.76 2982.12 317.52 308.22 298.13 For the average tax rate 2577.54 2521.08 2353.07 745.33 736.46 696.73 Observations 146,676 143,185 129,961 41,819 40,451 36,238
Table 4
The numbers in Table 5 suggest that the 0.0648 overall tax price elasticity is a mix of an even lower elasticity (0.0292) in the range of 636,000-2,000,000 and a much higher elasticity above 2,000,000. This higher elasticity, on the other hand, comes mostly from the income range 2,000,000-4,000,000. Above 4,000,000 the estimate becomes very noisy: it gets much smaller and its standard error increases. Our interpretation is that the exogenous variation in tax rates in this income range is insufficient for estimating the tax price elasticity (as indicated by the little variation in the synthetic marginal tax rate in Figure 3).21The income effect, on the other hand, comes mostly from high earners. This apparent backward bending labor supply
may in fact reflect their bargaining power, allowing them to bargain about their after-tax wage. At longer time horizons, we are likely to see this income effect decreasing as bargaining should matter less.
Finally, we check whether the elimination of those taxpayers who had potential problems with their reported employee tax credit numbers matter for the income and substitution effect parameters.22As Table 6 suggests, the estimates change very little.
MAGYAR NEMZETI BANK
Robust standard errors in parentheses. * significant at 5%; ** significant at 1%.
The p-values for the Kleibergen-Paap rk statistics and the C-statistics are zero in all columns.
ΔΔlog taxable income 636,000to top to 2,000,000636,000 2,000,000 to top to 4,000,0002,000,000 2,000,000 4,000,000 to 6,000,000 to top
ΔΔlog (1 – marginal tax rate) 0.0648** 0.0292 0.337** 0.451** 0.379** -0.0517
(0.016) (0.015) (0.059) (0.060) (0.060) (0.31)
Δlog (1 – average tax rate) -0.0673 0.0443 -0.267* -0.0502 -0.0402 -0.918* (0.065) (0.077) (0.12) (0.13) (0.13) (0.46) First stage partial F
For the marginal tax rate 2928.02 3032.96 317.52 288.83 313.83 25.34 For the average tax rate 2577.54 1818.28 745.33 664.52 675.83 101.88 Observations 146,676 104,857 41,819 31,494 37,609 10,325
Table 5
2SLS regression results for different income groups
Robust standard errors in parentheses. * significant at 5%; ** significant at 1%.
The p-values for the Kleibergen-Paap rk statistics and the C-statistics are zero in all columns.
ΔΔlog taxable income 636,000– 636,000–2,000,000 2,000,000–
without with without with without With
ΔΔlog (1 – marginal tax rate) 0.0648** 0.0562** 0.0292 0.0335* 0.337** 0.336**
(0.016) (0.014) (0.015) (0.015) (0.059) (0.060)
Δlog (1 – average tax rate) -0.0673 -0.0157 0.0443 0.104 -0.267* -0.244 (0.065) (0.066) (0.077) (0.078) (0.12) (0.13) First stage partial F
For the marginal tax rate 2928.02 3558.43 3032.96 3261.54 317.52 317.34 For the average tax rate 2577.54 2616.30 1818.28 1879.84 745.33 726.78 Observations 146,676 150,141 104,857 108,247 41,819 41,894
Table 6
The inclusion of taxpayers with problems in their reported employee tax credit
21
Another factor contributing to the insignificant tax price elasticity for the high income group is that a large part of the change in their MTR reflects an increase in pension contributions, which are much better linked to direct future benefits to the same taxpayer than overall taxes.
22
Employee tax credit is calculated based on wage incomecapped by the monthly minimum wage times the number of eligible months, and then it is phased out according to broad income. The ‘number of eligible months’ variable is missing from our original dataset. We recovered this variable by allowing its value to go from 0 to 12 and selecting the one with which we get back the reported tax credit (with a rounding error of 2.1, which allows for multiple rounding errors before summing up). For around 5500 taxpayers, none of the values 0-12 were able to replicate their reported tax credit. We attribute this to the fact that tax credit rules are quite complicated and our data contains unaudited tax files. The difference never exceeds 12.25, which means that this problem is negligible for the average tax rate. The phase-out of the employee tax credit, however, creates complicated patterns for the marginal tax rate, which might be sensitive to such miscalculations.
Summing up, we find lower elasticities for our larger sample than other empirical studies. Concentrating on a medium-high income sample, on the other hand, leads to an elasticity of around 0.3, already in the high range of the international evidence. As Gruber and Saez (2002) indicate, high tax price elasticities for the U.S. are likely to be driven by itemizing, which is a cost reduction status that can be chosen by all taxpayers. Employees are also entitled to some cost deductions in Hungary, but their coverage and impact is very limited.23This is likely to reduce tax price elasticity, as a major margin of adjustment is
missing. Combining this observation with the fact that we had only a one year difference between our pre- and post-reform observations, our elasticity results are rather high.
ESTIMATION RESULTS
23
In our sample, roughly 10% of all taxpayers report some cost deductions. The average deduction, however, is 163, compared to the average income of 3041 in this group. Running separate regressions for this group reveals no significant difference in their tax price elasticity.
To illustrate the quantitative importance of our results, we simulate the effect of actual and hypothetical changes in the Hungarian tax system on taxable income and the government budget.24We would stress upfront that our calculations do not
take all potential behavioral effects into account: adjustment of labor demand is missing, and the extensive margin of labor supply (the participation decision) is only partially captured.25
Two particular cases are presented first – a low and a high income range where the marginal tax rate changed. In these scenarios we use 2004 incomes and abstract from inflation, meaning that we apply the behavioral response to non-inflated 2004 income. Then we simulate the full population taxable income and budget revenue implications of a hypothetical flat income tax proposal in 2005.
Table 7 shows the effect in the 720,000-756,000 income range where the marginal tax rate changed from 49.5% to 31.5% (due to changes in the phase-out of employee tax credit). The number of taxpayers in 2004 who have taxable income within
5 Revenue predictions
24We include both personal income tax and social security receipts in the budget revenue figures. We first show the revenue from employee contributions, and then
the sum of employee and employer contributions. Employer contributions are calculated as 32% of the total pretax income. In reality, the tax base is slightly smaller, but the difference is negligible. We also take into account that for a large number of taxpayers, a certain part of social security contributions (8% of income up to the annual limit) is channeled towards private pension funds and not to the central budget (although the Maastricht criteria allows for a temporary deduction from the budget deficit due to private pension fund payments). We approximate this fraction as the ratio of private pension fund members in 2005 (2,509,000, according to official data the website of the Hungarian Financial Supervisory Authority) to the number of individuals filing a tax return in 2005 (4,374,000, according to the website of APEH).
25Another caveat is that the aggregate response may differ from the sum of individual responses, due to labor demand constraints. In our case, however, it is probably
less of an issue, since the labor market of high earners (who exhibit a substantial tax price elasticity) is dominantly supply-driven
Source: own calculations and Tax and Financial Control Administration.
Notes: All numbers are in thousand HUF. The calculations assume only wage income and employee tax credit but no deductions or any tax allowance. * The tax price increased by 35.64 percent from 50.5% to 68.5%. This increase has to be multiplied by the calculated elasticity to get the change of
taxable income (e.g. 0.3564*0.0292=0.0104). 2004 – Before reform
Average income in 2004 734 Personal income tax 20 Social security contributions (employee) 65 Social security contributions (employer) 235 Total tax in 2004 320
Tax price elasticity 0 0.0292 0.0648
2005 – After reform
Δin taxable income* 0.00% 1.04% 2.31%
Average income in 2005 734 742 751 Personal income tax 9 10 12 Social security contributions (employee) 65 66 67 Social security contributions (employer) 235 237 240 Total tax in 2005 309 314 319
Δpaid tax -11 -7 -1 Number of taxpayers in this income range 95,601 95,601 95,601
Δin the budget (in thousand HUF) -1,057,352 -627,179 -102,722
Table 7
this range was 95,60126and their average income was 733,867. The second part of the table presents the post-reform situation
with three different tax price elasticities (and no income effect). If there is no behavioral response (first column) the post-reform income is the same as the before post-reform, and the tax cut increases the burden of the budget by around 1,057 million. However if we apply the estimated tax price elasticity of 0.0292 (second column), the average taxable income increases as the marginal tax decreases, and thus the total amount of tax in 2005 is higher than without any response. This means that with a 0.0292 tax price elasticity (taken from column 2 of Table 5) the burden of the budget increases not by 1,057 million but only 627 million. The third column shows what would happen in the case of a higher elasticity, 0.0648 (column 1 of Table 5). In this case the tax cut would result in a decrease of the budget’s revenue by around 103 million.
Table 8 shows the effect of the change of the marginal tax rate from 43% to 51.5% in the 5,307,000–6,000,600 income range.27The table is split into two parts, one with the part of the income below 5,307,000 and one with the part above. The
first column of the table shows that without any behavioral response (no income and substitution effect) the raise in marginal tax rate increases the budget’s revenue by approximately 322 million.
Adding the income effect (but no substitution effect) increases this number to 598 million (column 2). Adding a bigger and bigger substitution effect (0.0648, the entire population elasticity estimate, then 0.337, the estimate above 2,000,000 and finally 0.451, the estimate in the range 2,000,000-4,000,000) this revenue change gradually becomes more and more negative, turning to a dismal decrease by around 6.85 billion in column 5!28Notice that even social security contributions
decline in the last two columns.
The full impact of this increase in the annual pension contribution limit, however, is much larger, as there is a revenue gain from taxpayers with income above 6,000,600 (who face unchanged marginal tax rates). Moreover, as their ATR increases, the income effect implies a positive response of their income. Using that there are 77,073 taxpayers in this range with an average income of 10,034,850, they increase their total tax contribution by 2,091 billion (3,747 billion with the income effect).
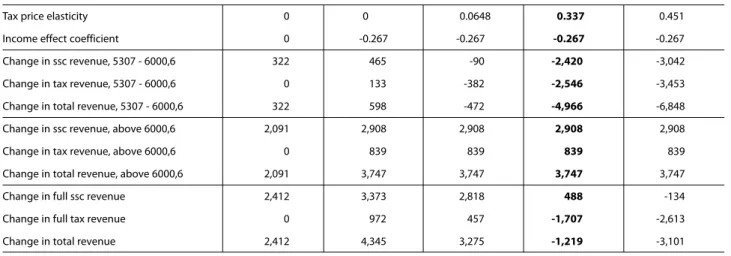
Table 9 displays the full impact of the tax change. Estimates for the change in the government budget range from 4,345 million (only income effect) to -3,101 million (income effect, highest substitution effect). Using our benchmark elasticity estimate, the impact is a decline of -1,219 million, which is substantially lower than the no behavioral response prediction (2,412 million). There is also a notable redistribution from the tax budget to the social security budget in columns 4 and 5.
REVENUE PREDICTIONS
26Though APEH publishes some statistics about the distribution of income, it does not contain the income range at hand. For this reason, we first calculate the number
of taxpayers with income between 720 and 756 in our sample (5232), and then multiply by the ratio of the entire taxpayer population in the income range 700-750 (127761) to the number of taxpayers with income between 700 and 750 in our sample (6992). This latter ratio is 18.272.
27Our calculations quantify the impact of this single change in the tax code. It thus neglects tax deductions, the changes in average and marginal tax rates they may
imply, and also the elimination of the middle tax bracket.
28This huge difference is partly due to the fact that the average income in this range is quite close to the bottom of the income bracket. If that is the case, an increase
MAGYAR NEMZETI BANK
Source: own calculations and Tax and Financial Control Administration. Notes: All numbers are in thousand HUF.
* The tax price decreased by 14.91% from 57% to 48.5%. This decrease has to be multiplied by the calculated elasticity to get the change of taxable income (e.g. -0.1491*0.336=-0.0501). The average tax rate (on the average income 5637.4) has increased from 0.467 to around 0.472, a 0.93% decrease in 1-ATR. This subtracts 0.25% from the overall income decline (-0.0503 + 0.0025 = -0.0478). The calculation neglects any tax allowances and assumes that the only tax change was the increase in MTR, thus it neglects the decline in the ATR brought about by the elimination of the middle tax bracket. Taking that into account would have changed the contribution of the income effect from -0.25% to 0.25%.
2004 – Before reform
Average income in 2004 5,637 Part of income below 5,307th HUF
Personal income tax 1,773 Social security contributions (employee) 473 Social security contributions (employer) 1698 Sum 3,944 Part of income above 5,307th HUF 330 Personal income tax 126 Social security contributions (employee) 17 Social security contributions (employer) 106
Sum 248
Total tax in 2004 4,192
Tax price elasticity 0 0 0.0648 0.337 0.451
Income effect coefficient 0 -0.267 -0.267 -0.267 -0.267
2005 – After reform
Δin taxable income* 0.00% 0.25% -0.72% -4.78% -6.48% Average income in 2005 5,637 5,651 5,597 5,368 5,272 Income range 0 - 5,307
Personal income tax 1,773 1,773 1,773 1,773 1,759 Social security contributions (employee) 473 473 473 473 470 Social security contributions (employer) 1,698 1,698 1,698 1,698 1,687 Sum 3,944 3,944 3,944 3,944 3,916 Income above 5,307- 330 344 290 61 0 Personal income tax 126 131 110 23 0 Social security contributions (employee) 29 31 26 5 0 Social security contributions (employer) 106 110 93 20 0 Sum 261 272 229 48 0 Total tax in 2005 4,205 4,216 4,173 3,992 3,916
Δpaid tax (total) 13 24 -19 -200 -275 Number of taxpayers in this range 24,887 24,887 24,887 24,887 24,887
Δin the budget (total) 321,592 597,736 -472,078 -4,965,957 -6,848,037
Table 8
Effect of the marginal tax rate increase in the 5,307,000-6,000,600 income range
Finally, we quantify the implications of a hypothetical flat income tax proposal of a tax rate of 30,3% above the 2005 minimum wage (684,000) and a 13,5% social security contribution rate. These rates are applied to all components of taxable income. This means that tax deductions are eliminated; and all incomes that used to be part of the tax base but were previously untaxed (like scholarships) are now taxed the same way as any other personal income items.
The single tax rate is chosen such that the proposal is revenue neutral in case of no behavioral response. Eliminating the tax exempt status of the minimum wage would imply a combined rate of 32%. This is close to CEE flat tax rates, but those flat tax schemes also involve a tax-exempt income range. Consequently, our 13.5+30.3% rate is high compared to other flat tax rates in the CEE region.29
Let us stress that this reform does not change the overall tax rate below the minimum wage. Our reasons are twofold: on the on hand, we do not have reliable estimates for taxpayer behavior below the minimum wage; and on the other hand, a raise in the marginal and the average tax rate for this income group is likely to involve substantial social tensions.30
We apply this tax scheme to 2005 income data under three scenarios. Scenario 1 assumes no behavioral effect at all. Scenario 2 assumes no income effects and the appropriate substitution effect (an elasticity of 0.0291 for incomes in 684,000-2,000,000 and 0.336 above 2,000,000). Scenario 3 works with the same substitution effect and adds the income effect (a parameter of -0.271) above 2,000,000. Though such a large tax change may induce larger behavioral responses, the literature does not point to a particularly important nonlinearity.
As this tax scheme still makes the marginal and average tax rate endogenous, we predict income changes the following way. First we calculate the ‘no behavioral response’ case by inserting original 2005 incomes into the new tax scheme. Then we calculate the change in income implied by the realized marginal and average tax rates corresponding to scenario one. This new income leads to different realized tax rates, with which we update our income estimate. This iterative process leads to a solution where our predicted post-reform incomes are consistent with the appropriate realized tax rates.31
Figure 4 depicts the change in the average and marginal tax rates (the former is calculated under Scenario 3) as a function of pre-reform 2005 income (in a 2% random sample for better visibility). It is immediate to see that there is a substantial increase in the average tax rate between the minimum wage and 2,000,000; and most of the fall in the marginal tax rate concentrates in the range 2,000,000-6,000,000. We will return to the former property in the incidence analysis; while the latter is quite desirable, since taxable income is quite sensitive to the tax price in that income range.
REVENUE PREDICTIONS
Tax price elasticity 0 0 0.0648 0.337 0.451 Income effect coefficient 0 -0.267 -0.267 -0.267 -0.267 Change in ssc revenue, 5307 - 6000,6 322 465 -90 -2,420 -3,042 Change in tax revenue, 5307 - 6000,6 0 133 -382 -2,546 -3,453 Change in total revenue, 5307 - 6000,6 322 598 -472 -4,966 -6,848 Change in ssc revenue, above 6000,6 2,091 2,908 2,908 2,908 2,908 Change in tax revenue, above 6000,6 0 839 839 839 839 Change in total revenue, above 6000,6 2,091 3,747 3,747 3,747 3,747 Change in full ssc revenue 2,412 3,373 2,818 488 -134 Change in full tax revenue 0 972 457 -1,707 -2,613 Change in total revenue 2,412 4,345 3,275 -1,219 -3,101
Table 9
Total revenue impact of the social security contribution increase (in millions of Ft)
29Ivanova et al. (2005) gives an international comparison: flat tax personal income tax rates range from 12% to 19%. Based on more recent and more comprehensive
comparisons (Keen et al., 2006 and www.worldwide-tax.com), this range is between 10% and 25%. Ivanova et al (2005) also report that there was an additional social security contribution rate and a tax-exempt ‘zero bracket’ in Russia, while Moore (2005) indicates the same for Slovakia.
30Actual flat tax schemes are often similar. For example, the flat tax scheme in Slovakia involves a single rate above some tax-exempt threshold, and social security
contributions are kept separately.
31In practice, this procedure is much simpler. Without an income effect, there is only one necessary adjustment: those who start above 684,000 but would go below as
a response to higher marginal tax rates bunch at exactly 684,000. Anyone who remains above the minimum wage will be subject to a marginal tax rate of 43.8%. For the income effect, we first use the ‘no behavioral response’ ATR (calculated in Scenario 1). This leads to some income change, which then implies a slightly different realized ATR. In the next step, we modify our predicted income change by the log difference of these two (one minus) ATRs, multiplied by the income effect coefficient. Then we calculate the corresponding ATR again and repeat the previous step till convergence. After the second step, the change becomes negligible.
There is also a decline in marginal tax rates below the minimum wage. This is due to the fact that our hypothetical tax scheme determines tax obligations based solely on taxable income, while the original 2005 tax scheme often used broad incometo determine the tax payment on taxable income. As a matter of fact, most taxpayers earning below the 2005 minimum wage would experience no change in their marginal tax rate (34,436 out of 49,647).
Table 10 summarizes the main implications of our flat income tax. Without a behavioral response, there is no change in budget revenues and taxable income. Adding the substitution effect leads to a 2.77% increase in revenues, together with a 1.88% increase in after-tax income. These numbers become somewhat smaller as we add the income effect: a 2.06% increase in revenues and a 1.39% increase in after-tax income. If one gives up the revenue gain, the 30.3% tax rate can be reduced to 27.9%. That would imply a 2.1% increase in pre-tax income and a 3.9% increase in after-tax income. These effects are substantial – total pretax income is approximately one third of total GDP in Hungary, which is the base of the 32% employer contributions, and the approximately 32% income tax and employee contribution32–, but we do not see such a “miracle” as
flat tax proponents would like.
There are, however, notable changes in the income distribution (due to the nature of our data, we are talking about the distribution of taxpayer individual and not household income). In pretax income, the most substantial change is in the 90-10 percentile (p10) and the p50 ratio, an increase of 4-5.5%. In after-tax income, there are similar changes in the p90-p10 ratio, but all ratios involving the median are much higher. This is in line with our observation that there is a substantial increase in the average tax rate between the minimum wage and 2,000,000 (see Figure 4). The Gini coefficient of pretax income increases from 0.46023 to 0.4655; while for after-tax income, it increases from 0.38529 to 0.40116.33This increase
is partly driven by the change in tax rates, and partly by the behavioral response: without the latter, the after-tax Gini would be 0.39582.
MAGYAR NEMZETI BANK
Figure 4
Average and marginal tax rates: before and after the flat income tax scheme
.1 .2 .3 .4 .5 0 2,000 4,000 6,000 8,000 10,000 original income post-reform ATR
Panel A: average tax rates
average tax rate
0 .2 .4 .6 .8 2,000 4,000 6,000 8,000 10,000 original income pre-reform MTR post-reform MTR
Panel B: marginal tax rates
32It means that a truly flat income tax system would need a 32% key to be revenue neutral (in the case of no behavioral responses).
33These changes in the Gini coefficient are roughly similar to typical annual changes in the Gini coefficients of per household member income, individual income and
individual labor income. Most percentile ratios, on the other hand (like p90/p10) change much more during our hypothetical reform than in a typical year (Kapitány and Molnár, 2005). Note that our calculations cannot take into account individuals without taxable income and redistribution within households. Consequently, these Gini numbers cannot be directly compared to typical measures of income inequality across households. Still, as Benedek and Lelkes (2006) suggests, the distribution of household income and individual income are quite similar.
REVENUE PREDICTIONS
Figure 5
The percentage change in after-tax income by 2005 after-tax income deciles
-10 -8 -6 -4 -2 0 2 4 6 8 10 1 2 3 4 5 6 7 8 9 10
No behavioral response Only subst. effect Subst. and income effect
Notes: For a full description of the three scenarios, see the main text. Variables like p90/p10 refer to the ratio of the 90 and 10 percentile of the income distribution.
Behavioral effects considered
none only subst. subst. and income
Percentage change in total
Budget revenue (employee part only) 0.04 3.31 2.45 Budget revenue (employee and employer) 0.02 2.77 2.06 pretax income 0 2.30 1.71 after-tax income -0.02 1.88 1.39 Pretax income, % change in
p90/p10 0 5.08 4.18 p90/p50 0 5.64 4.74 p10/p50 0 0.56 0.56 p75/p25 0 2.16 2.16 p75/p50 0 2.17 2.17 p25/p50 0 0.00 0.00 Gini (pre reform: 0.46023) 0.46023 0.46038 0.4655 After-tax income, % change in
p90/p10 0.07 4.62 3.81 p90/p50 11.48 17.03 16.10 p10/p50 11.23 11.78 11.78 p75/p25 -2.40 -0.54 -0.54 p75/p50 5.90 7.73 7.73 p25/p50 8.55 8.25 8.25 Gini (pre reform: 0.38529) 0.39582 0.403536 0.40116