1. Introduction
In the second half of 1997 it became extremely common for political leaders as well as journalists to argue that foreign investors exert a destabilizing influence on stock prices. Foreign investors were often blamed for the dramatic difficulties of the East Asian countries and for the collapse of their stock markets. For instance, Stiglitz (1998) called for greater regulation of capital flows, arguing that “…developing countries are more vulnerable to vacillations in international flows than ever before.” Academics have argued that foreign investors can have a destabilizing effect for a variety of reasons. For instance, Dornbusch and Park (1995) argue that foreign investors pursue positive feedback strategies that make stocks overreact to changes in fundamentals and more recently Radelet and Sachs (1998) attribute the East Asian economic crisis to financial panic. If foreign investors indeed can destabilize economies, the benefits from opening markets to investors from all countries are substantially weakened and perhaps reversed. It is therefore crucially important to understand whether this is the case.
This paper examines the impact of foreign investors on stock returns in Korea over the period from November 30, 1996, to the end of 1997. This period includes Korea’s dramatic economic crisis during the last few months of 1997. A good measure of the intensity of this crisis is that a dollar invested in Korea’s stock market index on October 1, 1997, would have been worth 35 cents on the last day of trading of 1997. Our study is made possible by the availability of information for each trade on the Korean Stock Exchange that allows us to classify buying and selling investors into three categories: Korean individual investors, Korean institutional investors, and foreign investors. These data enable us to investigate the pattern and impact of order imbalances by institutions, individuals, and foreign investors during the trading day as well as across days. A number of studies, e.g. Bohn and Tesar (1996) and Clark and Berko (1996), show
a positive contemporaneous relation between equity flows and stock returns using monthly data.1 Such a relation could hold if foreign investors are positive feedback traders, if foreign investors have a permanent impact on stock prices, and/or if the foreign investors are good market timers and invest before prices increase.2 With our data, we can differentiate between these possible views of the relation between equity flows and stock prices.
We find evidence of positive feedback trading for foreign investors before the Korean crisis period for the market as a whole and for individual stocks. Foreign investors have more price-setting buys in the day following a positive market return and more price-price-setting sells following a negative market return. However, the price-setting order imbalances of foreign investors are dwarfed by the price-setting order imbalances of Korean domestic investors. When we turn to evidence of positive feedback trading for individual stocks, we find strong evidence that foreign investors buy stocks that did well the previous day and sell stocks that performed poorly. Regression results show that trading by foreign investors is positively related to lagged stock and market returns. When we turn to the crisis period, the evidence of positive feedback trading becomes much weaker. Stock excess returns still have a positive effect on order imbalances, but the effect of the market return disappears. We find no impact of foreign exchange returns on trading by foreign investors.
If foreign investors engage in positive feedback trading, one would expect them to herd since they would be buying as a group and selling as a group. We find dramatic evidence that this is the case. We use the herding measures developed in Lakonishok, Shleifer, and Vishny (1992) and Wermers (1998) and find them to be significantly positive. These herding measures are extremely large for large stocks compared to the herding measures for institutional investors in the U.S. For
1
For a review of the earlier studies that use monthly data, see Stulz (1997). Bailey, Chan and Chung (1998) investigate the Tequila effect using trades on the NYSE without being able to distinguish trades by foreign and domestic investors. They find no significant evidence of such an effect for foreign stocks traded on the NYSE.
2
Sias and Nofsiger (1998) make a similar point concerning the assessment of herding by domestic institutional investors using low frequency (monthly or yearly) data. They note that herding measured this
instance, looking at U.S. mutual funds, Wermers (1998) never finds a herding measure in excess of 5% using quarterly data while we report herding measures in excess of 20% for large stocks that have performed well using daily data. However, during the Korean crisis period, the herding measures are generally insignificant except for the largest stocks.
Given that foreign investors engage in positive feedback trading and herd, we then investigate whether their trading is destabilizing. Neither positive feedback trading nor herding are necessarily destabilizing. In particular, it could be that the trades of foreign investors are associated with permanent price changes because they lead to price discovery or changes in risk premia. The concern about positive feedback trading is that it makes stock prices overshoot to new information. Consequently, if trades by foreign investors destabilize markets, one would expect large sales (buys) by foreign investors that decrease (increase) prices to be followed by further price declines (increases).3 We address this issue through two distinct event studies. With the first study, we measure abnormal returns for the eleven minute intervals centered on five-minute intervals with large foreign order imbalances for the stocks in our sample. With the second study, we use days instead of five-minute intervals. Considering first intraday data, we find that a large buy by foreign investors is associated with a stock price increase for the five minutes during which the large buy takes place and a price increase for the next five minutes. After that, there are no positive significant returns. Large sell imbalances by foreign investors are associated with a stock price fall that is partially reversed over the next twenty-five minutes of trading. The last three months of 1997 do not seem to differ from the rest of the sample with respect to the intraday returns surrounding large foreign trade imbalances.4
way is consistent with positive feedback trading at high frequency as well as with domestic institutional investors having a permanent impact on prices.
3
See DeLong, Shleifer, Summers, and Waldmann (1990) for an analysis of the potential destabilizing effects of positive feedback trading.
4
Interestingly, the pattern of returns around large foreign imbalances is not very different from the evidence for block trades in the U.S. For example, Holthausen, Leftwich and Mayers (1990) find that most of the effect of a large block trade on the NYSE is permanent and takes place with the trade itself.
When we look at the daily returns, we find that days with a large foreign net buy imbalance for a stock are followed by reversals before the last three months of 1997, but not during the Korean crisis period. Rather surprisingly, days with large foreign selling imbalances for a stock have a positive market adjusted return before the last three months of 1997. Such a result is consistent with trades by Korean individuals having a much stronger impact on returns than trades by foreign investors. Days with large selling foreign imbalances correspond to days with large buying imbalances by Korean individuals. During the last three months of 1997, days with large net sell foreign order imbalances do not have significant market adjusted returns. Even raw returns on the days that have large foreign net sell foreign order imbalances are not significantly negative. There is therefore no convincing evidence that foreign investors played a destabilizing role.
The paper proceeds as follows. In Section 2, we introduce our data and present information on foreign holdings of stocks. In Section 3, we investigate whether foreign investors engage in positive feedback trading and how their trading compares to domestic trading. In Section 4, we test for herding. In Section 5, we look at the intraday and daily returns associated with large foreign imbalances. We conclude in Section 6.
2. The Korean Stock Exchange and sample construction
The Korean Stock Exchange (KSE) holds two trading sessions on each weekday: a morning session and an afternoon session. The morning session operates from 9:30 through 11:30 and the afternoon session starts at 13:00 and closes at 15:00. Batch auctions are used three times a day to determine the opening prices of each session and the daily closing prices. There are no trades during the last 10 minutes of each day when orders are collected for the closing batch auction of 15:00. Trading prices during the rest of the trading hours are determined by continuous (or non-batch) auction. On Saturdays, there is a morning session only and the closing price is determined by the batch auction. The KSE does not have designated market makers. Buyers and sellers meet
via the Automated Trading System (ATS). Before November 25, 1996, only limit orders were allowed. However, since then markets orders are allowed as well.
The database used is the intersection of two separate databases. The raw data for these databases was provided by the KSE, and compiled by the Institute of Finance and Banking (IFB) at Seoul National University. The first database includes all transactions for the period from 1993 to 1997 on the KSE. This database has each order time-stamped as of the time that it arrives to the exchange. The data provide information on the country of residence of investors as well as on whether they are individuals or institutions. The second database has daily foreign ownership data from November 30, 1996, through the end of 1997 for all stocks listed on the KSE. Foreign investors in Korea have to register with the Securities Supervisory Board (SSB) and obtain an ID number before they can start trading stocks. Through this ID number, the SSB controls the foreign ownership limit for each company and each foreign investor by informing the KSE whether a foreign order satisfies the company and investor limits. The limit for a foreign investor limit was 5% of a firm’s shares until May 2, 1997, when it increased to 6%. It then increased to 7% on November 3, and to 50% on December 11, 1997. The foreign ownership limit for a firm’s shares is 20% until May 2, 1997, when it increases to 23%. The limit increases to 26% on November 3, 1997 and then finally to 50% on December 11, 1997. There is no record of daily foreign ownership prior to November 30, 1996. Since we need both databases for our study, we are therefore constrained to use the sample period of the daily foreign ownership database.
Our analysis is carried out on two types of trades. First, we use all trades, regardless of who initiates the trade. Since we are concerned about the impact of trades by foreign investors on prices, we would like to identify those trades that are most likely to affect prices. To that effect, we consider what we call price-setting trades. In an earlier study of the impact of institutional trading practices on stock returns, Sias and Starks (1997) classify transactions as buy or sell initiated based on a tick-test. This is not necessary here since we know which party initiated the trade. A buy-side (sell-side) price-setting trade for foreign investors is a trade where the buy (sell)
order of the foreign investors came after the sell-side (buy-side) order and hence made the trade possible. For price-setting trades, we can therefore only consider trades that take place during the non-batch auction period. We consider split trades originated from one order as one trade irrespectively of whether we consider all trades or only price-setting trades.
The sample of stocks we use is constructed as follows. We start from the common stocks whose foreign investment ceiling is 20% at the end of November 1996. Some firms had a different ceiling and are excluded. These firms are government-operated firms and firms with direct foreign investment by foreign firms. A large number of stocks have infrequent trading by foreign investors. We therefore require stocks to have more than 20 days of foreign price-setting trades from December 2, 1996, to October 31, 1997. We also exclude stocks that are at the foreign ownership limit on December 2, 1996, since foreign investors cannot buy shares in these stocks without having other foreign investors sell shares. The sample we are left with consists of 414 common stocks out of about 760 listed on the KSE in November 1996.
Table 1 provides information on foreign ownership by size deciles at the end of November 1996 as well as information on foreign volume and on foreign price-setting volume for the period from December 2, 1996, to December 27, 1997. As documented by Kang and Stulz (1997) for Japan, foreign ownership is strongly positively related to size. For the smallest decile of Korean stocks, median foreign ownership is 2.09%. It increases to 13.48% for the largest decile. The average foreign ownership is 3.16% within the smallest decile and 11.89% for the largest decile. Overall, average foreign ownership is 6.47% and median foreign ownership is 4.52%. Although we do not reproduce these results in a table, we find that the median market model beta of the stocks held by foreign investors is 1.05 and the mean beta is 1.01. There is therefore no evidence that foreign investors choose stocks that have different systematic risk than the typical stock. Table 1 shows that foreign investors are not trading disproportionately relative to their volume and the volume of their price-setting trades is not disproportionate either. These results contrast with the results of Tesar and Werner (1995) that the turnover rates of foreign
investors in Canada, the UK, and the US are higher than the turnover rates of domestic investors in these markets.
It is useful to compare foreign ownership in our sample versus foreign ownership in the market as a whole. The average foreign ownership across stocks is higher at the beginning of our sample period in our sample (6.47%) than in the market as a whole (5.69%). In contrast, value-weighted foreign ownership, defined as the value of shares held by foreign investors divided by the market capitalization, is higher in the market as a whole (12.00%) than in our sample (9.38%). The difference between the equally-weighted and value-weighted measures is due to the fact that foreign investors hold more stocks in large companies and that the foreign ownership limit is more likely to be binding for large capitalization stocks than for other stocks.
3. Are foreign investors positive feedback traders?
The concern expressed about foreign investors is that they are positive feedback traders. A positive feedback trader is a trader who buys when the market increased and sells when the market fell. Investors can be positive feedback traders for rational reasons or because of behavioral biases. Investors who pursue portfolio insurance strategies as well as investors with extrapolative expectations are positive feedback traders. Investors with such strategies are often viewed to be destabilizing because their sales lead the market to fall further and their purchases increase prices further. Positive feedback traders are often blamed for the stock market crash of 1987. In some models, positive feedback trading leads to bubbles where prices depart from fundamentals and to crashes when bubbles burst. Besides contributing to the volatility of stock returns, it is argued that such trading leads to destabilizing capital flows. This is because equity investors rush into countries whose stock markets are booming and flee from countries whose stock markets are falling.
Foreign investors may act like positive feedback traders without destabilizing equity markets. One reason for this is that greater foreign ownership can lead to a lower risk premium
for stocks in a country since the risks of these stocks can be better shared internationally. As a result, a period when foreign investors enter a market can also be a period when the market is doing well because of these investors. Equity markets also become more receptive to foreign investors as economies liberalize. Liberalization itself leads to stock market appreciation and in this scenario this appreciation is followed by inflows of foreign equity investments.5 Finally, in models that emphasize information asymmetries between domestic and foreign investors such as Brennan and Cao (1997), foreign investors learn more from stock returns than domestic investors do. This is because stock prices impound the information that domestic investors have and hence price increases reveal the domestic investors’ favorable information to foreign investors. Since this information leads investors to have more favorable expectations for stock returns, it leads them to invest more without acting irrationally.
Figure 1 shows the time-series of the KOSPI index, of the Won/USD exchange rate, and of various measures of foreign ownership. Using our sample, foreign investors hold 4.62% of a firm’s shares on average at the end of the sample period compared to 6.47% at the beginning of the sample period. The same pattern, though less pronounced, holds for the market as a whole where average ownership falls from 5.69% to 5.04%. Using a value-weighted measure of foreign ownership, however, there is no drop in ownership for the market as whole. In contrast, the fraction of the capitalization of our sample stocks held by foreign investors falls. For the market as a whole, foreign investors own 12.00% of the market capitalization at the start of our sample period and 14.73% at the end. In contrast, in our sample, foreign investors own 9.38% at the start of our sample period and 9.04% at the end. It is important to note, however, that while the share of the market capitalization held by foreign investors increases for the market as a whole, the dollar value of the Korean shares held by foreign investors fell dramatically because of the fall both in equity values and in the dollar price of the Won which are documented in Figure 1. Korea
5
See Bekaert and Harvey (1998a,b) and Henry (1997) for evidence on the relation between liberalization and stock market appreciation.
experiences a stock market collapse during the last three months of 1997 that looks like a bursting bubble. There is, however, no evidence that there was a bubble-like phenomenon before the crisis period driven by foreign investors. There is also no evidence that stocks start falling because of a withdrawal of foreign equity investors.
Figure 1 shows that if positive feedback trading by foreign investors had a significant impact on stock price behavior in Korea, it must have been subtler than implied by the most aggressive critiques of the influence of foreign investors. Figure 2 provides the net trading volume of foreign investors on a daily basis. It is clear there that, starting with the end of September 1997, foreign investors are net sellers every day for the stocks in our sample. This is consistent with a withdrawal of foreign equity investors. However, it has to be kept in mind that when we look at levels of foreign ownership, there is simply no collapse. At the same time, however, the behavior of the foreign investors in Figure 2 is largely consistent with the view that these investors sell in falling markets and buy in rising markets. The period of mostly foreign net buying is one when stock prices are increasing and the periods of persistent net selling by foreign investors are periods of falling stock prices.
To investigate whether the impression of positive feedback trading given by Figure 2 is statistically significant, we consider the price-setting order imbalance of investors conditioning on the sign of the market return of the prior day, on the same day, and on the next day for the period before the Korean crisis. We present the results in Table 2. The price-setting order imbalance is computed as the price-setting buy volume minus the price-setting sell volume by a class of investors for a day divided by the stock’s average daily price setting volume for the period. Table 2 provides the means for order imbalances across stocks after normalizing each stock’s order imbalance by that stock’s average price-setting volume over the sample period. There is evidence that foreign investors buy following a positive market return and sell following a negative market return. The same is true, however, for Korean individual investors. The contemporaneous relation between order imbalance and the sign of the market return is dramatic for Korean individual
investors. The order imbalances are much smaller for foreign investors and institutional investors. Finally, there are no significant differences between order imbalances for positive or negative lead market returns for either domestic investors or foreign investors.
The results for the Korean crisis period are quite different for foreign investors. Irrespective of the market return, foreign investors have a net sell order imbalance. This is not surprising in light of Figure 2. What is surprising, though, is that foreign investors sell more when the market is doing well than when it is doing poorly. Foreign investors have a significantly higher sell-order price-setting imbalance if the market was up the previous day than if it was down and they have a significantly higher sell-order imbalance if the market is up the same day than if it is down. Since domestic individual investors have large price-setting net buy order imbalances when the market was up the previous day or is up the same day, foreign investors are selling the most when domestic demand is the highest. This cannot be viewed as destabilizing behavior.
We investigated the relation between the sign of the market return and total order imbalances also, but do not report the results. The results for foreign investors are similarly supportive of the positive feedback trading hypothesis. The key difference in the results has to do with Korean individual investors. Because of the magnitudes of the price-setting order imbalances of Korean individual investors shown in Table 2, it is not surprising that Korean individual investors seem to be the counterparties to the price-setting trades of foreign investors as well as Korean institutions. As a result, the total order imbalances of Korean individual investors are systematically positive both before and during the crisis irrespective of the previous day, contemporaneous, or next day market return.
Western business hours are over when the Korean stock market is open. This could make the opening batch auction particularly important for foreign investors. We therefore investigated the trades during the opening batch auction. Though we do not report these results, they are consistent with the results we have discussed. The mean order imbalance of foreign investors
across stocks is positively related to the previous trading day market return, but not during the crisis period. Interestingly, this mean order imbalance is not related to the overnight market return. In contrast, the Korean overnight market return has a positive effect on the opening trades of Korean individuals and a negative effect on the opening trades of Korean institutions.
In Table 3, we investigate the extent of positive feedback trading looking at individual stock returns rather than market returns. We proceed as follows. On a given day, we compute each stock’s return in excess of the market. We rank these excess returns and form five portfolios each day. For each portfolio, we then compute the average normalized order imbalance of the stocks in the portfolio for the following day. The normalized order imbalance of a stock is the order imbalance divided by the stock’s daily average volume during the sample period. We find that for foreign investors before the crisis there is generally an increase in order imbalance as one moves from the stocks with the worst excess returns on the previous day to the stocks with the best excess returns. The difference in order imbalance between the two extreme portfolios is highly significant. This evidence is strongly supportive of the positive feedback trading hypothesis. In general, the order imbalances fall for individuals as one moves towards the portfolio with the highest return and increase for institutions. This is consistent with individuals being contrarians and institutions being positive feedback traders. However, institutions have sell-order imbalances for all portfolios except the fourth portfolio. When we turn to the results for the crisis period, the order imbalances generally increase for foreign investors as one moves from portfolio 1 to portfolio 5, but foreign investors are net sellers for all portfolios. Institutions are net sellers also, but the absolute value of their order imbalances first falls and then increases. Domestic individuals are net buyers, but they buy more of the stocks that have performed least well.
Except for the fifth portfolio that performed best, the order imbalances of foreign investors and institutional investors are not statistically different both before and during the crisis. In contrast, the order imbalances of foreign investors are significantly different from the order
imbalances of Korean individual investors before the crisis for all portfolios but the middle one and during the crisis for all portfolios.
We have now seen results relating order imbalances to the performance of the market and to the performance of individual stocks. To try to assess the relative importance of the market return and individual stock returns, we estimate regressions of individual common stock order imbalances on measures of the market return, the stock return, and the foreign exchange return. Since the stock return and the market return are correlated, we use as our measure of the stock return the residual of a regression of the stock return on the market return. Similarly, for the foreign exchange return, we use the residual of a regression of the foreign exchange return on the market return. In all our regressions, we include lagged, contemporaneous, and leading values for our independent variables. The average regression coefficients are reported in Table 4. The average coefficient of the lagged individual stock return residual for foreign order imbalances is positive and significant as one would expect if foreign investors are positive feedback traders. However, the coefficient of the lagged market return is positive and significant also, indicating that foreign investors trade in response to the market return. The foreign exchange residuals have insignificant coefficients, indicating that these residuals do not affect stock trading for foreign investors. Korean individual investors are again contrarian with respect to individual stock return residuals, but not with respect to the market return. During the crisis, it is much less clear that foreign investors are positive feedback traders. In particular, the coefficient of the lagged market return is no longer significant. Again, however, there is no evidence that the foreign exchange residuals affect stock trading. For the crisis period, Korean individual investors are also contrarians with respect to individual stock returns, but not with respect to the market return.
4. Do foreign investors herd?
We have seen that there is evidence that foreign investors are positive feedback traders. In this section, we evaluate the extent to which they herd. It could be that our evidence that foreign
investors are positive feedback traders is due to a small subset of foreign investors. However, if positive feedback trading is prevalent among foreign investors in general, then one would expect them to buy into stocks as a group and sell out of stocks as a group.
As a starting point for our investigation, Table 5 provides statistics for trading by foreign investors during our whole sample period. For the sixteen countries with trading reported separately, we find that fourteen countries are net sellers of shares. Such a result cannot be explained by chance at reasonable significance levels if the sign of the net trading is random across investors. This result is, however, consistent with herding. Most of the trading is done by investors from the U.K., U.S., and Malaysia. The U.S. investors buy the most shares and sell the most. Overall, over the sample period, U.S. investors are net sellers, but the net selling amounts to less than 10% of the shares bought. The U.K. investors trade less but their net selling is dramatic compared to the U.S. investors. The U.K. investors buy 110 million shares, but their net selling is about 83 million shares. Finally, the Malaysian investors buy more than the U.K. investors and their net selling is less than half the net selling of the U.K. investors. For both U.K. and U.S. investors, the value of the shares sold is greater than the value of the shares bought. Surprisingly, Malaysian investors do not exhibit the same pattern. These investors are also net sellers, but the value of the shares sold is less than the value of the shares bought. Investors from Canada and Taiwan actually bought more shares than they sold.
To investigate whether foreign investors herd, we follow the approach of Lakonishok, Shleifer, and Vishny (1992) and Wermers (1998) to estimate the importance of herding. We compute their herding measures using a daily horizon. For each foreign investor, we know the country of residence as well as the type of investor. There are investors from 47 countries and we have 14 investor types. This gives us 658 classes of foreign investors. We first investigate whether there is herding across these 658 classes using Lakonishok, Shleifer, and Vishny’s (1992) herding measure. This measure is computed as pit – E(pit) - Epit – E(pit), where pit is
investor classes, E(pit) is the expected proportion of foreign investor classes having a net purchase
on that day relative to all foreign investor classes. Epit – E(pit) is an adjustment factor
computed so that in the absence of herding the number of classes with net purchases follows a binomial distribution that we compute following Wermers (1998). We compute this herding measure for each stock each day using all 414 stocks. We create portfolios of stocks by sorting on size and past-week returns. These portfolios are equally weighted and rebalanced every week.
Table 6 shows the results of our herding tests when we use foreign investors of all classes across all countries. It is immediately apparent that the herding measures are uniformly positive before the Korean crisis. Wermers (1998) provides herding measures for U.S. mutual funds from 1975 to 1994. He splits his sample across size quintiles and past return quintiles. Looking at his data across all funds, the highest herding measure he finds is 4.10%. In Table 6, all our herding measures before the Korean crisis are larger than 4.10%. The highest herding measure we find before the Korean crisis is 20.6%, which is five times the highest measure that Wermers (1998) observes in his dataset. Wermers (1998) looks at herding over a quarter. In contrast, we measure herding on a daily basis. When measured over longer time intervals, herding could increase if not all institutions that move in the same direction do so on the same day or it could decrease if similar trades by institutions lead some institutions to trade in the opposite direction. The first possibility would seem to be more important than the second one. If this is the case, compared to herding among mutual funds in the U.S., herding of foreign investors in Korea before the Korean crisis is much higher. Another striking difference with Wermers’ (1998) results is that in our sample herding is especially large among large stocks. This is not surprising. Since foreign investment increases with firm size, foreign investors are much more likely to trade in the large stocks and hence, if they herd, are more likely to trade as a group in those stocks. Like Wermers (1998), however, we find that investors herd more in stocks that had high prior returns.
While there is strong evidence of herding prior to the Korean crisis, the evidence is much weaker during the crisis. Essentially, the herding measures are low for the four smallest size
quintiles. The measures are insignificant in many cases. This could be due to the lower number of observations than for the non-crisis period, but the point estimates are much lower also. However, when we look at large firms, there is still substantial evidence of herding, even though it is not as strong as before the crisis. It is not clear whether this apparent decrease in herding results from different reactions to the crisis across investors or from the lack of liquidity of markets as the crisis evolved. If foreign investors are trading in a liquid market, it is much easier for them to trade in the same direction than when the market dries up. If the explanation for the decrease in herding during the crisis is that the market was less liquid, one would expect that order imbalances would have a larger price impact during the crisis than before. We explore this issue in the next section.
One interesting question is whether investors from the same country herd. Instead of investigating herding across all foreign investor classes, Table 7 restricts the analysis to U.S. investors and measures whether trades by U.S. investors are in the same direction. In this analysis, we treat each trade on a day as made by a different investor because we have no way of attaching a particular trade to a particular investor. Hence, if a fund buys the same stock several times during the same day, we treat each purchase as a purchase by a distinct U.S. investor. Even though the results may overstate somewhat the degree of herding, they are quite interesting and parallel the results we obtain by investigating herding across foreign investor classes. Again, there is considerable herding for large stocks and especially those that performed well relative to other stocks. There is surprisingly strong evidence of herding during the Korean crisis for the subset of large firms that performed well. Generally, however, both before and during the Korean crisis, herding is lower among the small stocks. During the Korean crisis, herding is mostly weak except for the large stocks.
5. Do foreign investors have a destabilizing influence?
We have now seen that there is evidence of positive feedback trading on the part of foreign investors and that there is strong evidence of herding for these investors. The last question we want to address is whether these investors have a destabilizing influence. With the data available, we can address this issue through a small lens by looking at whether large trading imbalances by foreign investors are followed by price continuations and by an increase in volatility. For that purpose, we conduct two event studies. The first study uses intraday returns and the second uses daily returns. Our approach complements the studies that focus on the impact of capital market liberalization on stock market volatility. These studies generally find that opening a stock market to foreign investors does not increase its volatility (see Stulz (1997) for a review and Bekaert and Harvey (1998b) for more recent evidence), but they do not consider directly whether trades by foreign investors at times have a destabilizing impact.
5.1. Intraday event study
We divide each day into 46 five-minute intervals from 9:30 to 15:00, treating the time interval of 11:30-13:05 as a single interval containing the lunch break and similarly for the time interval of 14:45-15:00 containing an order collection period for the close.6 For each of the intervals for each of the 414 stocks over the sample period, we compute foreign order imbalances by subtracting foreign sell volume from foreign buy volume during the interval. We then select the five intervals for net buy (positive) imbalances and net sell (negative) imbalances with the largest foreign-order imbalances in absolute value for each of the 414 stocks. For each of the selected events, we examine stock returns from the previous fifth (-5) to the subsequent fifth (+5) interval surrounding the event. To avoid crossing day boundaries when we examine –5 to +5 intervals, the events are selected from the 7th interval (10:00-10:05) through the 41st interval (14:20-14:25), excluding the 25th interval (11:30-13:05) which contains a batch auction period. Among the
6
We exclude Saturdays since we have much less freedom in choosing an event that has a sufficient number of intraday intervals prior to and after an event.
events selected above, we exclude those with foreign order imbalances less than 1,000 shares in absolute value. The above sampling procedure is also applied to the case of the foreign price-setting volume.
Table 8 describes the samples constructed with our procedure. We report the results for the whole sample, the subperiod before the crisis, and the crisis period. Though we study the returns around the events using all the largest imbalances as well as the largest price-setting imbalances, we report only the results for the largest price-setting imbalances. These are trades initiated by foreign investors, so that we expect the impact of their imbalances to be the largest. For each class of events, we report raw returns, mean-adjusted returns, and the absolute value of the mean-adjusted returns. The mean-adjusted returns are obtained by subtracting from the return the sample mean return for the stock on the same day of the week and same time of day for the whole sample period to control for the well-known day-of-the-week effect as well as the time-of-the-day effect.
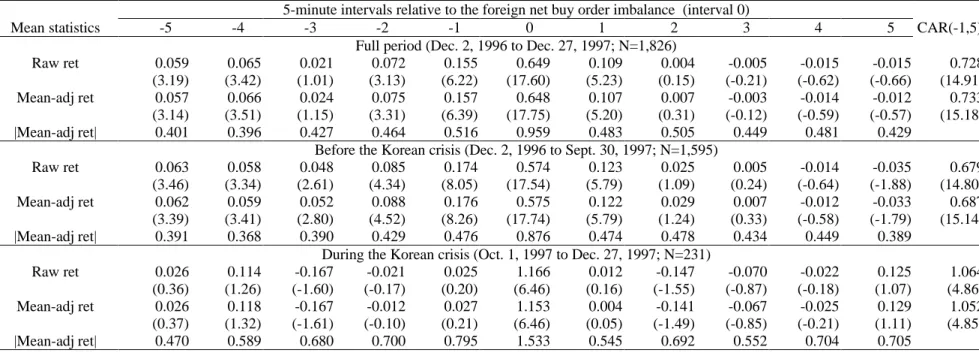
Panel A of Table 9 presents the returns for the 5-minute intervals for the five intervals preceding the event and the five intervals after it. It is immediately apparent that the largest price-setting net buy order imbalances occur following positive returns for the stock, so that foreigners buy following price increases. The price increase continues for one period after the purchase by foreign investors, but then the returns are insignificantly different from zero. There is a large contemporaneous positive return with the event, so that the large foreign net buy imbalance is associated with a large stock return. If there is positive information in the foreign net buy imbalance, it gets impounded in prices immediately since five minutes later prices seem to have adjusted. The absolute five-minute return is obviously large for the event period, but there is little evidence of a persistent sharp increase in volatility following the event.
The patterns for events before the Korean crisis are quite similar to those we have just discussed for the sample as a whole. The volatility five periods after the event is back to where it was five periods before the event. The patterns during the crisis are different, however. First,
there is no longer evidence that foreign net buy imbalances follow positive returns. Second, the impact of the event is larger. Third, the event seems to have no positive effect on subsequent returns. In particular, the return for the first period following the event is not significantly positive.
Though we do not report these results in a table, we investigated returns around the largest net buy imbalances instead of the largest price-setting net buy imbalances. The only noticeable difference is that the event returns are substantially smaller. For the whole sample period, the average mean-adjusted return is 0.347 in contrast to 0.648 in Table 9. This is not surprising since the sample in Table 9 used only trades initiated by foreign investors. Either way, however, it is clear that there is a significant positive return associated with the event and that it appears to be mostly a permanent price increase. There is no evidence that large buys by foreign investors are associated with positive significant mean-adjusted returns beyond the next five minutes, so that the market adjusts quickly and efficiently to the trades by these investors.
Panel B of Table 9 shows the analysis for the largest price-setting net sell events. One would expect this panel to have results that are symmetric of those in Panel A. Surprisingly, this is not the case. First, looking at the subperiod before the crisis, the returns are not negative before the event. In fact, the returns in the period immediately before the event are significantly positive. There is a large negative return associated with the event. In absolute value, it is slightly less than for the event in Panel A. Yet, after the event, we observe significant positive returns for four periods. As a result, the cumulative return associated with the event is quite small in absolute value and insignificant. It seems therefore that selling by foreign investors is followed by a reversal that is quite substantial in relation to the event return. The patterns during the crisis are similar, except that the event return is larger in absolute value, which makes the reversal smaller in relation to the event return. Neither before or during the crisis is there evidence that large foreign sales lead to a period of significant negative mean-adjusted returns. During the crisis, there are no significant positive returns before the event. However, there is no evidence that sales
by foreign investors lead to disproportionate event returns compared to purchases by foreign investors. During the crisis, the largest net sell imbalances have an average mean-adjusted return of –1.027%, while the largest net buy have an average mean-adjusted return of 1.153%.
The evidence on the largest net sales by foreigners is comparable to the evidence for block sales in the U.S. Holthausen, Leftwich and Mayers (1990) investigate the adjustment of prices to block sales since block sales are initiated by the seller. They consider the 50 largest downtick transactions for 109 firms selected randomly from December 1, 1982, to January 31, 1984. Strikingly, they find that the trade impact of the block trade is a mean-adjusted return of – 1.23% and that it is followed by a significant mean-adjusted return of 0.28%. In comparison, we find a adjusted return of –1.027% for the five minutes of the trade followed by a mean-adjusted return of 0.209% during the crisis period for the large sales by foreign investors!
5.2. Interday event study
The sampling procedure for daily events is similar to the one described earlier. That is, we compute daily foreign-order imbalances by subtracting foreign sell volume from foreign buy volume for the day for each of the 414 stocks (excluding Saturdays). We then select the five trading days with the largest absolute value order imbalance for each of the 414 stocks. For each of the selected events, we examine stocks returns from the previous fifth (-5) to the subsequent fifth (+5) trading day surrounding the event day. Among the selected events, we exclude those with daily foreign order imbalances less than 10,000 shares in absolute value. The above sampling procedure is also applied to the case of the daily foreign price-setting volume.7
For the daily event study, we present the results using the five largest imbalances rather than the five largest price-setting imbalances. The reason for this is twofold. First, as discussed above, for the price-setting imbalances we cannot capture all the imbalance in a day because we cannot include the batch auction in our sampling procedure. Second, foreign imbalances over a
7
We ignore batch auction trades for the case of the price-setting volume since it is impossible to define price-setting volume during batch auctions.
day are publicized in Korea, so that information as to whether foreign investors sold or bought is generally available. This information is about foreign imbalances rather than foreign price-setting imbalances. Table 10 summarizes the samples. All the mean and median imbalances increase after the crisis, but the increase is more dramatic for the net sell imbalances where the mean more than doubles. Table 11 presents our results, which now include market-adjusted returns.
From Panel A, we can see that before the crisis foreign investors buy stocks that have done well over recent days. Both the mean-adjusted and the market-adjusted returns are significantly positive every day before the event. On the day of the event, there is a large significant abnormal return. In contrast to the intraday results, however, there is reversion for the next three days when we use raw or market-adjusted returns. During the crisis, foreigners no longer buy following positive significant abnormal returns. Further, there is no significant impact on the day of the event. Using market-adjusted returns, there is no reversal following the event.
As with the intraday results, there is a noticeable lack of symmetry between net buy and net sell events. For net sell events, we have the surprising result before the crisis that on net sell days, market-adjusted returns are positive. The positive market-adjusted return is surrounded by days with positive market-adjusted returns. This suggests again that what matters when foreigners sell is that domestic investors are buying. When we look at the crisis period, we find that foreign investors are selling following significant negative market-adjusted returns. There is a negative market-adjusted return on the event day and it is followed by five days without a significant negative market-adjusted return. There is no evidence that large foreign selling is a prelude to falling stock prices. The market-adjusted return on the day that foreign investors sell is smaller than the market-adjusted return on the previous five days.
The intraday and interday evidence using events defined by large price-setting imbalances is similar except for two differences. First, events defined as large net sell price-setting imbalances before the crisis are followed by significant negative market-adjusted returns. Second, the event-day return during the crisis for net sell price setting imbalances is
insignificantly positive. The overall picture is the same when we look at price-setting imbalances or overall imbalances: There is nothing dramatically special about days where foreign investors have large order imbalances in a stock.
7. Conclusion
In this paper, we used a large sample of Korean stocks to explore how foreign investors trade and how they impact stock prices. We find evidence that before the Korean crisis of the last months of 1997 foreign investors engage in positive feedback trading and herd. During the crisis, the evidence of positive feedback trading and herding is much weaker. However, neither positive feedback trading nor herding are necessarily destabilizing. When we investigate the impact of episodes of heavy foreign trading on stock prices during the day or across days, there is no evidence in our study that would make it possible to single out foreign equity investors as playing a destabilizing role on the equity markets. Though policymakers are often concerned about foreign equity investors because they can withdraw their capital from a country rapidly, it is important to remember that equity markets have built-in mechanisms that can make foreign equity investors stay when creditors do not. In efficient markets, asset prices fall to reflect new adverse public information even in the absence of trades. After the new information is incorporated in prices, the incentive to sell is no longer as powerful since one sells at a fair price. With bank loans, however, this mechanism does not work. Loans still have to be paid in full even after adverse information becomes known, so that a creditor wants to take his money out while he can and before the firm goes bankrupt.
References
Bailey, Warren, Kalok Chan, and Y. Peter Chung, 1997, Depository receipts, country funds, and the Peso crash: The intraday evidence, Unpublished paper, Cornell University.
Bekaert, Geert, and Campbell R. Harvey, 1998a, Capital flows and the behavior of emerging market equity returns, Unpublished working paper, Duke University.
Bekaert, Geert, and Campbell R. Harvey, 1998b, Foreign speculators and emerging equity markets, Unpublished working paper, Duke University.
Bohn, Henning, and Linda Tesar, 1996, U.S. equity investment in foreign markets: Portfolio rebalancing or return chasing?, American Economic Review 86, 77-81.
Brennan, M. J., and Cao, H. H., 1997, International portfolio investment flows, Journal of Finance 52, 1851-1880.
Clark, J. and E. Berko, 1996, Foreign investment fluctuations and emerging market stock returns: The case of Mexico, unpublished working paper, Federal Reserve Bank of New York.
DeLong, J. Bradford, Andrei Shleifer, Lawrence H. Summers, and Robert J. Walmann, 1990, Positive feedback investment strategies and destabilizing rational speculators, Journal of Finance 45, 379-395.
Dimson, Elroy, 1979, Risk measurement when shares are subject to infrequent trading, Journal of Financial Economics 7, 197-226.
Dornbush, Rudiger, and Y.C. Park, 1995, Financial integration in a second-best world: Are we still sure about our classical prejudices, in Rudiger Dornbush and Y.C. Park, eds., Financial opening: Policy lessons for Korea, Korea Institute of Finance, Seoul, Korea.
Henry, Peter B., 1997, Stock market liberalization, economic reform, and emerging market equity prices, Unpublished working paper, MIT.
Holthausen, Robert W., Richard W. Leftwich, and David Mayers, 1990, Large-block transactions, the speed of response, and temporary and permanent stock-price effects, Journal of Financial Economics 26, 71-95.
Kang, Jun-Koo, and René M. Stulz, 1997, Why is there a home bias? An analysis of foreign portfolio equity ownership in Japan, Journal of Financial Economics, …
Lakonishok, Josef, Andrei Shleifer, and Robert W. Vishny, 1992, The impact of institutional trading on stock prices, Journal of Financial Economics 32, 23-43.
Radelet, Steven, and Jeffrey Sachs, 1998, The Onset of the East Asian Financial Crisis, Unpublished working paper, Harvard University.
Sias, Richard W., and Laura T. Starks, 1997, Return autocorrelation and institutional investors, Journal of Financial Economics 46, 103-131.
Sias, Richard W., and John R. Nofsiger, 1998, Herding and feedback trading by institutional and individual investors, Unpublished working paper, Washington State University.
Stiglitz, Joseph, 1998, Boats, planes and capital flows, Financial Times, March 25.
Stulz, René M., 1997, International Portfolio Flows and Security Markets, Unpublished working paper, Dice Center for Financial Economics, The Ohio State University.
Tesar, Linda L., and Ingrid M. Werner, 1995, Home bias and high turnover, Journal of International Money and Finance 14, 467-492.
Wermers, R, 1998, Mutual fund herding and the impact on stock prices, Journal of Finance, forthcoming.
Table 1. Foreign ownership, and percentage of daily trade volume and price-setting trade volume for three types of investors at the KSE from Dec. 2, 1996 to Dec. 27, 1997.
The sample consists of 414 common stocks selected from all 762 common stocks listed at the KSE on Nov. 30, 1996. The sample stocks are those that do not hit the foreign investment ceiling of 20% effective on Nov. 30, 1996; and those with different ceilings other than 20% are excluded (e.g., those with foreign direct investment shares or government-operated firms). The sample stocks also have more than 20 days of foreign price-setting trades from Dec. 2, 1996 to Oct. 31, 1997. Table shows averages of the foreign ownership across the 414 stocks by size decile as of Nov. 30, 1996. Also presented are the average percentages of daily trade volume and price-setting trade volume attributed to institutions, individuals, and foreigners from Dec. 2, 1996 to Dec. 27, 1997. A price-setting buy (or sell) trade is defined as a trade where the buy-side (or sell-side) order is received at the exchange later than the sell-side (or buy-side) order.
Firm size Foreign ownership (%) Percentage of daily trade volume (%) Percentage of daily price-setting volume (%) Decile # of stocks Mean Median Stock-days Institution Individual Foreigner Stock-days Institution Individual Foreigner
1 (Smallest) 41 3.16 2.09 12,681 6.41 91.43 1.33 11,403 6.22 92.04 1.10 2 41 4.31 2.77 12,622 8.73 87.92 2.19 12,350 8.01 89.04 2.03 3 42 5.94 3.95 12,788 9.99 86.38 2.75 12,210 9.38 87.43 2.53 4 41 5.37 3.74 12,704 11.27 85.33 2.46 12,234 10.61 86.13 2.35 5 42 4.95 3.50 12,960 12.21 83.39 3.26 12,450 11.70 84.13 3.12 6 41 5.13 3.49 12,711 13.08 82.26 3.49 12,463 12.61 82.87 3.54 7 42 6.08 4.11 12,990 13.49 81.28 3.80 12,764 12.87 82.09 3.80 8 41 8.22 6.23 12,744 17.10 76.74 4.83 12,050 17.15 76.67 5.01 9 42 9.64 8.85 13,087 17.64 73.62 7.34 12,847 17.79 73.91 7.22 10 (Largest) 41 11.89 13.48 12,753 18.60 67.31 12.86 12,711 18.61 67.87 12.44 All (414 stocks) 414 6.47 4.52 128,040 12.87 81.54 4.44 123,482 12.58 82.07 4.37
Table 2. Price-setting order imbalances (×100) and market returns at the KSE from Dec. 2, 1996 to Dec. 27, 1997
The price-setting order imbalance for each of the 414 stocks on day t is computed as daily price-setting buy volume less price-setting sell volume attributed to each type of investors (institutions, individuals, and foreigners), and then normalized by the stock’s average daily price-setting volume over the period from Dec. 2, 1996 to Dec. 27, 1997. The Table shows means of the daily normalized order imbalance (×100) on days of (lagged, current, and lead) market increase and decrease, separately, with the KOSPI index as the market. A t-test for the mean difference is reported in parentheses.
Market returns (1) Institution’s order imbalance (2) Individual’s order imbalance (3) Foreigner’s order imbalance Test of (3)-(1) Test of (3)-(2) Before the Korean Crisis (Dec. 2, 1996 - Sept. 30, 1997)
Rmt-1> 0 (108 days; 43,278 stock-days) -0.559 0.471 0.190 (3.60) (-1.25) < 0 (134 days; 52,970 stock-days) -0.841 -0.359 -0.143 (3.40) (1.08)
T-stat for mean difference (1.12) (3.18) (2.23)
Rmt> 0 (109 days; 43,652 stock-days) -0.162 5.004 0.221 (1.51) (-20.05) < 0 (133 days; 52,596 stock-days) -1.173 -4.127 -0.171 (5.96) (21.19)
T-stat for mean difference (3.84) (34.74) (2.60)
Rmt+1> 0 (109 days; 43,040 stock-days) -0.580 -0.181 0.064 (2.56) (1.10) < 0 (133 days; 53,208 stock-days) -0.823 0.172 -0.039 (4.59) (-1.05)
T-stat for mean difference (0.91) (-1.35) (0.69) During the Korean Crisis (Oct. 1, 1997 - Dec. 27, 1997)
Rmt-1> 0 (29 days; 11,022 stock-days) -7.810 5.561 -2.955 (7.96) (-8.92) < 0 (43 days; 15,846 stock-days) -2.188 -0.381 -1.606 (1.69) (-2.30)
T-stat for mean difference (-10.57) (5.98) (-2.96)
Rmt> 0 (29 days; 10,923 stock-days) -8.005 13.550 -3.130 (8.62) (-19.07) < 0 (43 days; 15,945 stock-days) -2.089 -5.817 -1.494 (1.57) (7.32)
T-stat for mean difference (-10.80) (19.87) (-4.05)
Rmt+1> 0 (30 days; 11,133 stock-days) -6.514 5.651 -2.104 (7.20) (-8.81) < 0 (42 days; 15,735 stock-days) -3.065 -0.487 -2.199 (2.55) (-2.90)
Table 3. Order imbalances (×100) and individual stocks' lagged excess returns over market returns at the KSE from Dec. 2, 1996 to Dec. 27, 1997
The order imbalance for each of the 414 stocks on day t is computed as daily buy volume less sell volume attributed to each type of investors (institutions, individuals, and foreigners), and then normalized by the stock’s average daily volume over the period from Dec. 2, 1996 to Dec. 27, 1997. The Table shows means of the daily normalized order imbalances (×100) for quintile portfolios of stocks formed based on lagged excess returns over market returns (KOSPI index) , P1(lowest) through P5(highest), which are rebalanced daily. The t-statistics of the means are presented in parentheses, and t-tests for the mean difference across different investor types are also reported in parentheses.
Prior-day return portfolios Number of days (1) Institution’s order imbalance (2) Individual’s order imbalance (3) Foreigner’s order imbalance Test of (3)-(1) Test of (3)-(2) Before the Korean crisis (Dec. 2, 1996 - Sept. 30, 1997)
Rit-1-R mt-1 P1 (Lowest) 241 -1.230 (-7.08) 2.167 (10.97) -1.006 (-8.42) (1.06) (-13.75) P2 241 -0.469 (-3.25) 0.628 (3.72) -0.258 (-2.49) (1.19) (-4.47) P3 241 -0.036 (-0.22) 0.009 (0.05) -0.075 (-0.58) (-0.18) (-0.39) P4 241 0.050 (0.29) -0.464 (-2.83) 0.421 (3.12) (1.70) (4.16) P5 (Highest) 241 -0.412 (-1.88) -0.181 (-0.71) 0.394 (2.31) (2.91) (1.88) P5 - P1 0.818 (2.93) -2.348 (-7.29) 1.400 (6.72)
During the Korean crisis (Oct. 1, 1997 - Dec. 27, 1997) Rit-1-R mt-1 P1 (Lowest) 72 -3.796 (-4.06) 5.982 (5.44) -2.587 (-6.25) (1.18) (-7.29) P2 72 -2.388 (-2.48) 4.650 (4.19) -2.644 (-6.49) (-0.24) (-6.17) P3 72 -2.759 (-2.86) 4.570 (4.56) -2.088 (-5.92) (0.65) (-6.27) P4 72 -1.135 (-0.84) 2.858 (2.08) -1.973 (-6.93) (-0.61) (-3.44) P5 (Highest) 72 -2.709 (-3.66) 3.402 (3.83) -1.191 (-2.63) (1.75) (-4.61) P5 - P1 1.087 (0.91) -2.580 (-1.82) 1.396 (2.28)
Table 4. Regressions of order imbalances (×100) on individual stock return residuals, market returns, and FX return residuals at the KSE from Dec. 2, 1996 to Dec. 27, 1997
The order imbalance for each of the 414 stocks on day t is computed as daily buy volume less sell volume attributed to each type of investors (institutions, individuals, and foreigners), and then normalized by the stock’s average daily volume over the period from Dec. 2, 1996 to Dec. 27, 1997. The Table shows regressions of the normalized order imbalances (×100) of each investor type for each stock on the stock's return residuals, market returns (KOSPI index), and Won/USD FX return residuals, where the stock return residuals and FX return residuals are obtained from the following market model regressions similar to Dimson's (1979) adjustment for infrequent trading, separately for two subperiods before and during the Korean crisis period.
Individual stock return residuals: eˆit ==Rit−−(bˆi0 ++bˆi1Rmt−−1++bˆi2Rmt ++bˆi3Rmt++1) where Rit ==ln(Pit/Pit−−1)××100
Won/USD FX return residuals: uˆt ==st −−(cˆ0 ++cˆ1Rmt−−1 ++cˆ2Rmt ++cˆ3Rmt++1) where st ==ln(St/St−−1)××100 and St ==(Won/USD)t
The Table presents cross-sectional means of the estimated parameters across sample stocks. The t-statistics of the means are presented in parentheses, and t-tests for the mean difference in the estimated parameters across different investor types are also reported in parentheses.
Dependent variable: Independent variables Average Number
Normalized order imbalance Constant eˆit−−1 eˆit eˆit++1 Rmt−−1 Rmt Rmt++1 uˆt−−1 uˆt uˆt++1 Adj. R
2
of stocks Before the Korean crisis (Dec. 2, 1996 - Sept. 30, 1997)
(1) Institution's order imbalance -0.431 0.072 -0.324 -0.154 -0.063 -0.252 0.256 0.396 0.300 -0.780 0.021 414 (-3.78) (1.97) (-7.10) (-4.38) (-1.24) (-5.49) (5.33) (1.27) (1.17) (-2.36)
(2) Individual's order imbalance 0.425 -0.269 0.055 0.262 -0.108 0.410 -0.366 -0.508 -0.437 0.523 0.041 414 (2.86) (-6.11) (0.92) (7.32) (-1.75) (7.39) (-6.94) (-1.38) (-1.58) (1.45)
(3) Foreigner's order imbalance -0.076 0.202 0.337 -0.107 0.175 -0.128 0.119 0.225 -0.094 0.068 0.025 414 (-0.66) (6.76) (7.86) (-4.16) (3.16) (-2.65) (2.53) (0.74) (-0.44) (0.31)
T-stat for mean difference: (3)-(1) (2.19) (2.76) (10.56) (1.09) (3.17) (1.86) (-2.05) (-0.39) (-1.18) (2.13) T-stat for mean difference: (3)-(2) (-2.67) (8.85) (3.84) (-8.38) (3.41) (-7.32) (6.87) (1.54) (0.98) (-1.07) T-stat for mean difference: (2)-(1) (4.57) (-5.97) (5.05) (8.29) (-0.57) (9.20) (-8.72) (-1.87) (-1.96) (2.66)
During the Korean crisis (Oct. 1, 1997 - Dec. 27, 1997)
(1) Institution's order imbalance -3.148 0.319 -0.112 -0.161 -0.597 -0.653 -0.048 -0.264 -0.182 -0.093 0.106 413 (-7.65) (3.44) (-0.79) (-1.67) (-8.19) (-8.05) (-0.56) (-3.82) (-1.81) (-1.63)
(2) Individual's order imbalance 5.097 -0.453 -0.111 0.240 0.599 1.055 0.027 0.176 0.026 0.052 0.114 413 (10.55) (-4.97) (-0.80) (2.45) (7.81) (11.45) (0.31) (2.62) (0.25) (0.85)
(3) Foreigner's order imbalance -2.243 0.159 0.238 -0.077 0.044 -0.325 0.022 0.040 0.047 0.044 0.043 413 (-8.45) (2.57) (4.04) (-1.89) (1.10) (-7.35) (0.54) (0.97) (1.12) (0.84)
T-stat for mean difference: (3)-(1) (1.85) (-1.44) (2.27) (0.81) (7.71) (3.54) (0.74) (3.79) (2.10) (1.78) T-stat for mean difference: (3)-(2) (-13.31) (5.56) (2.33) (-2.99) (-6.41) (-13.50) (-0.05) (-1.74) (0.20) (-0.11) T-stat for mean difference: (2)-(1) (12.99) (-5.94) (0.01) (2.92) (11.30) (13.91) (0.61) (4.57) (1.44) (1.74)
Table 5. Trading activity of foreign investors by country at the KSE from Dec. 2, 1996 to Dec. 27, 1997
For each of foreign buy- and sell-trades at the KSE from Dec. 2, 1996 to Dec. 27, 1997, the foreigner's country is identified using the corresponding codes in the IFB/KSE database. The sample stocks include all common stocks traded at the KSE at the end of Nov. 1996. Table shows shares bought and sold (in thousand shares) by foreign investors over the sample period and aggregated across their countries. Their corresponding net investment amount (in million won) valued at every transaction price is reported in the last column.
Foreign investors' Shares bought Shares sold Net bought Net amount
country ('000) (%) ('000) (%) ('000) (mil won)
US 265,100 (37.1) 285,755 (30.4) -20,655 -3,146,216 UK 110,366 (15.4) 193,898 (20.6) -83,532 -421,666 Ireland 67,162 (9.4) 102,026 (10.8) -34,864 -243,028 Germany 1,954 (0.3) 3,063 (0.3) -1,109 39 France 7,304 (1.0) 10,012 (1.1) -2,708 -2,022 Canada 26,552 (3.7) 26,488 (2.8) 64 110,535 Swiss 12,710 (1.8) 26,819 (2.8) -14,109 -98,505 Netherlands 5,495 (0.8) 13,173 (1.4) -7,678 -35,300 Luxembourg 20,225 (2.8) 25,627 (2.7) -5,402 25,357 Australia 9,476 (1.3) 14,507 (1.5) -5,031 -30,735 New Zealand 9,495 (1.3) 13,812 (1.5) -4,317 20,714 Japan 4,001 (0.6) 5,848 (0.6) -1,847 7,188 Malaysia 138,231 (19.3) 177,210 (18.8) -38,979 4,124,147 Taiwan 2,796 (0.4) 844 (0.1) 1,952 56,243 Singapore 4,414 (0.6) 6,784 (0.7) -2,370 -26,161 Hong Kong 2,393 (0.3) 4,744 (0.5) -2,351 7,821 Others (31 countries) 26,951 (3.8) 30,700 (3.3) -3,749 78,008 Total 714,625 (100.0) 941,310 (100.0) -226,685 426,419
Table 6. LSV Herding measures (in percent) for foreign investors by size and past-week return portfolios on the KSE stocks
To compute herding measures for foreign investors, each of foreign buy- and sell-trades on a sample of the 414 stocks at the KSE from Dec. 2, 1996 to Dec. 27, 1997 is attributed to one of the foreign investor classes (658 classes across 47 countries and 14 investor types), using the identification codes in the IFB/KSE database. The herding measure for a given stock-day is then computed as | pit −−E(pit)|−−E|pit−−E(pit)|, where pit is the proportion of foreign investor
classes net buying stock i on day t among all foreign investor classes trading that stock on that day, E(pit) is the expected proportion of foreign investor classes
net buying on that day relative to all foreign investor classes active, and E|pit −−E(pit)| is the adjustment factors computed as under the null of no herding that
the number of net buying classes is binomially distributed. The herding measure computed above for each stock-day is then averaged within size and past-week return portfolios (both in terms of the US dollar), which are rebalanced equally every week. The t-statistics for the means are presented in parentheses, and the number of stock-days are presented below the t-statistics.
Past-week Before Korean Crisis (Dec. 2, 1996-Sept. 30, 1997) During Korean Crisis (Oct. 1, 1997-Dec. 27, 1997) return portfolio S1 (Smallest) S2 S3 S4 S5 (Largest) S1 (Smallest) S2 S3 S4 S5 (Largest) P1 5.891 7.484 8.61 11.209 10.383 1.627 -2.06 -0.011 -0.593 2.616 (Lowest) (21.19) (23.98) (25.37) (29.95) (28.07) (2.46) (-4.4) (-0.02) (-1.06) (3.81) 4,097 4,097 4,097 4,097 3,856 1,225 1,241 1,195 1,241 1,168 P2 9.38 9.403 9.055 10.764 15.785 0.805 1.68 0.548 1.367 4.951 (26.74) (26.83) (26.22) (29.33) (36.98) (1.26) (2.58) (0.89) (2.13) (6.8) 4,097 4,097 4,097 4,097 4,097 1,241 1,241 1,241 1,241 1,241 P3 9.508 9.801 8.823 10.337 15.703 1.108 1.095 0.535 2.15 7.89 (26.18) (26.81) (25.34) (27.36) (36.1) (1.66) (1.65) (0.86) (3.11) (9.28) 3,856 3,856 3,856 3,856 3,856 1,168 1,168 1,168 1,168 1,168 P4 7.857 7.516 6.808 12.123 12.072 1.436 -1.879 0.237 2.547 3.663 (24.52) (23.92) (22.68) (31.48) (31.62) (2.16) (-3.59) (0.39) (3.63) (5.15) 4,097 4,097 4,097 4,097 4,097 1,241 1,241 1,241 1,241 1,241 P5 8.226 7.394 9.047 10.293 20.603 -1.315 -0.375 0.146 0.611 13.689 (Highest) (24.01) (22.92) (26.01) (27.75) (46.86) (-2.36) (-0.63) (0.24) (0.96) (15.53) 3,856 3,856 3,856 3,856 3,856 1,168 1,168 1,168 1,168 1,168
Table 7. LSV Herding measures (in percent) for the US investors by size and past-week return portfolios on the KSE stocks
To compute herding measures for the US investors, each of the US investors' buy- and sell-trades on a sample of the 414 stocks at the KSE from Dec. 2, 1996 to Dec. 27, 1997 is assumed to originate from a separate US investor, using the country identification code in the IFB/KSE database. The herding measure for a given stock-day is then computed as |pit−−E(pit)|−−E|pit −−E(pit)|, where pit is the proportion of the US investors buying stock i on day t among all US
investors trading that stock on that day, E(pit) is the expected proportion of the US investors buying on that day relative to all US investors active, and |
) ( |pit E pit
E −− is the adjustment factors computed as under the null of no herding that the number of purchases is binomially distributed. The herding measure computed above for each stock-day is then averaged within size and past-week return portfolios (both in terms of the US dollar), which are rebalanced equally every week. The t-statistics for the means are presented in parentheses, and the number of stock-days are presented below the t-statistics.
Past-week Before Korean Crisis (Dec. 2, 1996-Sept. 30, 1997) During Korean Crisis (Oct. 1, 1997-Dec. 27, 1997) return portfolio S1 (Smallest) S2 S3 S4 S5 (Largest) S1 (Smallest) S2 S3 S4 S5 (Largest) P1 2.824 3.564 3.391 5.294 6.874 1.252 1.362 1.476 2.89 4.128 (Lowest) (14.91) (15.73) (15.49) (18.17) (19.55) (2.72) (3.01) (3.11) (5.18) (6.56) 4,097 4,097 4,097 4,097 3,856 1,225 1,241 1,195 1,241 1,168 P2 3.35 2.667 3.935 6.272 9.714 0.57 2.473 0.795 1.617 4.991 (15.41) (14.75) (16.31) (19.34) (23.74) (1.41) (4.64) (1.90) (3.38) (7.46) 4,097 4,097 4,097 4,097 4,097 1,241 1,241 1,241 1,241 1,241 P3 3.412 3.199 3.599 3.924 11.254 0.771 -0.315 0.508 2.73 8.035 (15.03) (14.80) (15.34) (15.71) (24.97) (1.75) (-0.98) (1.24) (4.76) (9.76) 3,856 3,856 3,856 3,856 3,856 1,168 1,168 1,168 1,168 1,168 P4 2.27 2.299 2.346 3.759 10.368 1.164 -0.175 3.268 -0.237 5.915 (14.67) (14.51) (14.62) (15.99) (24.59) (2.57) (-0.53) (5.60) (-0.73) (8.23) 4,097 4,097 4,097 4,097 4,097 1,241 1,241 1,241 1,241 1,241 P5 2.841 1.967 3.638 4.943 25.834 0.23 0.252 0.956 0.824 18.1 (Highest) (14.53) (14.23) (15.37) (17.06) (41.21) (0.59) (0.65) (2.19) (1.91) (16.97) 3,856 3,856 3,856 3,856 3,856 1,168 1,168 1,168 1,168 1,168
Table 8. Descriptive statistics of large foreign order imbalances (in shares) in 5-minute intervals
For each of the 414 stocks at the KSE from Dec. 2, 1996 to Dec. 27, 1997, the foreign order imbalance (buy volume less sell volume) within a 5-minute trading interval during continuous auction sessions (excluding Saturdays), is computed in two ways: One is based on all foreign trades and the other based on foreign price-setting trades. Among these, five intervals with the largest order imbalances in terms of net buy, net sell, price-setting net buy, and price-setting net sell are selected for each stock, but excluding those of less than 1,000 shares. The results are presented below for the full sample period, and two subperiods before and during the Korean crisis.
Descriptive Net buy order imbalances Net sell order imbalances statistics Full sample Before crisis During crisis Full sample Before crisis During crisis
Nobs 1,970 1,685 285 2,009 1,444 565 Mean 19,860 20,132 18,255 20,964 16,255 33,000 Maximum 2,000,000 2,000,000 292,760 1,387,500 315,840 1,387,500 Q3 15,100 15,000 17,020 19,790 15,000 30,000 Median 6,180 6,140 6,810 8,160 6,990 12,000 Q1 3,000 3,000 3,890 4,000 3,685 5,000 Minimum 1,000 1,000 1,000 1,000 1,000 1,000
Descriptive Price-setting net buy order imbalances Price-setting net sell order imbalances statistics Full sample Before crisis During crisis Full sample Before crisis During crisis
Nobs 1,826 1,595 231 1,915 1,386 529 Mean 17,849 17,103 22,998 16,602 14,070 23,235 Maximum 2,000,000 2,000,000 463,000 1,387,500 316,400 1,387,500 Q3 13,070 12,250 16,970 14,230 11,140 20,000 Median 5,490 5,330 6,140 5,590 5,000 9,000 Q1 2,700 2,610 3,000 3,000 2,900 3,820 Minimum 1,000 1,000 1,000 1,000 1,000 1,000
Table 9. Intraday returns and volatility (%) around 5-minute intervals of large foreign price-setting order imbalances
The foreign price-setting order imbalance within a 5-minute trading interval during continuous auction sessions for each of the 414 stocks at the KSE from Dec. 2, 1996 to Dec. 27, 1997, excluding Saturdays, is computed as foreign price-setting buy volume less price-setting sell volume. The samples in Panel A and B comprise the five intervals with the largest price-setting net buy and net sell order imbalances , respectively, selected for each stock, but excluding those of less than 1,000 shares. The Mean-adj ret for each interval is the mean of the interval return for the stock exceeding the mean observed on the same day of the week and same time of day over the sample period, and the |Mean-adj ret| is a measure of volatility computed as the mean of absolute values of the mean-adjusted returns. The CAR(-1,5) is the cumulative returns from intervals 0 through 5, and the t-statistics are reported in parentheses.
Panel A. 5-minute returns and volatility (%) around large foreign price-setting net buy order imbalances
5-minute intervals relative to the foreign net buy order imbalance (interval 0)
Mean statistics -5 -4 -3 -2 -1 0 1 2 3 4 5 CAR(-1,5)
Full period (Dec. 2, 1996 to Dec. 27, 1997; N=1,826)
Raw ret 0.059 0.065 0.021 0.072 0.155 0.649 0.109 0.004 -0.005 -0.015 -0.015 0.728
(3.19) (3.42) (1.01) (3.13) (6.22) (17.60) (5.23) (0.15) (-0.21) (-0.62) (-0.66) (14.91)
Mean-adj ret 0.057 0.066 0.024 0.075 0.157 0.648 0.107 0.007 -0.003 -0.014 -0.012 0.733
(3.14) (3.51) (1.15) (3.31) (6.39) (17.75) (5.20) (0.31) (-0.12) (-0.59) (-0.57) (15.18)
|Mean-adj ret| 0.401 0.396 0.427 0.464 0.516 0.959 0.483 0.505 0.449 0.481 0.429
Before the Korean crisis (Dec. 2, 1996 to Sept. 30, 1997; N=1,595)
Raw ret 0.063 0.058 0.048 0.085 0.174 0.574 0.123 0.025 0.005 -0.014 -0.035 0.679
(3.46) (3.34) (2.61) (4.34) (8.05) (17.54) (5.79) (1.09) (0.24) (-0.64) (-1.88) (14.80)
Mean-adj ret 0.062 0.059 0.052 0.088 0.176 0.575 0.122 0.029 0.007 -0.012 -0.033 0.687
(3.39) (3.41) (2.80) (4.52) (8.26) (17.74) (5.79) (1.24) (0.33) (-0.58) (-1.79) (15.14)
|Mean-adj ret| 0.391 0.368 0.390 0.429 0.476 0.876 0.474 0.478 0.434 0.449 0.389
During the Korean crisis (Oct. 1, 1997 to Dec. 27, 1997; N=231)
Raw ret 0.026 0.114 -0.167 -0.021 0.025 1.166 0.012 -0.147 -0.070 -0.022 0.125 1.064
(0.36) (1.26) (-1.60) (-0.17) (0.20) (6.46) (0.16) (-1.55) (-0.87) (-0.18) (1.07) (4.86)
Mean-adj ret 0.026 0.118 -0.167 -0.012 0.027 1.153 0.004 -0.141 -0.067 -0.025 0.129 1.052
(0.37) (1.32) (-1.61) (-0.10) (0.21) (6.46) (0.05) (-1.49) (-0.85) (-0.21) (1.11) (4.85)