A Decade of Oracle Database Manageability
Pete Belknap John Beresniewicz Benoit Dageville Karl Dias Uri Shaft Khaled Yagoub Oracle Corporation
Abstract
Oracle took on the challenge of ever-increasing management complexity for the database server begin-ning some eleven years ago with Oracle 10g and continuing through the 11g release. The Oracle RDBMS offers numerous services and features that share infrastructure and resources to enable a rich portfolio of industry-leading data management capabilities. Oracle Database Server Manageability refers to a cross-organization effort across various RDBMS core teams to deliver a coherent feature suite that en-ables customers to manage an Oracle database with consistency, confidence and relative ease through the Enterprise Manager UI. Our efforts to improve database manageability can be classified into three levels of increasing sophistication:
• Statistics and reporting level– where key workload performance statistics and run-time data are continuously and efficiently collected by default, persisted into a self-managing repository, and exposed through reports and interactive UI
• Advisory level – where instrumentation level performance data are periodically analyzed using a time-based methodology that makes findings and recommendations about sub-optimal performance, its root cause, and opportunities for improvement
• Automated implementation level – where advisory level recommendations that can be implemented with low and well-understood risk are automatically put in place (given prior consent of administrators)
Each layer builds upon the ones below it, and each plays a part in satisfying the key customer use cases – it is only through exposing features at all three levels that the solution becomes complete. In this paper we will discuss our key offerings at each level, review motivating use cases and lessons learned, and conclude by looking forward to some problems that excite us in the near future.
1
Introduction
Manageability has been a major focus area in every Oracle RDBMS release since version 10 (2003)[2], reaching beyond self-tuning to consider other approaches as well. Improving the ease-of-use of the database is an effort that encompasses all development teams. We have focused on the following high-level management problems:
• Ease ofout-of-box configuration: we have shrunk the set of mandatory parameters by establishing sensi-ble default values, removed others when the system can properly self-tune them, and in general improved core RDBMS components to tune themselves.
Copyright 2011 IEEE. Personal use of this material is permitted. However, permission to reprint/republish this material for advertising or promotional purposes or for creating new collective works for resale or redistribution to servers or lists, or to reuse any copyrighted component of this work in other works must be obtained from the IEEE.
• Reducing theconceptual burden on the DBA: for example, we classified the hundreds of Oracle wait events into just twelve wait classes to make it easier for a DBA to understand the nature of bottlenecks inside the server.
• Simplifying the basicmonitoringof an Oracle database: we have introduced innovative mechanisms to track time spent inside the server at finer levels of granularity, in real-time, and with visibility into the past. This has allowed us to create more scientific, measurement-oriented performance tuning workflows.
• Assisting with theanalysis of performance data: Our intelligent advisors productize the performance tuning methodologies that Oracle experts use to find the root cause of performance problems and rec-ommend corrective actions. In some cases these advisors can be configured to take action automatically themselves.
We could not achieve such wide goals by building each solution uniquely or from scratch–we needed a unified architecture. The one we engineered ensures conceptual consistency across the board and provides common data interfaces. It consists of the following three layers added to the RDBMS server:
1. Statistics and reporting level – where key workload performance statistics and run-time data are continu-ously and efficiently collected by default, persisted into a self-managing repository, and exposed through reports and an interactive graphical user interface.
2. Advisory level – where instrumentation level performance data are periodically analyzed using a time-based methodology that makes findings and recommendations about sub-optimal performance, its root cause, and opportunities for improvement.
3. Automated implementation level – where advisory level recommendations that can be implemented with low and well-understood risk are automatically put in place (given prior consent of administrators).
The Oracle manageability stack follows a bottom-up learning paradigm, where facts and knowledge are derived from basic workload and system statistics, advisors analyze those facts and recommend actions to the user, and automatic logic tests and implements a small subset of those findings.
Each layer serves a critical purpose in its own right. While some of us thought at first that automated features and intelligent advisors would eliminate the need for raw statistics, we found each piece to be necessary and the set to be complementary. Sometimes the reasons were situational (e.g., DBAs of mission-critical systems often want to exercise more fine-grained control than those running hundreds of smaller databases) and at other times more practical (e.g., some problems caused by the application, such as a poorly written SQL or user-level locking issues, cannot be automatically solved within the RDBMS). Also, many problems proved significantly easier to solve when we can engage directly with the user in an advisory capacity. The parallel SQL execution finding in the SQL Tuning Advisor [3] illustrates this nicely: while it was relatively simple for us to generate a set of facts and estimates for the user about the benefits of enabling parallel execution for a particular SQL statement (e.g., estimated speedup, increase in resource consumption, etc), implementing the action automatically was not feasible. Without complete workload insight we could not quantify the risk of doing so, and we needed the user’s involvement to evaluate the trade-off between resource consumption and response time. Had we limited our scope to what we could automatically implement, we would have built a far less useful product.
Oracle has also developed a parallel technology stack to make the database self-healing and self-diagnosing with respect to software failures and defects. This infrastructure, which we call the diagnosability framework [7], is beyond the scope of this paper. From the beginning we recognized its distinction from manageability was unclear: for example, a performance problem could be caused by a software bug. To avoid confusion we have focused the manageability initiative on performance monitoring and tuning and diagnosability on product de-fects. We will stay with the former for the remainder of this paper, which will be structured as follows: Sections
2, 3, and 4 go into depth on the statistics, advisory, and automation layers, respectively; Section 5 explains how Enterprise Manager connects them together into packaged workflows; and in Section 6 we conclude and look forward to the future by mentioning some of the bigger challenges that our customers face today.
2
Statistics and Reporting Layer
The foundation of the manageability stack is the statistics and reporting layer. It gathers key workload informa-tion in real-time to expose the most important aspects of database performance to internal components and end users as they require. For many releases Oracle has provided basic monitoring capabilities through a layer of views that expose in-memory performance data. The Oracle 10g manageability framework brought three key innovations for the tracking and capturing of performance data:
• Statistics are computedcontinuously, updated inreal-time, and track thetrendof values over time.
• Historical datais persisted in a built-in and self-managing workload repository (AWR) [5].
• The core mechanisms areenabled by default.
Each one of these represents significant advances, but especially the third one. Collecting comprehensive perfor-mance data is a necessary precondition to building automated higher-level features, and having the instrumen-tation mechanisms on by default makes them always available. More importantly, it forces a requirement onto those mechanisms to be robust across platforms and versions as well as to be extremely lightweight. Automated statistics infrastructure must never itself tax system throughput.
2.1 Statistics Framework
2.1.1 Active Session History
TheActive Session History (ASH)facility exemplifies these characteristics both in the volume and detail of the data it collects by default, and in how this enables sophisticated root cause analysis of a wide array of perfor-mance issues. ASH is a sampled history of session activity collected by a single kernel process into a circular buffer and flushed to disk regularly. ASH samples contain both an instantaneous snapshot of activity (current user, SQL, etc) as well as a set of resource consumption statistics, such as actual I/O or CPU consumption. ASH uses a negligible amount of CPU and memory, is implemented without latching or locking, and has proven to be highly robust. ASH enables the breakdown of database activity along some eighty dimensions, the identification of top SQL statements, database users, wait times and reasons, and much more. This helps one understand where time is spent inside the database, even after performing arbitrary filtering to limit the scope of analysis.
2.1.2 Other Components
• Real-Time SQL Monitoring[8] captures detailed information about individual long-running SQL execu-tions, including key items such as plan operation-level memory consumption, actual run-time cardinality values, and time distribution across parallel server processes.
• TheAutomatic Workload Repository (AWR)captures periodic snapshots of performance data, allowing users to get a complete understanding of what the system was doing at any period in the past. It keeps data for one week by default. Users can choose to keep all data for as long as they wish, or they can assign a retention policy to a specific window of AWR data, enabling comparisons to system baselines.
• TheTime Modelmeasures and computes our core performance metric – Database Time [5] – at the ses-sion and system levels, as well as broken down at finer granularities (e.g., SQL execution, SQL parsing). Time spent in the database is the basis for all Oracle performance analysis.
• Global Wait Chainsexpose a cluster-wide waits-for graph that allows one to find top blockers on the system and understand where they are currently active.
2.2 Active Reports
While we love the flexibility and expressiveness of exposing statistics in database views, we have found the SQL interface too cumbersome for everyday customer use cases. Each of our statistic infrastructure components exposes a reporting API, allowing users to generate reports with the most useful data from each source. We have made many reports highly graphical and interactive through technology we call Active Reports [12]. Active Reports incorporate the same rich, engaging UI technology as Oracle Enterprise Manager while still being available on the Database command-line. They are fully contained in one file and, like standard reports, can be viewed without any mid-tier or database connectivity.
These features are the key players in our statistics layer. While they serve as the basis of features in the advi-sory and automated implementation layers, they are invaluable in their own right when users need to understand the rationale behind the output of the upper layers or when they prefer to drive an investigation themselves.
3
Advisory Layer
Oracle provides a suite of intelligent advisors within the RDBMS and Enterprise Manager that transform the data provided by the Statistics and Reporting Level using a tested tuning methodology into concrete recommendations for the user to review.
The following advisors specialize in throughput analysis and are the most mature of the group:
• ADDM [5] uses ASH and AWR data to perform a holistic analysis of system throughput, computing Database Time – the cumulative amount of time spent within the server working directly on behalf of the user – and analyzing it along multiple dimensions to identify the key performance bottlenecks.
• SQL Tuning Advisor (STA)[3] focuses on a single SQL statement, examining it for many common root causes of poor performance, such as missing or stale statistics and cardinality mis-estimation .
• SQL Access Advisor (SAA)attempts to find new access structures (indexes, materialized views, parti-tioning) to benefit the workload as a whole.
• Segment Advisorworks from a different goal – optimizing the storage layout of an application schema. There is still a strong relationship to performance because of caching benefits and concurrency impact in shrinking or compressing objects.
3.1 ADDM
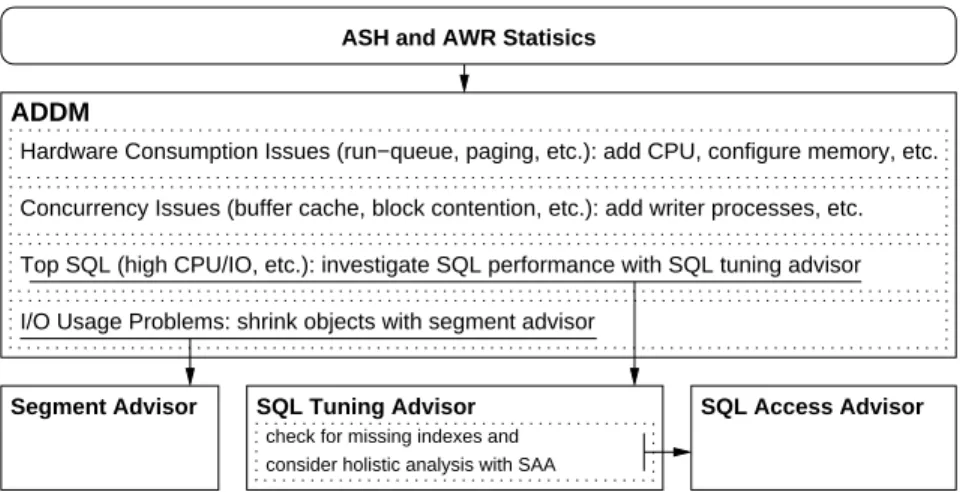
The following diagram shows how ADDM integrates with the other advisors to provide a single starting point for throughput tuning. ADDM builds a useful model from the underlying statistics (ASH and AWR) for con-sumption by a higher-level rule set which outputs useful findings. ADDM builds a comprehensive, hierarchical model of database time that is capable of answering a variety of important questions. For example, it can deter-mine how time is spread across CPU, IO, and Network waits, and then drill down into each of these categories (e.g., to determine whether high Network waits were due to high distributed lock usage or large amounts of parallel query communication). ADDM’s rules engine can then pose these questions and find a possible remedy. Generic, well-defined concepts like the ADDM time model and rule set are what enable an intelligent advisor like ADDM to scale to so many different types of problems.
ADDM
Concurrency Issues (buffer cache, block contention, etc.): add writer processes, etc. Top SQL (high CPU/IO, etc.): investigate SQL performance with SQL tuning advisor I/O Usage Problems: shrink objects with segment advisor
ASH and AWR Statisics
Segment Advisor SQL Tuning Advisor SQL Access Advisor
Hardware Consumption Issues (run−queue, paging, etc.): add CPU, configure memory, etc.
check for missing indexes and consider holistic analysis with SAA
Figure 1: ADDM integration with other database components
3.2 Other Advisors
• Comparative Analysis, namely, comparing workload statistics across two periods of time:
– Compare Period ADDM takes a system-wide perspective, searching for relevant configuration changes and associating them with specific performance impacts. It might identify that a regres-sion in performance, with a symptom of increased I/O time, was caused by a manual reconfiguration of the memory available to the instance.
– SQL Performance Analyzer (SPA)works at the SQL statement level, identifying key improved and regressed statements, and providing a remedy to fix the regressions [10]. When a regression is caused by a plan change, users can create SQL plan baselines to instruct the optimizer to choose the better execution plan [11].
• Real-Time Analysis:Real-Time ADDMviews the most recent five minutes of system activity and iden-tifies the biggest performance problems happening on the system at the moment. It can, for example, recommend killing a process to clear a hang or reconfiguring shared memory to lower contention.
We have learned through experience the importance of providing actionable advice and come to understand the true nature of root-cause analysis as well. We recognize that advice is most useful when it indicates a clear action to the DBA, and that this only happens when it is accompanied by the right bits of additional information. We have found this to be an easy goal to miss when we provide information which we think is useful but ends up being not truly actionable, or we make a good finding without the right data to back it up and convince a user that it will solve his problem. For example, we had to fine-tune ADDM’s memory configuration findings over time as we saw they were not truly useful until we quantified the benefit that they bring and explained the payoff or penalty that comes with each incremental increase or decrease in available memory.
It was always our goal to provide root-cause analysis, but it took time to develop a definition that could be put to practical use – over time we have come to view it as a spectrum, realizing that it may be impossible to reach the ultimate root cause of a problem but that we should seek to get as close as possible. Each step closer is valuable to users when it helps them understand the cause of a problem to a finer level of detail. To take an example from the SQL tuning advisor: while we may never identify the precise mis-estimate that was the cause of a bad execution plan (and why that is), understanding that the problem is related to cardinality estimation in general is useful to a DBA because it helps him narrow down the issue to a particular part of query optimization. These advisors offer broad, intelligent advice and are generally useful in everyday system performance scenarios. In addition to running an advisor to solve a problem and accepting its advice, a DBA might do a
manual run for deeper analysis than the automatic run could perform or use it as a convenient starting point when embarking on a longer manual investigation. In this way, the manual advisors work well alongside the statistics and automated implementation layers while still adding value in their own right.
4
Automated Implementation Layer
Atop our statistics and advisory layers, the automated implementation layer attempts to find actions that are good candidates for automatic action. This is obviously attractive because of its potential to simplify a complex system. We have learned, however, to be conservative in this space – this is also where we take the most risk of harming the system. In this section we describe the Oracle self-tuning solution first at the component level and then at the system level.
4.1 Self-tuning Components
4.1.1 Automatic Memory Management
Automatic memory management [4] has likely seen more adoption than any other component-level self-tuning feature. It allows DBAs to set a single memory target for the entire instance, or two memory targets, one each for shared and private (SQL) memory. Before it was introduced, DBAs had to tune the allocation of each memory pool, such as the buffer pool and sort buffer size. With one or both memory targets in place, the feature divides the memory set into smaller granules which are exchanged between components as they are needed. This eases the configuration burden and at the same time reduces the likelihood of out of memory errors or unnecessary spills to disk. To help users understand the overall memory need of a system, Oracle includes a simulator that determines the optimal size of each memory component. ADDM also exposes this advice as a set of cache tuning findings. In this way ADDM helps the user set the overall sizing, after which the system can effectively allocate memory internally.
4.1.2 Other Components
• TheQuery Optimizerexamines execution-time statistics and feeds significant cardinality mistakes back into the engine to generate a better plan for future executions [9].
• The Parallel Execution engine automatically determines the degree of parallelism (DOP) for a SQL statement based on the statement’s cost [6]. Previously users had to set a DOP manually at the table level.
• The Database Resource Managercaps CPU consumption of automatic system maintenance to ensure that it does not negatively impact application performance.
• Real Application Clustersperforms load balancing across instances of a clustered database and also prevents a single instance from negatively impacting the cluster by terminating instances and misbehaving processes if they lose I/O responsiveness or cause a hang.
4.2 Advisory Automation
The SQL Tuning Advisor runs in an automated mode during nightly maintenance windows to tune SQL state-ments without the DBA’s involvement [1]. While the statistics layer made it easy to find the SQL statestate-ments that consumed the most time over the past week, and the advisor layer already had the tuning algorithms and methodologies we needed for this feature, there were many new challenges unique to automated implementation. Chief amongst these were determining how to allocate our tuning resources, deciding what recommendations are good candidates for auto-implementation, and providing additional safeguards as necessary to ensure that the tuning itself will not harm the database system. These are more general than SQL tuning: each one would arise in automating any intelligent advisor and would make sense in another context with similar characteristics.
Obviously the most important decision to get right was which recommendations to implement, and why. To follow a conservative approach, we decided that for a recommendation to make sense for automated implemen-tation, we must be able to test it effectively. This limited us to the SQL plan tuning recommendations, since testing was fairly straightforward – execute the SQL with both versions of the plan and choose the better one. Even so, we found plenty of complexity: we had to decide what exactly we mean by “better”, what to do about parallel queries, how to execute DML without impacting the system, and consider many other issues.
4.3 Challenges and Experience
Automated implementation has turned out to be very challenging when it comes to providing the essential guarantees, and we have realized that it makes more sense in some areas than others. We have found it useful to evaluate the promise of each potential action according to three variables: scope – the ability to target only the performance problem, testability – how effectively we can test an action before taking it, and flexibility – how quickly the system can change a decision after making it. Automatic memory management and SQL plan tuning perform well under this test, as the former is highly flexible and the second testable and limited in scope.
Comparing to the feature set of the lower two layers, this level is relatively sparse. The automated im-plementation functionality provides an invaluable service to DBAs in terms of fixing small nagging problems before they become big enough to demand someone’s attention, but we know we will never reach a time when performance problems cease to exist. A robust statistics and advisory layer will always be critically important.
5
Building a Complete Solution
Were our manageability offering limited to one RDBMS feature, then we would have missed a critical need for a holistic management product to tie all of the various components together into one coherent story. Oracle Enterprise Manager (EM) fills the gap and is for us the primary database management interface. Through EM we accomplish two important goals: first, by using end-to-end workflows in EM, DBAs need not memorize a logical sequence of feature transitions in order to complete a single goal. Instead they can interact with the system in a more natural way, one task at a time. And second, by building interactive user interfaces, we have created ways for DBAs to engage directly with the system to access the richness of our on-by-default collections simply and in real time.
Our database throughput tuning workflow is a prime example. The entry point for performance monitoring in EM is the database performance page. From here, users can view key throughput metrics on their system like CPU load, database activity, and I/O metrics, even comparing to a baseline that represents normal performance. Should the activity look significant, the user can drill down to ADDM findings, where she might see a list of top SQL statements running on the system that are candidates for tuning. She can then run the SQL Tuning Advisor directly and implement a recommendation of her choosing, such as gathering statistics or choosing a new plan. On another attempt, she might see that the SQL Tuning advisor automatically identified and fixed the problem itself. Workflows like this one join all three levels of our stack, and transparently: users need not understand where one feature ends and the next begins, but can rather drive a logical progression through a simple methodology. This greatly lessens the learning curve and creates a seamless user experience.
6
Remaining Challenges
The last eleven years have been a great adventure in database manageability for us. We have heard our customers request a wide spectrum of features. In various contexts, they have looked for active management through manual statistics analysis, passive management through intelligent advisors, and independent self-management
through full automation. Our solution contains key offerings in each category, and it is only after covering them all and connecting them with a compelling graphical user interface that it feels complete.
Looking forward to our future can be as simple as finding the things our customers are doing today which require a number of labor-intensive manual steps. On the other hand, it can be as hard as trying to guess at what they will be doing next. Fortunately, by doing the former we find many fascinating problems to occupy us:
• The trend towardsCloudor centralized computing clusters increases the need for cross-database manage-ment functionality.
• Consolidating Databases, whether by merging multiple databases into one, or putting several databases on one host, must be driven from an analysis of the right performance metrics.
• Many basic monitoring, advisory, and automationchallenges are yet to be addressed. For example, tuning for access structures is still a manual process.
We look forward to seeing where our customers will take us next.
Acknowledgements
The authors would like to thank our colleagues at Oracle for their valuable contributions over the past eleven years. In addition, we would like to specially thank Manivasakan Sabesan for helping us with LATEX.
References
[1] P. Belknap, B. Dageville, K. Dias, and K. Yagoub, Self-Tuning for SQL Performance in Oracle Database 11g, in
SMDB ICDE ’09, 2009.
[2] B. Dageville and K. Dias, Oracle’s Self-Tuning Architecture and Solutions, in IEEE Data Engineering Bulletin, vol. 29, 2006.
[3] B. Dageville, D. Das, K. Dias, K. Yagoub, M. Zait, and M. Ziauddin, Automatic SQL Tuning in Oracle10g, inVLDB ’04, 2004.
[4] B. Dageville and M. Zait, SQL Memory Management in Oracle9i, inVLDB ’02, 2002.
[5] K. Dias, M. Ramacher, U. Shaft, V. Venkataramani, and G. Wood, Automatic Performance Diagnosis and Tuning in Oracle, inCIDR ’05,2005.
[6] J. Dijcks, H. Baer, and M. Colgan, Oracle Database Parallel Execution Fundamentals,
http://www.oracle.com/technetwork/database/focus-areas/bi-datawarehousing/twp-parallel-executionfundamentals-133639.pdf
[7] M. Fallen and Y. Sarig, Automatic Fault Diagnostics, http://www.oracle.com/technetwork/database/focus-areas/manageability/diagnosability-white-paper-ow07-131084.pdf
[8] S. Koltakov, B. Dageville, and P. Belknap, Real-Time SQL Monitoring, http://www.oracle.com/ technetwork/database/focus-areas/manageability/owp-sql-monitoring-128746.pdf
[9] A. Lee, M. Zait, Closing the Query Processing Loop in Oracle 11g, inVLDB ’08, 2008.
[10] K. Yagoub, P. Belknap, B. Dageville, K. Dias, S. Joshi, and H. Yu, Oracles SQL Performance Analyzer, inIEEE Data Engineering Bulletin, vol. 31,2008.
[11] M. Ziauddin, D. Das, H. Su, Y. Zhu, K. Yagoub, Optimizer Plan Change Management: Improved Stability and Performance in Oracle 11gg, inVLDB ’08, 2008.
[12] Real-Time SQL Monitoring Active ReportsAn optimal on-line algorithm for metrical task system,