Technical Report TUBS-CG-2001-04
Adaptive Visualization of Distributed 3D Documents
Using Image Streaming Techniques
Jobst Löffler1, Dieter W. Fellner
{d.fellner}@tu-bs.de
Institute of Computer Graphics University of Technology
Mühlenpfordtstr. 23, D-38106 Braunschweig
http://graphics.tu-bs.de
c
Computer Graphics, TU Braunschweig, 2001
Adaptive Visualization of Distributed 3D
Documents Using Image Streaming Techniques
Jobst Loer1and Dieter W. Fellner2
1 Fraunhofer Institute for Media Communication, Schloss Birlinghoven,
D-53754 Sankt Augustin, Germany
2 Institute of Computer Graphics, Technical University of Braunschweig,
Rebenring 18, D-38106 Braunschweig, Germany
Abstract. With the emergence of open information spaces, e.g. digital
libraries, advanced techniques for interactive visualization of complex and protected 3D documents are needed. This paper presents a new vi-sualization concept which deals with the problems of complexity and security of digital 3D documents in open information spaces. A dynamic combination of remote and local 3D rendering is used to allow scaling of the information quantity on client side. The software architecture SCA3D (3D Scalable Scenes Architecture) is presented which provides function-ality for adaptive visualization and protection of intellectual property rights.
1 Motivation: Open Information Spaces
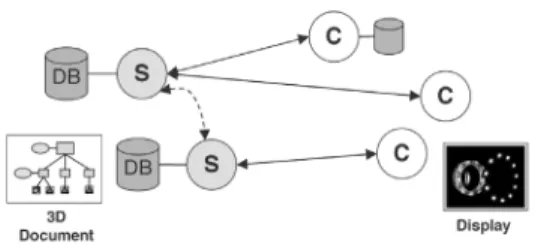
Distributed work involving 3DFig.1.
3D Visualization in open information spaces.scenes as part of multimedia doc-uments within networked informa-tion systems needs technical sup-port for retrieval, interactive visu-alization and communication. A net-worked information system is called an open information space, if ac-cess to documents and services is not restricted to a predetermined area, i.e. to groups of previously
known users and information servers. Homogeneous conditions for work with digital objects and interfaces to other information spaces are characteristics of an open information space which comprises several information servers, docu-ment databases, multiple clients and telecommunication networks between them. Figure 1 shows an open information space built up of two information servers (S) with document databases (DB), a number of users (C), who can also use additional local databases, and an interface between the information servers.
Documents of a digital library used by a group of students and a tutor work-ing on a research project which involves 3D models (e.g. an architectural con-struction project) is a practical example. A digital library allows users to explore already existing 3D documents, generate and add new documents as a result of project work and discuss results. A digital library system should also provide the possibility for visual cut-and-paste, indexing and extending 3D documents. Protection of the original document and management of document copies are important issues which need to be considered during the system development. In order to exploit the full potential of the open information space, both work at the central facility on a LAN using specialized equipment and work at home using standard PCs and low-bandwidth connection should be equally possible. In this paper a visualization architecture is introduced which deals with these issues of complexity and security by using a combined approach of remote and local 3D rendering and an object-oriented document model for 3D scenes. A document-request-broker approach is presented which allows access to objects of distributed 3D documents via proxy objects with a varying level-of-information called object representations.
The remainder of the paper is organized as follows. In section 2 background information is discussed. In section 3 the software architecture SCA3D is pre-sented, while in section 4 its adaptive behavior is evaluated. Finally, in section 5 conclusions are drawn.
2 Visualization of 3D Documents using Hybrid 2D/3D
Scenes on Client Side
Considering 3D scenes
Fig.2.
Generic digital document and 3D document. as ordinary documentsem-phasizes that 3D scenes can be handled in the same way and provide similar features, e.g. cut-and-paste, support of retrieval, in-dexing or extensibility, and are subject to the same constraints, e.g. security or complexity, as
gener-alized digital documents in distributed information spaces (see also [6]). 3D scenes can be seen as digital documents because they both have a common com-position, which comprises a structure plus the actual content (see also [10]). In Figure 2 the assembly of a generic digital document and a 3D document with path information is shown. 3D documents include structure information, which can be mapped onto an internal document model commonly known as the scene graph, and contain geometric objects as content, which are represented as shape nodes in the scene graph. Today's rendering systems, like OpenInventor [14] and Java3D, are using this scene graph concept to enable interactive visualization.
The scene graph concept corresponds to an object-oriented document model, as described for example by the W3C DOM (Document Object Model) [2]. This model denes a document and its components in an object-oriented way: objects are distinguishable, they are arranged following a certain hierarchy (scene graph structure), object data and behavior are encapsulated and only accessible via a well-dened interface. Using the OpenInventor scene graph model, interactive visualization of 3D scenes is performed by applying actions, such as render or pick, to the scene graph and thereby changing the state of the objects. Applying a render action generates image data showing the results of a lighting simula-tion. Other methods of the object interface are used to construct a 3D scene by generating new objects, copying object data or removing objects from the scene graph. Object manipulation can be done using methods which change the internal state of the object, e.g. by calling the method setValue(oat r) of the radius eld of a sphere etc. Meta-data like node names or information concerning security issues, e.g. access rights or copyright data, can be integrated into a 3D document by lling the data elds of attribute nodes.
2.1 Combining Remote and Local 3D Visualization
Visualization of distributed 3D documents can be done by copying the data to the client's computer and using a local rendering pipeline or alternatively by ren-dering the data on a server machine and distributing the rendered image data. Local 3D visualization, where the entire visualization pipeline is performed on the same machine, takes advantage of the hardware acceleration for geometry processing and display. On the other hand in open information spaces there are important reasons not to distribute all geometry information without control, because security, bandwidth and performance requirements must be taken into account. Examples for local 3D visualization with data replication are presented in [1], [5] and [8]. Many of these systems are used to support cooperation with distributed 3D visualization. Alternatively, remote 3D visualization as a service can be used to let users interactively visualize 3D scenes. On the client side of a network connection a visualization application reads the images transmitted from the server and displays them using an interactive image viewer. A user interacts with a 3D scene by sending back the performed actions over a reli-able connection to the server where they are applied. The advantages of such a system are that it can deal with complexity and security requirements because the original data can remain on the server. But remote visualization also brings some disadvantages: the image generation on server side and the transmission of images with high resolution cause a delay in the interaction loop which can disturb the interactive impression. The approach of remote 3D visualization and control of distributed 3D worlds over image streams is discussed e.g. in [7], [3] and [9]. This work indicates that interactive frame rates for remote visualization are hard to reach with today's systems.
A solution that combines the advantages of both approaches and minimizes the disadvantages would combine remote and local 3D visualization and synchro-nize both processes in a uniting software architecture. The number of references that discuss a combination of remote and local 3D visualization is still small.
An approach which combines remote and local 3D visualization is presented in [4]. The paper presents a concept and system for distributed 3D visualization of volume data for medical applications. A solution to minimize the delay in re-motely controlled 3D environments by selective pixel transmission and mapping onto a basis of local geometry is presented in [11].
2.2 Object Representations with Varying Level-of-Information
To describe
geometry-Fig.3.
Object with increasing level-of-information. based content commonlyone of the following ways is used: either as an exact representation like parametrical curves and surfaces, or as polygo-nal 3D meshes e.g. as
triangle meshes. But working with distributed and complex 3D scenes does not imply that a user needs or wants the full geometric information of 3D objects from the beginning.
Rather a client who
Fig.4.
Object representations forming a client scene un-der dierent conditions.just wants to get an over-view of a virtual world or navigate in it, can work with representations that have a low level of com-plexity, e.g. like images or texture plus bounding box information. Only on re-quest for high-level local interaction with objects a full 3D representation needs to be transmitted as 3D mesh or paramet-ric model. Figure 3 illus-trates the idea of represen-ting 3D objects with
in-creasing level-of-information. The Level-of-Information approach presented here is based on the dynamic control of the distribution process of the object repre-sentations which best t the connection and local performance conditions of a client. The following object representations for 3D objects are supported by the SCA3D architecture: parametric models, polygonal mesh models with adaptable resolution, bounding box plus texture, texture plus 2D shape and plane texture.
In Figure 4 the object representations are plotted into a Bandwidth-vs.-Performance-diagram to illustrate how the conguration of a client scene can be adjusted to the connection bandwidth and the local CPU-Power of a client. Four dierent scenarios are classied with regard to bandwidth and power of a client:
(A)
a personal computer in a local area network (PC in a LAN),(B)
a notebook computer with ISDN connection,(C)
a personal digital assistant connected to a LAN (PDA in a LAN) and(D)
a personal digital assistant with mobile connec-tion (PDA mobile). In case(A)
representing a client with high bandwidth and very good CPU-Power all object representations can be used to build a client scene. For instance, such a client can use remote rendering in connection with high resolution images for navigation in a document collection, for negotiation of the needed rights to get the original data and then download all objects as full resolution geometry. A client who is represented by case(D)
cannot download large amounts of geometry data over a small bandwidth connection and would not be able to process the geometry data locally. To work with a 3D document, for such a client object representations like low resolution images and bounding boxes would be a good choice. In case(B)
and(C)
other representations e.g. meshes with varying resolution are suitable for the described conditions.3 A Distributed Software Architecture for Adaptive 3D
Visualization
The Scalable ScenesFig.5.
The combined concept of Scalable Scenes. concept combinesre-mote and local 3D vi-sualization to maximize the advantages and min-imize the disadvantages of the two approaches. Integrating both ap-proaches into a com-mon concept allows the realization of a system that enables interac-tive frame rates on client side for local objects and security and com-plexity management for
remote objects. Synchronization of the visualization pipeline on server side with the client's visualization pipeline allows the user to navigate in remote 3D docu-ments and to interact with objects of the same document located as copies on his computer. The concept distinguishes a remote navigation space on server side and a local interaction space on client side. A level-of-information slider provided by the client application controls which object representations can be transmit-ted to a client on a selection event. The positions of the LoI-slider range between 2D image objects and 3D original objects. Certain positions can be locked to prevent a user from transmitting protected objects. Locking is indicated by a hatched area of the slider of client 1 in Figure 5 which shows the concept of Scalable Scenes in an overview. Three states of an object are distinguished. An inactive server-side object is only present in the navigation space and can
there-fore be visualized remotely. An object which is selected by a user is in the state of an active object. An active object is present in the navigation space and rep-resented on client side by a suitable object representation which is connected to the server-side object via an interface object. The interface object provides a method interface to the user which is accessible over the local object repre-sentation. Finally, an object can be in the state of an inactive client-side object indicating that this object was transmitted as original from server to client.
The SCA3D architecture is built to support multi-client collaboration. Every client who has a connection to the SCA3D server is provided with a unique ID and registered, so that its remotely callable methods can be addressed individu-ally. The collaboration model of SCA3D uses the unique client IDs to maintain individual object references for every client. A multi-client image server is used to distribute image streams over socket connection to any number of clients. The software architecture comprises four layers: a WWW layer, a visualization layer using the OpenInventor API, a document control layer using a CORBA implementation, and nally, an image layer used for image coding, transmission and decoding. The document control layer and the image layer are discussed in more detail in the following sections.
3.1 A Document-Request-Broker Approach
Access to
doc-Fig.6.
Access to documents using proxy objects. ument objects in thedistributed system is managed using a technique which is similar to an object-oriented middleware concept based on remote-procedure-calls (RPC) [13]. Gen-erally, the standard architecture CORBA
is used to develop distributed applications where methods of remote objects are accessed via local proxy objects. On server side method implementations pro-vided by so called skeleton objects are used to apply the RPC. A similar ap-proach, which we term document-request-broker (DRB), is integrated into the Scalable Scenes concept. The document request broker uses interface objects on server side and local object representations on client side to support visual access to remote 3D documents. The object-oriented document model of a scene graph supports this approach very well. The DRB-concept is shown in Figure 6.
The document itself is equivalent to the group G0 of the document-request-broker. It is represented on client side by the object representation OR0, which is the remotely rendered image of the 3D scene. The original document and the client's object representation are connected by an interface object IO0. The client can now apply actions on the document by invoking methods provided by the object representation, e.g. pickObject or getCopyrightInformation. The method
invocations are then applied by the document-request-broker to the original doc-ument using the interface object's methods. In next steps further objects can be activated and interface objects together with objects representations for sub-groups of the document are generated and connected. All object representations mentioned above can be used to work with server-side document objects and therefore the information quantity can be scaled dynamically. To this end the eld value of a complexity node in the activated object group on server side is controlled by the position of the client-side level-of-information slider.
3.2 Organization of the Image Streaming Layer
Images are
dis-Fig.7.
The SCA3D image layer for multi-client support. tributed in thesoft-ware architecture to support object rep-resentations which use remotely ren-dered images. The basic conguration of the client scene requires that an im-age representation of the whole 3D doc-ument is generated
on server side with a certain server frame rate (
SFR
), transmitted to the client and mapped onto the clients projection plane with a certain texture mapping rate (TMR
). To adjust the rate of an image stream to a client's condition a mechanism for rate control is implemented in the image layer. The rate con-trol technique applied is also used in image streaming environments to prevent network congestion (see [12]). The SCA3D image layer uses server-side image buering with a feedback from receiver and sender to control the lling rate of the image ring buer. The rate with which the ring buer is lled depends on the ratio of the xed server frame rate and the individual texture mapping rate of each client. An image servant thread on server side reads the image data out of the ring buer and writes them to a connected image client thread over a socket connection provided by an image multi server before. On client side the images are mapped onto the projection plane with the adjusted texture mapping rate. The setup of the image layer with its Java classes is shown in Figure 7.To nd the appropriate ratio of server frame rate and texture mapping rate for each client, a performance measurement step must be performed. For this purpose the local frame rate (
LFR
) and remote frame rate (RFR
) are measured and their dependency is evaluated. In Figure 7 the characteristic LFR-vs.-RFR-diagram for both clients connected to the server is shown on the right side. To produce the dependency curve the remote image frame rate was stepwise increased from a minimum value to a maximum value by changing server frame rate and texture mapping rate accordingly.4 Adaptive Behavior by Control of Frame Rates and
Local Geometry Load
The software architecture SCA3D implements an adaptive behavior with regard to local and remote frame rates. When a client connects to a server, the optimal ratio between local and remote frame rates will be adjusted in order to minimize the delays for local and remote actions using a performance evaluation process which is performed at xed intervals. The remote frame rate is inuenced by three factors: the delay caused by image generation, by data transmission over the network and by texture mapping on client side (see Equation 1(left)). The reciprocal value of the overall delay is used here as approximation of the RFR value. The local frame rate is estimated as reciprocal value of the local delay of an action (see Equation 1(right)). It depends mainly on the amount of geometry information to be rendered, on the adjusted texture mapping rate and on the resolution of texture images.
R FR~=
1
Tgen+Tnet+Tmap
, LFR~= 1 Tlocal
(1) In order to support work on a distributed 3D document it is necessary to nd the optimal ratio between local and remote frame rates. An optimal ratio of local and remote frame rates enables uent local work on 3D objects and a remote visual feedback with a small delay reecting the state of the server-side document.
In the right
Fig.8.
Estimation of the optimal ratio: (a) LFR vs. RFR (left), (b) slope of LFR-vs.-RFR-curve for varying geometry (right). above corner ofdiagram 8(a) this is demonstrated by showing a 3D object that is moved locally to-gether with the remote visual feedback reect-ing the state of the original docu-ment. The dier-ence of local and
remote delay results in an impression as if the remote object is connected to the local object representation with an elastic band.
Diagram 8(a) shows the experimental results of a performance test for one client as an LFR-vs.-RFR-curve with the optimal ratioPopt. This point is
esti-mated by evaluating the slope of the curve. The characteristic curve of a client application, which is busy with texture mapping and with local rendering, shows a point of maximum slope indicating the optimal ratio of local and remote frame
rates. This point is used to adjust the local texture mapping rate and the server-side push rate of the image ring buer. Diagram 8(b) shows the changing slopes as result of performance evaluation of the same client for a varying geometry load. The client's behavior is changing under varying conditions and perfor-mance evaluation must be repeated from time to time.
To minimize the
over-Fig.9.
Performance comparison of two clients. all delay the optimalra-tio of local and remote frame rates of every client has to be adjusted indi-vidually using the rate con-trol mechanism described above. The server frame rate, which is proportional to the maximum texture mapping rate demanded in the environment, and the texture mapping rate of a client are used to con-trol the push rate of the image buer. The delay factor for lling the
im-age buer is estimated as reciprocal value of the ratio !i = SFR =TMRi
be-tween server frame rate and individual texture mapping rate. By multiplying the server frame rate with the delay factor image streams at optimal frame rate can be delivered to every client.
In order to compare clients a performance metric is needed which reects the dierences in CPU-power and bandwidth connection. The metric is used to control the level-of-information slider and to provide a client with objects repre-sentations best tting the individual local conditions. In Figure 9 the comparison of two clients is shown with help of the LFR-vs.-RFR-diagram. The performance of client 1 is better than that of client 2 which is expressed by the dierence of the lengthLof the vector from the origin toPopt. The evaluation of the vector
length of both clients asL = p
LFR 2+
R FR
2 shows that the performance of
client 1 is approximately ve times the performance of client 2. Both clients were connected to the server over a LAN (10 Mbit/s). Client 1 was a personal computer with a powerful processor (L
1 = 5
:2) whereas client 2 was an older
workstation with less CPU-power (L 2= 1
:1).
To show how this metric reects the performance changes under varying conditions of a client, the geometry load was increased for client 1 and the result are presented in Figure 9. The remote frame rate remained nearly the same under the new conditions whereas the local frame rate was decreased indirectly proportional to the number of triangles in the client scene. The performance value changed fromL
1= 5 :2 to ~L
1= 3
:4 as a response to a change of the triangle
clients changed from L = 4:1 to L = 2:3. Using this performance metric
clients represented by the classication scheme shown in Figure 4 can now work together on a 3D document because the system adjusts the level-of-information on client side.
5 Conclusions
The starting point of this paper was distributed work on 3D documents in open information spaces. The software architecture SCA3D presented here is a solu-tion for interactive visualizasolu-tion of distributed 3D documents with integrated techniques for complexity and security management. The basic concept of the architecture combines local with remote 3D rendering and uses hybrid 2D/3D client scenes. An object-oriented document model together with a document-request-broker approach for remote-document-calls is integrated into the con-cept to enable scaling of the information quantity on client side. The adaptive behavior of the architecture was described by introducing a technique for rate control known from image streaming systems and a performance metric which allows a comparison of clients working together on a 3D document.
References
1. Carlsson, C., Hagsand, O.DIVE- A Platform for Multi-User Virtual Environments, Computer & Graphics, Vol.7(6): 663-669, 1993
2. DOM (W3C)Document Object Model (DOM) Core Specication, W3C, 2000 3. Engel, K., Sommer, O. and Ertl, T. A Framework for Interactive Hardware
Accel-erated Remote 3D-Visualization, EG/IEEE VisSym '00 , pp. 167-177, 2000 4. Engel, K., Hastreiter, P., Tomandl, B., Eberhardt, K. and Ertl, T.Combining Local
and Remote Visualization Techniques for Interactive Volume Rendering in Medical Applications, IEEE Visualization '00 , pp.6-10, 2000
5. Fellner, D.W., Hopp, A.MRT-VR Multi-User Virtual Environment, AAA'97, 1997 6. Fellner, D.W., Havemann, S., Muller, G.Modeling of and Navigation in complex 3D
Documents, Computer & Graphics, Vol.22(6), pp. 647-653, 1998
7. Haulsen, I., Jung, T., Tuchtenhagen, D Remote Control of Virtual Environments Using Image Streams, Second IMA Conference on Image Processing, 1998
8. Hesina, G. et al.Distributed Open Inventor: A Practical Approach to Distributed 3D Graphics, ACM Virtual Reality Software & Technology '99, pp. 74-81, 1999. 9. Loer, J. Object-based Image Coding for Cooperative 3D Visualization,
Interna-tional Conference on Computer Graphics WSCG 2000, pp. 197-203, 2000.
10. Loer, J.Content-based Retrieval of 3D Models in Distributed Web Databases by Visual Shape Information, IEEE Information Visualization IV 2000, pp. 82-87, 2000. 11. Mann, Y., Cohen-Or, D. Selective Pixel Transmission for Navigating in Remote
Virtual Environments, Eurographics Conference EG 97, Vol.16, No. 3, 1997 12. Riley, M., Richardson, I. Digital video communications Artech House , ISBN
0-89006-890-9, 1997
13. Siegel, J.CORBA: fundamentals and programming, New York, N.Y. (u.a.) : Wiley, 1996. - XXVI, ISBN 0-471-12148-7, 1996
14. Wernecke, J. The Inventor Mentor - Programming Object-Oriented 3D Graphics with Open Inventor, Addisson Wesley, ISBN 0-201-62495-8, 1998