2020 ANNUAL REGIONAL
PARK & RIDE
SYSTEM REPORT
JANUARY 2021
Prepared for:
Metropolitan Council
Metro Transit
Minnesota Valley Transit Authority
SouthWest Transit
Maple Grove Transit
Plymouth Metrolink
Northstar Link
Minnesota Department of Transportation
Prepared by:
Arman Rajaeian
Table of Contents
Overview ...3
Capacity Changes...6
About the System Survey ...8
Appendix A: Facility Utilization Data ...9
Park & Ride System Data ...9
Overview
The 2020 Annual Regional Park & Ride System Report provides a summary of current trends in the Twin
Cities regional park-and-ride system. This document is a system performance update that complements
other Metropolitan Council long-term planning documents, including the 2040 Transportation Policy
Plan and Thrive MSP 2040. A survey of the system was conducted in September and October 2020,
which included a simple parked vehicle count and excluded license plate data collection and bicycle
parking count.
Since early 2020, the COVID-19 pandemic has significantly impacted commuter travel demand, resulting
in a major decline in transit ridership, particularly for commuter express service. As a result, commuter
express service was reduced or suspended at many Park & Rides during the time of the 2020 survey.
To simplify this year’s survey given the pandemic, facilities where commuter express service had been
suspended at the time of the survey were excluded. As a result, the survey included 66
park-and-ride facilities with a capacity of 25,541 parking spaces and excluded 36 facilities with a capacity of
7,680 parking spaces where commuter express service was suspended, and park-and-ride use was not
anticipated.
In addition to park-and-ride facilities, there were 31 active park-and-pool facilities (provided by the
Minnesota Department of Transportation). Park-and-ride facilities are defined as parking facilities
that are served by transit (i.e. they have a bus route or rail line serving them), whereas park-and-pool
facilities are designated parking areas that provide individuals a gathering point from which they can
carpool to a common destination. Both types of facilities have been surveyed by regional and state
transportation agencies since 1999. This report focuses primarily on park-and-ride facilities.
Six transit providers operate the region’s park-and-ride facilities and associated transit service:
Minnesota Valley Transit Authority (MVTA), Maple Grove Transit, Metro Transit, Northstar Link,
Plymouth Metrolink and SouthWest Transit. The region’s park-and-pools are provided by the Minnesota
Department of Transportation (MnDOT) and Wisconsin Department of Transportation (WisDOT).
WisDOT however did not participate in this year’s survey. The annual system survey is a collaborative
effort conducted by the region’s providers.
The 2020 survey counted 800 regional park-and-ride users, a decrease of 95.7% from 18,653 users
in 2019. The utilization rate is 3.13%. While there had been relatively stable usage in the preceding
decade, the COVID-19 pandemic and its impacts to commuting have resulted in the most significant
drop of park-and-ride customer usage since data regarding the system has been collected. All regional
transit providers surveyed saw a decrease of approximately 95% to their facility usage. Capacity and
usage changes by service provider may be found in Table 1.
Figure 1: Regional Park & Ride System Usage 2004-2020
Table 1: 2019-2020 System Capacity and Usage by Provider Provider of Facilities Number
Counted 2019 Usage 2020 Capacity 2020 Usage 2020 % Usage 2019-2020 Change 2019-2020 % Change Metro Transit 47 11,757 16,404 468 2.9% -11,289 -96.0% Bus 38 8,611 10,802 267 2.5% -8,344 -96.9% Rail 9 3,146 5,602 201 3.6% -2,945 -93.6% Northstar 6 1,501 3,033 83 2.7% -1,418 -94.5%
Metro Blue Line 3 1,645 2,569 118 4.6% -1,527 -92.8%
MVTA 8 3,343 4,959 131 2.6% -3,212 -96.1%
SouthWest 4 1,468 2,510 54 2.2% -1,414 -96.3%
Maple Grove 1 1,609 924 116 12.6% -1,493 -92.8%
Plymouth 4 434 578 13 2.2% -421 -97.0%
Northstar Link 2 42 166 18 10.8% -24 -57.1%
Park & Ride Total 66 18,653 25,541 800 3.1% -17,853 -95.7%
MnDot Park-and-Pool Total 31 349 1,616 240 14.9% -109 -31.2% 12,072 14,458 15,205 16,876 17,949 16,849 17,363 18,341 18,104 19,149 18,265 19,340 18,715 19,610 18,442 18,653 800 0 5,000 10,000 15,000 20,000 25,000 30,000 35,000 40,000 2004 2005 2006 2007 2008 2009 2010 2011 2012 2013 2014 2015 2016 2017 2018 2019 2020
Observed Parking Use Available Capacity Capacity Not Surveyed in 2020
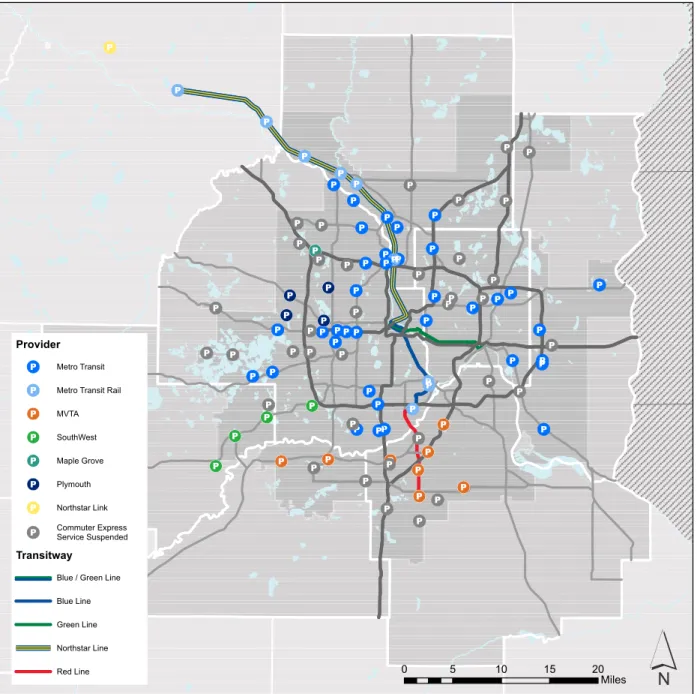
Figure 2: 2020 Regional Park & Ride System by Provider
!
!
!
!
!
!
!
!
!
!
!!
!
!
!
!
!
!
!
!
!
!
!
!
!
!
!
!
!
!
!
!
!
!
!
!
!
!
!
!
!
!
!
!
!
!
!
!
!
!
!
!
!
!
!
!
!
!
!
!
!
!
!
!
(
P(
P(
P(
P(
P(
P(
P(
P(
P(
P(
P(
P(
P(
P(
P(
P(
P(
P(
P(
P(
P(
P(
P(
P(
(
PP(
P(
P(
P(
P(
P(
P(
P(
P(
P(
P(
P(
P(
P(
P(
P(
P(
P(
P(
P(
P(
P(
P(
P(
P(
P(
P(
P(
P(
P(
P(
P(
P(
P(
P(
P(
P(
P(
P!
!
!
!
!
!
!
!
!
!
!
!
!
!
!
!
!
!
!
!
!
! !
!
!
!
!
!
!
!
!
!
!
!
!
!
(
P(
P(
P(
P(
P(
P(
P(
P(
P(
P(
P(
P(
P(
P(
P(
P(
P(
P(
P(
P(
P(
P(
P(
P(
P(
P(
P(
P(
P(
P(
P(
P(
P(
P(
P(
P Provider!
P(
Metro Transit!
P(
Metro Transit Rail!
P(
MVTA!
P(
SouthWest!
P(
Maple Grove!
P(
Plymouth!
P(
Northstar Link!
P(
Commuter Express Service Suspended TransitwayBlue / Green Line Blue Line Green Line Northstar Line
Red Line 0 5 10 15 20
´
Capacity Changes
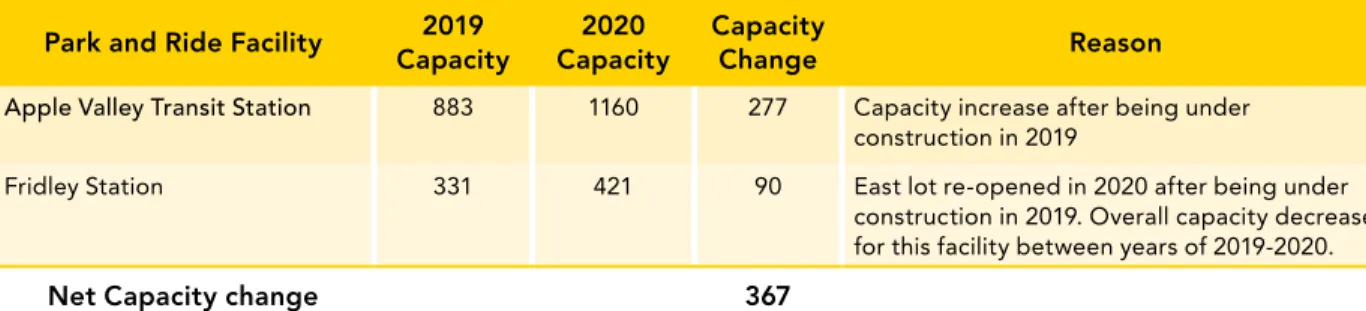
Since the 2019 park-and-ride system survey, 367 spaces have been added and 7,680 spaces were not
included in this year’s survey, totaling a net reduction of 7,313 spaces compared with the 2019 survey.
These are not permanent facility closures, and there were no facilities that reduced their capacity
through structural or physical changes.
System parking capacity additions this year were due to completion of construction projects at two Park
& Rides. At Fridley Station, the east lot reopened with 90 spaces, an overall reduction from 2018. Apple
Valley Transit Station increased capacity by 277 spaces after completing construction of additional
levels to the parking structure.
Table 2: Capacity Changes and Corrections
Park and Ride Facility Capacity2019 Capacity2020 Capacity Change Reason
Apple Valley Transit Station 883 1160 277 Capacity increase after being under construction in 2019
Fridley Station 331 421 90 East lot re-opened in 2020 after being under construction in 2019. Overall capacity decrease for this facility between years of 2019-2020.
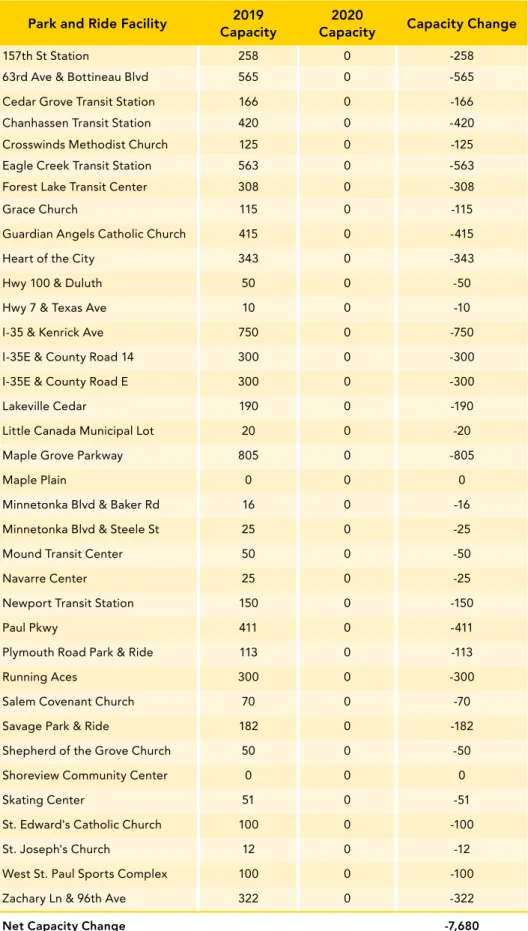
Table 3: Capacity Omissions Due to Commuter Express Service Suspensions Park and Ride Facility Capacity2019 Capacity2020 Capacity Change
157th St Station 258 0 -258 63rd Ave & Bottineau Blvd 565 0 -565 Cedar Grove Transit Station 166 0 -166 Chanhassen Transit Station 420 0 -420 Crosswinds Methodist Church 125 0 -125 Eagle Creek Transit Station 563 0 -563 Forest Lake Transit Center 308 0 -308
Grace Church 115 0 -115
Guardian Angels Catholic Church 415 0 -415 Heart of the City 343 0 -343 Hwy 100 & Duluth 50 0 -50 Hwy 7 & Texas Ave 10 0 -10 I-35 & Kenrick Ave 750 0 -750 I-35E & County Road 14 300 0 -300 I-35E & County Road E 300 0 -300 Lakeville Cedar 190 0 -190 Little Canada Municipal Lot 20 0 -20 Maple Grove Parkway 805 0 -805
Maple Plain 0 0 0
Minnetonka Blvd & Baker Rd 16 0 -16 Minnetonka Blvd & Steele St 25 0 -25 Mound Transit Center 50 0 -50
Navarre Center 25 0 -25
Newport Transit Station 150 0 -150
Paul Pkwy 411 0 -411
Plymouth Road Park & Ride 113 0 -113
Running Aces 300 0 -300
Salem Covenant Church 70 0 -70 Savage Park & Ride 182 0 -182 Shepherd of the Grove Church 50 0 -50 Shoreview Community Center 0 0 0
Skating Center 51 0 -51
St. Edward's Catholic Church 100 0 -100 St. Joseph's Church 12 0 -12 West St. Paul Sports Complex 100 0 -100 Zachary Ln & 96th Ave 322 0 -322
About the System Survey
The park-and-ride system has been surveyed annually since 1999, providing the region with valuable
information about this critical transportation system component. In a collaborative effort, staff from
state, county and regional agencies collected data for vehicles parked at each park-and-ride and
park-and-pool facility. Data collection dates were held in late September and early October 2020. The
survey is conducted during this time to gain accurate data on the typical use of each facility, as Fall is
not a prime vacation time and schools are back in session. The 2020 data was collected once for each
park-and-ride facility with active express bus service, generally between 9 a.m. and 3 p.m. and within
the following dates: Tuesday, Sept. 29 – Thursday, Oct. 1; Tuesday, Oct. 6 – Thursday, Oct. 8.
System-wide license plate surveys are conducted biennially as part of the system survey process and were last
collected in 2018. Due to the ongoing COVID-19 pandemic during the survey period, the decision was
made amongst transit providers and stakeholders to not collect license plate data in 2020 and to defer
that effort into 2021 or later.
Appendix A: Facility Utilization Data
Park & Ride System Data
PR
NUM Provider Name City
2019 Capacity 2019 Usage 2019 % Utilized 2020 Capacity 2020 Usage 2020 % Utilized % Usage Change: 2019-2020 Usage Change: 2019-2020
716 MVTA 157th St Station Apple Valley 258 18 7% 0 0 0% -100% -18 251 Metro Transit Rail 28th Ave Station Bloomington 1585 649 41% 1585 39 2% -94% -610 268 Metro Transit 63rd Ave & Bottineau Blvd Brooklyn Park 565 35 6% 0 0 0% -100% -35 210 Metro Transit 65th Ave & Brooklyn Blvd Brooklyn
Center
242 108 45% 242 7 3% -94% -101 298 Metro Transit Rail Anoka Station Anoka 525 220 42% 525 13 2% -94% -207 712 MVTA Apple Valley Transit Station Apple Valley 883 743 84% 1160 38 3% -95% -705 534 NCDA Becker Municipal Lot Becker 20 7 35% 20 5 25% -29% -2 300 Metro Transit Rail Big Lake Station Big Lake 518 233 45% 518 20 4% -91% -213 152 MVTA Blackhawk Eagan 370 246 66% 370 7 2% -97% -239 710 MVTA Burnsville Transit Station Burnsville 1428 1116 78% 1428 45 3% -96% -1071 312 SouthWest Carver Station Carver 400 28 7% 400 2 1% -93% -26 718 MVTA Cedar Grove Transit Station Eagan 166 44 27% 0 0 0% -100% -44 306 SouthWest Chanhassen Transit Station Chanhassen 420 115 27% 0 0 0% -100% -115 145 Metro Transit Christ Episcopal Church Woodbury 100 48 48% 100 0 0% -100% -48 266 Metro Transit Church of St. William Fridley 50 24 48% 50 0 0% -100% -24 155 Metro Transit Church of the Nazarene Brooklyn
Center
115 92 80% 115 3 3% -97% -89 40 Metro Transit Co Rd 73 & I-394 South Minnetonka 732 407 56% 732 7 1% -98% -400 10 Metro Transit Como & Eustis St. Paul 38 36 95% 38 0 0% -100% -36
PR
NUM Provider Name City
2019 Capacity 2019 Usage 2019 % Utilized 2020 Capacity 2020 Usage 2020 % Utilized % Usage Change: 2019-2020 Usage Change: 2019-2020
231 Metro Transit Rail Coon Rapids/Riverdale Station
Coon Rapids 455 347 76% 455 8 2% -98% -339 245 Metro Transit Cottage Grove Cottage
Grove
525 305 58% 525 19 4% -94% -286 215 Maple Grove Crosswinds Methodist
Church
Maple Grove 125 67 54% 0 0 0% -100% -67 317 Plymouth Dunkirk Park and Ride Plymouth 70 79 113% 70 2 3% -97% -77 711 MVTA Eagan Transit Station Eagan 626 328 52% 626 22 4% -93% -306 722 MVTA Eagle Creek Transit Station Shakopee 563 28 5% 0 0 0% -100% -28 297 SouthWest East Creek Station Chaska 675 246 36% 675 11 2% -96% -235 244 Metro Transit Rail Elk River Station (171st Ave
& Tyler St)
Elk River 754 329 44% 754 17 2% -95% -312 57 Metro Transit Excelsior City Hall Excelsior 20 14 70% 20 2 10% -86% -12 110 Metro Transit Faith-Lilac Way Lutheran
Church
Robbinsdale 25 13 52% 25 0 0% -100% -13 204 Metro Transit Foley Blvd Coon Rapids 1243 873 70% 1243 30 2% -97% -843 294 Metro Transit Forest Lake Transit Center Forest Lake 308 105 34% 0 0 0% -100% -105 253 Metro Transit Rail Fort Snelling South Fort Snelling 586 603 103% 586 43 7% -93% -560 252 Metro Transit Rail Fort Snelling Station North Fort Snelling 398 393 99% 398 36 9% -91% -357 299 Metro Transit Rail Fridley Station Fridley 331 74 22% 421 7 2% -91% -67 180 Metro Transit General Mills Blvd & I-394 Golden Valley 123 52 42% 123 1 1% -98% -51 271 Metro Transit Grace Church Roseville 115 93 81% 0 0 0% -100% -93 262 Metro Transit Guardian Angels Catholic
Church
PR
NUM Provider Name City
2019 Capacity 2019 Usage 2019 % Utilized 2020 Capacity 2020 Usage 2020 % Utilized % Usage Change: 2019-2020 Usage Change: 2019-2020
258 MVTA Heart of the City Burnsville 343 63 18% 0 0 0% -100% -63 319 Metro Transit Hopkins Hopkins 50 36 72% 50 22 44% -39% -14 256 Metro Transit Hwy 100 & Duluth Golden Valley 50 50 100% 0 0 0% -100% -50 269 Metro Transit Hwy 252 and 66th Ave. Brooklyn
Center
120 45 38% 120 4 3% -91% -41 302 Metro Transit Hwy 36 & Rice St Little Canada 280 166 59% 280 6 2% -96% -160 205 Metro Transit Hwy 61 & Co Rd C Maplewood 229 70 31% 229 0 0% -100% -70 173 Metro Transit Hwy 61 & Lower Afton Rd St. Paul 114 133 117% 114 3 3% -98% -130 228 Metro Transit Hwy 610 & Noble Brooklyn Park 1009 627 62% 1009 18 2% -97% -609 158 Metro Transit Hwy 7 & Texas Ave St. Louis Park 10 4 40% 0 0 0% -100% -4 209 Metro Transit Hwy 7 & Vinehill Rd Shorewood 27 1 4% 27 0 0% -100% -1 287 Metro Transit I-35 & Kenrick Ave Lakeville 750 666 89% 0 0 0% -100% -666 304 Metro Transit I-35E & County Road 14 Lino Lakes 300 111 37% 0 0 0% -100% -111 305 Metro Transit I-35E & County Road E Vadnais
Heights
300 64 21% 0 0 0% -100% -64 217 Metro Transit I-35W & 95th Ave Blaine 1482 642 43% 1482 35 2% -95% -607 290 Metro Transit I-35W & Co Rd C Roseville 460 206 45% 460 5 1% -98% -201 161 Metro Transit I-35W & Co Rd H Mounds View 211 197 93% 211 9 4% -95% -188 261 Metro Transit Knox Avenue at Best Buy Richfield 200 183 92% 200 2 1% -99% -181
PR
NUM Provider Name City
2019 Capacity 2019 Usage 2019 % Utilized 2020 Capacity 2020 Usage 2020 % Utilized % Usage Change: 2019-2020 Usage Change: 2019-2020
719 MVTA Lakeville Cedar Lakeville 190 8 4% 0 0 0% -100% -8 82 Metro Transit Little Canada Municipal Lot Little Canada 20 15 75% 0 0 0% -100% -15 704 Metro Transit Louisiana Ave Transit Center St. Louis Park 330 275 83% 330 17 5% -94% -258 301 Maple Grove Maple Grove Parkway Maple Grove 805 601 75% 0 0 0% -100% -601 247 Maple Grove Maple Grove Transit Station Maple Grove 924 879 95% 924 116 13% -87% -763 303 Metro Transit Maple Plain Maple Plain 0 0 0% 0 0 0% N/A 0 701 Metro Transit Maplewood Mall Transit
Center
Maplewood 1007 487 48% 1007 17 2% -97% -470 316 MVTA Marschall Road Transit
Station
Shakopee 442 120 27% 442 7 2% -94% -113 42 Metro Transit Minnetonka Blvd & Baker
Rd
Minnetonka 16 8 50% 0 0 0% -100% -8 43 Metro Transit Minnetonka Blvd & Steele
St
Minnetonka 25 5 20% 0 0 0% -100% -5 715 Metro Transit Mound Transit Center Mound 50 0 0% 0 0 0% N/A 0 291 Plymouth Nathan Lane Plymouth 120 58 48% 120 0 0% -100% -58 114 Metro Transit Navarre Center Orono 25 12 48% 0 0 0% -100% -12 313 Metro Transit Newport Transit Station Newport 150 27 18% 0 0 0% -100% -27 28 Metro Transit Normandale Village Bloomington 25 10 40% 25 0 0% -100% -10 564 NCDA Northstar Link Lot St. Cloud 146 35 24% 146 13 9% -63% -22 703 Metro Transit Northtown Transit Center Blaine 366 154 42% 366 9 2% -94% -145 198 MVTA Palomino Hills Apple Valley 318 203 64% 318 3 1% -99% -200
PR
NUM Provider Name City
2019 Capacity 2019 Usage 2019 % Utilized 2020 Capacity 2020 Usage 2020 % Utilized % Usage Change: 2019-2020 Usage Change: 2019-2020
195 Metro Transit Park Place & I-394 St. Louis Park 67 71 106% 67 6 9% -92% -65 315 Metro Transit Paul Pkwy Blaine 411 272 66% 0 0 0% -100% -272 705 Metro Transit Plymouth Road Park & Ride Minnetonka 113 36 32% 0 0 0% -100% -36 284 Metro Transit Rail Ramsey Station Ramsey 360 298 83% 360 18 5% -94% -280 201 Metro Transit Richardson Park Champlin 66 18 27% 66 0 0% -100% -18 721 MVTA Rosemount Transit Station Rosemount 102 139 136% 102 3 3% -98% -136 293 Metro Transit Running Aces Columbus 300 225 75% 0 0 0% -100% -225 98 Metro Transit Salem Covenant Church New Brighton 70 45 64% 0 0 0% -100% -45 232 MVTA Savage Park & Ride Savage 182 67 37% 0 0 0% -100% -67 177 Maple Grove Shepherd of the Grove
Church
Maple Grove 50 15 30% 0 0 0% -100% -15 191 Metro Transit Shoreview Community
Center
Shoreview 0 0 0% 0 0 0% N/A 0 272 Metro Transit Skating Center Roseville 51 51 100% 0 0 0% -100% -51 707 Metro Transit South Bloomington Transit
Center
Bloomington 195 188 96% 195 10 5% -95% -178 278 MVTA Southbridge Crossing Shakopee 513 220 43% 513 6 1% -97% -214 706 Metro Transit Southdale Transit Center Edina 161 87 54% 161 1 1% -99% -86 713 SouthWest SouthWest Station Eden Prairie 924 829 90% 924 26 3% -97% -803 292 SouthWest SouthWest Village Chanhassen 511 250 49% 511 15 3% -94% -235 223 Metro Transit St Croix Valley Recreation
Center
PR
NUM Provider Name City
2019 Capacity 2019 Usage 2019 % Utilized 2020 Capacity 2020 Usage 2020 % Utilized % Usage Change: 2019-2020 Usage Change: 2019-2020
32 Metro Transit St. Edward's Catholic Church
Bloomington 100 5 5% 0 0 0% -100% -5 187 Metro Transit St. Joseph's Church Lino Lakes 12 3 25% 0 0 0% -100% -3 199 Metro Transit St. Luke's Lutheran Church Bloomington 100 25 25% 100 2 2% -92% -23 242 Plymouth St. Philip/Olive Lane Plymouth 100 85 85% 100 2 2% -98% -83 714 Plymouth Station 73 Plymouth 288 212 74% 288 9 3% -96% -203 248 Metro Transit Walton Park Oakdale 58 31 53% 58 5 9% -84% -26 130 Metro Transit Wayzata Blvd & Barry Ave Wayzata 101 51 50% 101 1 1% -98% -50 142 Metro Transit West River Rd & 117th Ave Champlin 151 43 28% 151 4 3% -91% -39 219 Metro Transit West St. Paul Sports
Complex
West St. Paul 100 35 35% 0 0 0% -100% -35 81 Metro Transit Westwood Lutheran Church St. Louis Park 40 26 65% 40 0 0% -100% -26 222 Metro Transit Woodbury Lutheran Church Woodbury 90 76 84% 90 0 0% -100% -76 229 Metro Transit Woodbury Theatre Woodbury 550 501 91% 550 18 3% -96% -483 143 Maple Grove Zachary Ln & 96th Ave Maple Grove 322 47 15% 0 0 0% -100% -47
Park-and-Pool System Data
PP
NUM Provider Name City
2019 Capacity 2019 Usage 2019 % Utilized 2020 Capacity 2020 Usage 2020 % Utilized % Usage Change: 2019-2020 Usage Change: 2019-2020
505 MnDOT 36 & Manning Grant Twp./ Stillwater
15 3 20% 15 1 7% -67% -2
533 MnDOT Albany Albany 28 12 43% 28 6 21% -50% -6 540 MnDOT Big Lake P&P Big Lake 90 4 4% 90 3 3% -25% -1 568 MnDOT Cannon Falls (S. US 19 across
from athletic fields)
Cannon Falls 64 34 53% 64 6 9% -82% -28 237 MnDOT City Hall- Belle Plaine Belle Plaine 20 7 35% 20 6 30% -14% -1 558 MnDOT East Bethel Ice Arena East Bethel 53 1 2% 53 0 0% -100% -1 503 MnDOT Elk River P&P Elk River 60 2 3% 60 1 2% -50% -1 573 MnDOT Hastings Park & Pool Hastings 100 30 30% 100 59 59% 97% 29 517 MnDOT Hwy 169 & 179TH St NW Princeton 26 14 54% 26 7 27% -50% -7 514 MnDOT Hwy 25 & School Blvd Monticello 187 27 14% 187 23 12% -15% -4 506 MnDOT Hwy 52/Hwy 56/Hwy 50 Hampton 74 49 66% 74 17 23% -65% -32 524 MnDOT Hwy 65 & Co Rd 24 (Anoka Co) East Bethel 41 12 29% 41 3 7% -75% -9 527 MnDOT Hwy 65 & CR 43 & 313th Ave Cambridge 60 7 12% 60 7 12% 0% 0 567 MnDOT I-35 & Co Rd 17 Stacy 85 6 7% 85 5 6% -17% -1 516 MnDOT I-35 & Co Rd 19 Webster Twp./
Northfield
30 13 43% 30 7 23% -46% -6 511 MnDOT I-35 & Co Rd 70 Lakeville 80 6 8% 80 5 6% -17% -1 557 MnDOT I-35 & CR 60 Lakeville 64 6 9% 64 4 6% -33% -2 535 MnDOT I-94 & Co Rd 19 (Wright Co) Albertville 34 5 15% 34 4 12% -20% -1 519 MnDOT I-94 & Hwy 101 (Hennepin Co) Rogers 27 8 30% 27 1 4% -88% -7 510 MnDOT I-94 & Hwy 95 Lakeland 79 10 13% 79 11 14% 10% 1 238 MnDOT Lions Park Jordan 15 3 20% 15 2 13% -33% -1 546 MnDOT Maple Lake VFW Maple Lake 21 1 5% 21 3 14% 200% 2
PP
NUM Provider Name City
2019 Capacity 2019 Usage 2019 % Utilized 2020 Capacity 2020 Usage 2020 % Utilized % Usage Change: 2019-2020 Usage Change: 2019-2020
512 MnDOT Montgomery Twp-MN13 & MN 99
Montgomery Twp.
0 0 0% 15 0 0% 0% 0
572 MnDOT Red Wing Hiawathaland Transfer Station
Red Wing 30 3 10% 30 1 3% -67% -2 561 MnDOT Rockford Rockford 4 6 150% 4 0 0% -100% -6 570 MnDOT St. Bonifacius St. Bonifacius 25 3 12% 25 1 4% -67% -2 529 MnDOT St. Joseph St. Joseph 134 40 30% 134 26 19% -35% -14 526 MnDOT Taylors Falls Taylors Falls 10 3 30% 10 4 40% 33% 1 565 MnDOT Waverly Waverly 27 10 37% 27 2 7% -80% -8 522 MnDOT Wyoming Wyoming 88 23 26% 88 22 25% -4% -1 566 MnDOT Zimmerman Zimmerman 30 1 3% 30 3 10% 200% 2