PREPROCESSING OF SATELLITE DATA FOR URBAN OBJECT EXTRACTION
T. Krauß
DLR – German Aerospace Center, Remote Sensing Institute, M¨unchener Str. 20, 82234 Oberpfaffenhofen, thomas.krauss@dlr.de Commission I, WG I/4
KEY WORDS:Optical Satellite Data, Stereo processing, DSM extraction, Spectral classification, Urban object detection
ABSTRACT:
Very high resolution (VHR) DSMs (digital surface models) derived from stereo- or multi-stereo images from current VHR satellites like WorldView-2 or Pl´eiades can be produced up to the ground sampling distance (GSD) of the sensors in the range of 50 cm to 1 m. From such DSMs the digital terrain model (DTM) representing the ground and also a so called nDEM (normalized digital elevation model) describing the height of objects above the ground can be derived. In parallel these sensors deliver multispectral imagery which can be used for a spectral classification of the imagery. Fusion of the multispectral classification and the nDEM allows a simple classification and detection of urban objects. In further processing steps these detected urban objects can be modeled and exported in a suitable description language like CityGML. In this work we present the pre-processing steps up to the classification and detection of the urban objects. The modeling is not part of this work. The pre-processing steps described here cover briefly the coregistration of the input images and the generation of the DSM. In more detail the improvement of the DSM, the extraction of the DTM and nDEM, the multispectral classification and the object detection and extraction are explained. The methods described are applied to two test regions from two satellites: First the center of Munich acquired by WorldView-2 and second the center of Melbourne acquired by Pl´eiades. From both acquisitions a stereo-pair from the panchromatic bands is used for creation of the DSM and the pan-sharpened multispectral images are used for spectral classification. Finally the quality of the detected urban objects is discussed.
1. INTRODUCTION
Current very high resolution (VHR) satellites like WorldView-2 or Pl´eiades are able to acquire stereo or even triple-stereo scenes from all over the world in ground sampling distances (GSD) of below one meter. From these stereo scenes also high resolution digital surface models (DSM) in the same range of GSD as the imagery can be derived. Together with the multispectral bands acquired by the satellites in parallel a spectral classification can be performed. Combining the DSM with the also high resolution spectral classification objects in urban areas can be detected and in turn extracted. In subsequent steps not covered in this work the detected and extracted urban objects can be modeled and a geo-metric representation of a city-model in level of detail 2 (LOD-2) can be derived.
For this final goal the preprocessing of the satellite data has to be performed carefully to generate usable DSMs together with digital terrain models (DTM) and a good classification. In this work we describe the preprocessing of VHR satellite data from WorldView-2 or the Pl´eiades beginning from the panchromatic and multispectral stereo imagery up to the object detection and extraction.
This preprocessing starts with the relative coregistration of the stereo pair followed by the DSM extraction using the dense stereo semi-global-matching developed at DLR. Since such dense DSMs with the same GSD as the provided input images show many blunders, holes and occlusions also a method for correcting such errors is presented. Talking here from DSMs will induce a wrong image at the reader since we work here not on georeferenced, or-thorectified DSMs and images but on the original satellite data and instead of (real georeferenced) DSMs with so called height-maps. These are datasets fitting exactly on one of the stereo in-put images but containing absolute ellipsoidal heights for each pixel in the original image or no-data values for mismatched or
occluded areas. The whole process of DSM correction and re-finement works on these height-maps.
Only afterwards the height-map and also the panchromatic and multispectral bands are orthorectified to real geocoded DSMs and ortho-images using an especially developed true-ortho-process. Based on the orthorectified DSM a DTM will be extracted to-gether with a normalized digital elevation model (nDEM) repre-senting the object heights above ground. In parallel the spectral classification based on the pan-sharpened and multispectral bands converted to top-of-atmosphere reflectances will be performed. In this step also a new approach of an absolute fuzzy-based clas-sification not needing any training-step will be used. Combining finally the DSM, nDEM and the spectral classification allows the detection and extraction of a defined set of urban objects. This set consists of e.g. buildings, roads, bridges, water, sealed surfaces, trees, bushes and other kinds of vegetation.
Finally the quality of the detected urban objects is discussed an possible reasons for mis-classification are shown.
1.1 Overview of the paper
After a brief introduction and overview of existing works the methods used will be described in chapter 2. These contain in brief the DSM generation in 2.1, the DSM correction (2.2), the DTM extraction (2.3), the spectral classification in 2.4 and finally the detection and extraction of the urban objects in 2.6. In chap-ter 3. the described methods are applied to a WorldView-2 dataset acquired over Munich (3.1) and a Pl´eiades dataset acquired over Melbourne (3.2). In chapter 4. the results are discussed while chapter 5. finally closes the paper.
1.2 Previous work
Many works were already done on urban object extraction and building detection. But most of these approaches work only on
laser scanning and airborne data. In this study we want to show the possibility of urban object detection and extraction from only one stereo pair of very high resolution imagery (VHR, ground sampling distance (GSD) smaller than one metre). Such data suf-fer from the relatively low quality compared to airborne data or even laser scanner data.
So the pre-processing of these data is a work which has to be done very carefully. The first step of the preprocessing is the genera-tion of a best-as-possible digital surface model (DSM). For this we choose the semi global matching method as described in dAn-gelo et al. (2008) which is a so called dense matching preserving height steps as good as possible. After this we have still to cor-rect errors remaining in the generated DSM. An overview over existing errors and strategies to handle them is given in Krauß and dAngelo (2011).
After generation of a good DSM for classification issues the dig-ital terrain model (DTM) representing the ground heights has to be derived. A good approach for this is the mophological re-construction algorithm presented by Arefi and Hahn (2005) and refined in Arefi et al. (2009). But a study comparing different approaches of DTM-generation from DSM (Krauß and dAngelo, 2011) shows that also the simplest possible approach – a mor-phological filtering – works very good in urban areas, especially when the processing times are taken into account.
The next step in the preprocessing is a good classification. Most spectral classifications are based on supervised or unsupervised methods. Supervised classification needs always some training areas. Unfortunately these trainings are not transferable to other remote-sensing images. So for each single scene a new train-ing gets necessary. On the other side the results of unsupervised methods also depend heavily on the image content and need sub-sequent semantic labelling. So only an absolute spectral clas-sification can be used in (fully-)automatic processing chains as aimed in this study. In Krauß et al. (2012) such a method based on spectral fuzzy-classification for WorldView-2 images is pre-sented which seems to be stable enough for the required demands.
2. METHODS 2.1 DSM generation
The sensors used in this investigation have already a very good absolute image positioning of e.g. about 4 m for WorldView-2 only requiring a slight shift for absolute geocorrection. But for a dense stereo matching a relative correlation of the stereo partners of less than a pixel is necessary. To achieve this first correlation points are measured between the two stereo images and the shifts have to be applied to the sensor model of the images which in the cases covered here are so called RPCs (rational polynomial coefficients).
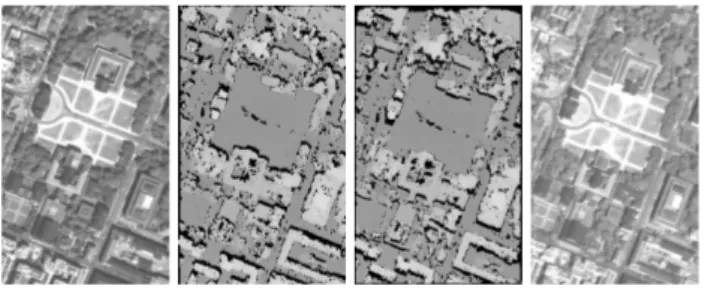
After this relative correction of the stereo images the semi global matching as described in dAngelo et al. (2008) is applied to the images. The result is a so called dense stereo height map fitting exactly on the first image of the stereo pair. The height map repre-sents the disparities (parallaxes) of each pixel from this image to the stereo partner. In the height map these disparities are already converted to absolute ellipsoidal heights using the RPCs. Figure 1 shows the height maps calculated between the first and second panchromatic image (left) and the second and first panchro-matic image (right) in a small300m×500m section of the example Munich WorldView-2 image showing the K¨onigsplatz. The first height map fits exactly on the first panchromatic image
Figure 1. First pan image, height map fitting on first pan image, height map fitting on second pan image, second pan image (l.t.r.), 300m×500m each
(most left) and the second height map fits exactly on the second panchromatic image (most right).
As can be seen also in fig. 1 there exist many areas which can-not be correlated correctly (shown in black). These errors are described in detail in the next section 2.2. In fig. 2 real DSMs de-rived from the height maps are shown in the center. From left to right the images are: the height map fitting on the left image, the DSM derived from the left height map, the DSM derived from the right height map, the height map fitting on the right image. As can be seen in fig. 2 the DSMs move to the same absolute positions but new errors get introduced.
Figure 2. Height map fitting on first pan image, DSM derived from left height map, DSM derived from right height map, height map fitting on second pan image (l.t.r.),300m×500m each 2.2 DSM correction
Figure 2 shows typical errors introduced by the generation of digitial surface models (DSMs) by dense stereo matching. First the large areas below or above the building can be recognized. These areas are the so called “occlusions” and can be detected in areas which cannot be seen in both of the stereo images. So also no intersection of these pixels can be calculated. As can be seen in the height-map in fig. 1 (left) the occlusions are north of the buildings since the first image is acquired from north and these areas are the northern fac¸ades of the buildings in the image. The same but from south holds for the right height map in this image. Besides these occlusions also no-data (black) areas can be seen on moving traffic (busses and cars in the center on the K¨onigsplatz or left on the road). Small court-yards and narrow roads suffer also from occlusions while often errors also occur on trees which look too different in the two stereo images. As can be seen in the DSMs in fig. 2 (center two images) the reprojection of the height-map to a georeferenced DSM also introduces small holes. Other errors are due to specular reflections in one of the images as can be seen in the roof of the Antikensammlung (building south of the K¨onigsplatz in fig. 1. Generally spoken errors in dense stereo DSMs have three sources: occlusions (pixel not seen in both images), too different (moving traffic, specular reflections, tree-tops), too similar (any point on a roof may be a good match). The height map correction is done using supplementary informa-tion from the multispectral image. The panchromatic band and
Figure 3. Height map fitting on first pan image, corrected height map, pan-sharpened first image (l.t.r.),300m×500m each all multispectral bands are delivered coregistered for each stereo image. So a pan-sharpened image with the same resolution as the panchromatic band but all color information from the multispec-tral bands can be calculated easily replacing the weighted inten-sity of the multispectral bands by the inteninten-sity of the panchro-matic band (see rightmost image in fig. 3).
Since the height-map is constructed in a way it fits exactly on the panchromatic band it fits also on the pan-sharpened image. To correct the height map for each no-data value in the height map a neighbouring pixel is searched in the pan-sharpened image which has the most similar color (in all 8 bands!) and a non-no-data value in the height map. This value of the best fitting neighbour is used to fill the missing value in the height map.
In fig. 3 the original height map fitting on the first stereo image is shown together with the filled height map using this method and the corrresponding section of the pan-sharpened first stereo image. After projecting the height-map to a georeferenced DSM the newly introduced holes may simply be filled by applying a median filter with a small filter radius.
2.3 Deriving DTM and nDEM
After correction of the height map the digital terrain map (DTM) and in turn also the normalized digital elevation model (nDEM) may be derived. For extracting a DTM from a DSM many meth-ods exist. As shown in the comparison Krauß and dAngelo (2011) we choose the most simple method which performs best in urban areas. In this method a DSM is scaled down so thatr= 5pixels in the downscaled image correspond to about 100 m. In the scal-ing for each region scaled down to one pixel only the lowest value is taken. Afterwards a morphological opening with radiusris ap-plied to the scaled DSM and also a gaussian filtering ofσ=r/2 before finally upscaling the result back to it’s original size.
Figure 4. Corrected height map, DTM and nDEM,2500m× 2000m each
Fig. 4 shows the filled height map, the derived ground map and the normalized DEM. The latter is simply the difference of the height map minus the derived ground map (DTM). In fig. 5 a profile through these three digital elevation models is shown. In blue the original corrected height map is shown. The green line represents the ground height (DTM) and the red line depicts the object-heights above the ground (nDEM).
Figure 5. Profile from left top to right bottom in fig. 4, blue: height map, green: ground, red: normalized DEM, height map and ground with an offset of−520m
2.4 Spectral classification
For spectral classification the gray-values (digital numbers, DN) of the image first have to be converted to physical radiances us-ingL=DN·gain+offsetwith a unit [ mW/(cm2·sr·µm)]. Thegainandoffsetvalues are provided in the image metadata. In the next step the physical radiances are converted to compa-rable top of atmosphere (TOA) radiances following the formula in Krauß et al. (2012). For the spectral fuzzy classification the fuzzy-operators are defined as in tab. 1.
Table 1. Fuzzy-operators Symbol Name Definition
a>edb greater-thanFuzzy 0 for b−d > a a−b+d 2d for b−d < a < b+d 1 for a > b+d a<edb lower-thanFuzzy 1 for b−d > a b−a+d 2d for b−d < a < b+d 0 for a > b+d ae∪b Fuzzy or max(a, b)
ae∩b Fuzzy and min(a, b)
The spectral classification from the multispectral bands of the pansharpened TOA image is calculated as follows (B,G,Y,R, RE,Nare the blue, green, yellow, red, red-edge and nir-infrared band, the values associated with the bands are TOA reflectances in%·100(100 = 1 %)): dn=(B>5e G+ 35)e∩(G>14e Y + 16)∩e(Y >5e R+ 15)e∩ (R>5e RE+ 10)e∩(RE>2e .5N+ 7.5)∩e(N>10e 110) (1) ndvi=N−R N+R (2) vm=ndvi>0e .10.2 (3) wm=(dn>0e .059,65)e∪ ((ndvi<0e .0125−0.1875)∩e(N<50e 150)) (4) sm=(B<2e .5G−2.5)∩e(G<2e .5R−27.5)∩e (G<5e N−95)∩e (B<5e G−5)∩e(G<5e Y −5)∩e(Y <5e R)∩e (R>5e RE+ 5)∩e(RE>5e N+ 5) (5)
After calculatingdn(band values decreasing) and the normalized digital vegetation index (NDVI)ndvithe vegetation-maskvm, the water-maskwmand the soil-masksmcan be derived.
Figure 6. Pan-sharpened first image “K¨onigsplatz”, derived clas-sification (green: vegetation-mask, blue: water-mask, red: soil-mask),300m×500m each, notice the correctly as water detected fountain in the bottom of the image
As shown in fig. 9 the classification gives the three classes “veg-etation”, “water” and “soil”. The soil class is calculated but no more needed for the following classification fusion. In fig. 9 can be seen a small square in the bottom left edge. On this square also a fountain containing correctly classified water can be detected. 2.5 Fusion of nDEM and spectral classification
In the next step the nDEM and the spectral classification gets fused to add the height to classification. For this a simple thresh-old of 5 m is introduced and a high-objects-mask calculated from the nDEM:
hm= (
1 for nDEM >5m
0 for nDEM ≤5m (6)
2.6 Extraction of urban objects
Using the fused classification masks the following objects can be extracted:
Table 2. Object detection high vegetation water soil Object mask mask mask mask
Trees 1 1 0 0
Buildings 1 0 0 0–1
Grass 0 1 0 0
Roads 0 0 0 0–1
Water 0 0 1 0
Beneath these simple objects in future also more complex objects requiring context information may be extracted. These include e.g. the “high” water (mostly glass roofs of buildings) or bridges (“buildings” with smooth transition on two sides and steep edges on the other sides). Also the handling of water-objects has to be optimized. So mostly the DSM on water is very noisy and maybe fountains, rivers and lakes may be distinguished using context information. Also the soil-mask may be used to detect stressed vegetation (see fig. 9 the paths over the green areas) or distinguish different roof types.
3. EXAMPLES 3.1 WorldView-2 – Munich
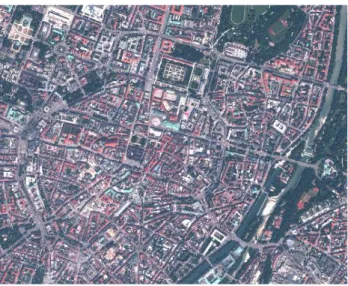
For the first example we use a scene acquired by WorldView-2 on 2010-07-12 at 10:30:16 and 10:30:55 respectively. The az-imuth and incidence angles of the two scenes of the stereo pair were 17.6/5.2 and 194.5/13.9 degree. So the first scene was ac-quired from north, the second from south. The sun-azimuth and -elevation were 155 and 62.2 degree. For the example a section of 2500×2000metres (left top edge11.5633687◦N,48.1477465◦ E, ground sampling distance 0.5 m) of the center of Munich was choosen.
Figure 7. Section of the WorldView-2 Munich scene,2500m× 2000m
In the first step a heightmap as shown in fig. 8 was generated using the SGM algorithm described in 2.1 needing 26 minutes for a height range of 500 to 600 m.
Figure 8. Height map ranging from 500 to 600 m fitting on the first WorldView-2 image,2500m×2000m
The filled DSM, the DTM and nDSM are already shown in fig. 4. After applying the classifications descibed above the classifica-tion projected on the corrected DSM is shown in figs. 9. 3.2 Pl´eiades – Melbourne
The second example is a stero-scene acquired over Melbourne by Pl´eiades on 2012-02-25 at 00:25:41.8 and 00:26:09.0 respec-tively. The azimuth and incidence angles of the two scenes of the
Figure 9. Fused classification Munich,2500m×2000m, red: buildings, dark green: trees, green: grass, blue: water, brown: soil, gray: roads/sealed surfaces
stereo pair were 0.01/11.01 and 0.02/5.66 degree. So both scenes were acquired from north. The sun-azimuth and -elevation were 54 and 50 degree. For the example a section of2500×2000 me-tres (left top edge: 144.9477391376◦E,−37.8089806144◦S, ground sampling distance 0.5 m) of the center of Melbourne was choosen as shown in fig. 10.
Figure 10. Section from the Pl´eiades Melbourne scene, right: filled height-map, both2500m×2000m
Fig. 10 shows also the filled an corrected height-map on the right side. Fig. 11 shows the georeferenced DSM, DTM and nDEM from the height-map.
Figure 11. DSM, DTM and nDEM geographically correct pro-jected from the Pl´eiades Melbourne scene,2500m×2000m The spectral calibration derived in 2.4 works not very well for the Pl´eiades images. Of course Pl´eiades have only four multispectral bands in contrast to WorldView-2 so the criteria involving the yellow and the red-edge bands can no more be applied. Large shadow areas in the image lead to confusion of water and shadow classes. So special new parameters were derived from the images as shown in eqs. 7 through 9.
vm=ndvi >0.45 (7)
wm= (ndvi<0e .05−0.35)·(N<100e 400) (8)
sm= (B>5e N+ 45) (9)
The special calculated shadow-mask 9 helps to distinguish bet-ween water and shadow. Shadow areas are wm e∩ smwhile water areas arewm∩e(1−sm). The result is shown in fig. 12
Figure 12. Spectral classification from the Pl´eiades Melbourne scene, 2500m×2000m, blue: water, green: vegetation, red: shadow
Fig. 13 shows the normalized height-map and the finally derived objects.
Figure 13. Normalized heightmap and fitting final classification, 2500m×2000m, red: buildings, dark green: trees, green: grass, blue: water, brown: soil, gray: roads/sealed surfaces
4. RESULTS AND DISCUSSION
The results shown in 3.1 and 3.2 show already a good classifica-tion. But looking in detail reveals still many errors in the derived DSM and such also much noise in the results.
Also the spectral classification based only on TOA images is not as stable and not as transferable between sensors as expected. Especially the water classification is always very tricky since it is mostly not good distinguishable from shadows. In the Munich example this works still very good but in the Melbourne example the spectral classification shows its weakness and needs a special shadow-mask to be added for better classification. Surprisingly the water detection in the Munich scene is so good that even foun-tains (e.g. the four in the Hofgarten, center top in fig. 9) can be detected.
Most errors in the classified results are caused by a too bad DSM. If we look e.g. in fig. 3 on the Glyptothek (building north of the K¨onigsplatz) the left wing is mis-matched already in the height-map. So “valid” height points exist, but they are wrong (nearly
on terrain) and the few really existing no-data values are filled from these wrong heights which results in a hole in the classified building.
Also due to the pan-sharpening the spectral classification is blurred compared to the DSM. This can be seen on areas classified as grass beside trees.
5. CONCLUSIONS AND OUTLOOK
The methods presented in this work allow the pre-processing of satellite stereo scenes from very high resolution sensors using only the panchromatic stereo imagery and one multispectral im-age for detection and discrimination of many urban objects. In further processing steps the classified and extracted urban objects will be modeled and described in a suitable format like CityGML. Many works exist already on building reconstruction from good laser-DSMs which do not work for the noisy DSMs derived from satellite data.
The presented results suffer still from errors in the DSM. So addi-tional methods for DSM correction has to be developed to detect outliers and mismatches directly in the height-maps fitting ex-actly on the input imagery. To conclude it can be stated that the good preprocessing of satellite imagery for automatic extraction and modeling of urban objects is still a challenge.
References
Arefi, H. and Hahn, M., 2005. A morphological reconstruction algorithm for separating off-terrain points from terrain points in LASER scanning data. ISPRS Journal of Photogrammetry and Remote Sensing.
Arefi, H., dAngelo, P., Mayer, H. and Reinartz, P., 2009. Au-tomatic generation of digital terrain models from cartosat-1 stereo images. International Archives of the Photogrammetry, Remote Sensing and Spatial Information Sciences.
dAngelo, P., Lehner, M., Krauß, T., Hoja, D. and Reinartz, P., 2008. Towards automated dem generation from high resolution stereo satellite images. In:IAPRS, Vol. 37, pp. 1137–1142. Krauß, T. and dAngelo, P., 2011. Morphological filling of digital
elevation models. In: ISPRS Journal of Photogrammetry and Remote Sensing, Vol. 39.
Krauß, T., Sirmacek, B., Arefi, H. and Reinartz, P., 2012. Fus-ing stereo and multispectral data from WorldView-2 for urban modeling. In:Proc. SPIE 8390, Vol. 83901X, p. 2012.