PETER DANIEL SANGALI
A DISSERTATION SUBMITTED IN PARTIAL FULFILMENT OF THE REQUIREMENTS FOR THE DEGREE OF MASTER OF BUSINESS
ADMINSTRATION (FINANCE) OF THE OPEN UNIVERSITY OF TANZANIA
CERTIFICATION
I, the undersigned certifies that I have read and hereby recommends for acceptance by The Open University of Tanzania a dissertation titled “Comparative Analysis of Financial Performance of Saving and Credit Cooperative Societies In Kisarawe District” in partial fulfillment of the requirements for the degree of Master in Business Administration of The Open University of Tanzania.
……… Dr. Deus Dominic Ngaruko
(Supervisor)
……… Date
COPYRIGHT
No part of this dissertation shall be reproduced, stored in retrieval system or transmitted in any form or by any means electronically, mechanically or photocopying, recording or otherwise without prior written permission of the author or the Open University of Tanzania.
DECLARATION
I, Peter Daniel Sangali, declare that this dissertation is my own original work, and it has not been presented and will not be presented to any other university for a similar or any other degree award.
……… Signature
……….………..……… Date
DEDICATION
This work is dedicated to my father, Richard Jacob Sangali, a gentleman and my mother, Olivia Sangali, a great lady and visionary for their love and education of their children. Both were very instrumental to me for they encouraged me to go to school in my early ages when I was despaired because of long distance from home to school.
ACKNOWLEDGEMENTS
I find it my absolute duty to extend and express my sincerely gratitude to the entire lot of people who in one way or another, have contributed to the realization of this dissertation. First and foremost thank God, the Almighty for his compassionate love to me all the time I attended the MBA classes. Special thanks go to my Pastor Zakaria Lulee, men and women of God of the Jesus Saves Fellowship for their prayers to God so that I may succeed in my pursuing the degree. I would like to pass on my endless gratitude to my Supervisor Dr. Deus Dominic Ngaruko, who has been of valuable guidance, educative and providing constructive criticism when supervising my work all the way through from the beginning of the research proposal to the completion of the dissertation.
My special acknowledgement are extended to Head of Cooperatives Department of the Kisarawe District Council (KDC) Mrs. Valeria Njile, SACCOs officials and committee members for giving me valuable information on the SACCOs’ performance and for allowing me to carry out the research at the Department and SACCOs offices at no cost. I would also wish to pass on many thanks to Assistant District Executive Director of the KDC Mr. Gwamaka Mlagila for his assistance and access given to me to use the office documents with ample relevant materials of my research.
I am also thankful to the KDC for the opportunity given to me to attend the classes at the Open University of Tanzania especially, allowing me to attend the classes every evening.
I would also like to pass on many words of thanks to the entire staff of the Agriculture and Livestock Departments for their heartfelt co-operation which enabled me to accomplish the assignment.
Finally, as it would appreciated, it is not possible for me to express my thanks to everyone individually, I am therefore taking this opportunity to thank everyone, whom, in one way or another, have contributed to the success of this work. Once again, thank you all.
ABSTRACT
The purpose of this study was to compare the financial performance of employee and community based saving and credit cooperatives societies in Kisarawe district. Indicators of financial performance were size of a SACCO, capital, operating expenses, liquidity, and loan to members ratios. The population was a sample of eight SACCOs operating in Kisarawe district; three of them are employee-based while the remaining five are community-based SACCOs. The researcher employed secondary data method of data collection. Secondary data included annual SACCOs’ reports and only audited financial statements for individual SACCOs for the period 2008-2011 were used. The findings of the study revealed that E-SACCOs exploit more efficiently economies of scale than C-SACCOs that is the former enjoy more cost advantage which arises with increased output of total assets than the later and thus E-SACCOs perform better financially than C-SACCOs. E-SACCOs have smaller amount of cash to lend to members, that is smaller working capital than SACCOs and therefore the former perform better financially than the later. C-SACCOs have a better sound capital position and are able to pursue business opportunities more effectively and have more flexibility to deal with problems arising from unexpected losses, thus achieving more increased profitability than E-SACCOs. Therefore E-SACCOs performed better financially than C-SACCOs in terms of size of a SACCO, operating expenses and loan to members, but C-SACCOs performed better financially than E-SACCOs in terms of liquid investment and capitalization.
TABLE OF CONTENTS CERTIFICATION ... ii COPYRIGHT ... iii DECLARATION ... iv DEDICATION ... v ACKNOWLEDGEMENTS ... vi ABSTRACT ... viii
LIST OF TABLES ... xiii
LIST OF FIGURE ... xiv
APPENDICES ... xv
LIST OF ABBREVIATIONS AND ACRONYMS ... xvi
CHAPTER ONE ... 1
1.0 BACKGROUND INFORMATION ... 1
1.1 Introduction ... 1
1.2 Statement of the Research Problem ... 5
1.3.1 General Research Objective ... 6
1.3.2 Specific Objectives ... 7
1.4 Research Questions ... 7
1.4.1 General Research Question ... 7
1.4.2 Specific Research Questions ... 7
1.5 Relevance of the Research ... 8
1.6 Organization of the Report ... 9
2.0 LITERATURE REVIEW ... 10 2.1 Introduction ... 10 2.2 Conceptual Definition ... 10 2.2.1 SACCOs/Credit Unions ... 10 2.2.2 Comparative Analysis ... 12 2.2.3 Financial Performance ... 13 2.2.4 Financial Analysis ... 14
2.3 Critical Review of Supporting Theories ... 15
2.4 Empirical Analysis of Relevant Studies ... 20
2.4.1 General Studies ... 20
2.4.2 Studies on African Countries ... 21
2.3.3 Studies in Tanzania ... 22
2.5 Research Gaps ... 25
2.6 Analytical / Conceptual Framework ... 26
2.6.1 Size of a SACCO ... 26
2.6.2 Capital Ratio ... 27
2.6.3 Operating Expenses Ratio ... 28
2.6.4 Loan Portfolio Ratio ... 28
2.6.5 Liquidity Ratio ... 29 CHAPTER THREE ... 30 3.0 RESERCH METHODOLOGY ... 30 3.1 Introduction ... 30 3.2 Research Strategies ... 30 3.2.1 Survey Population ... 31
3.2.2 Area of the Research or Survey ... 32
3.3 Sampling Design and Procedure ... 32
3.3.1 The Sample Frame ... 32
3.3.2 The Sample Size and Sampling Design ... 33
3.4 Variables and Measurement Procedures ... 33
3.5 Methods of Data Collection ... 33
3.6 Data processing and Analysis ... 34
CHAPTER FOUR ... 38
4.0 DATA PRESENTATION, ANALYSIS AND INTERPRETATION ... 38
4.1 Introduction ... 38
4.2 Financial Performance Measures of E-SACCOs and C-SACCOs ... 39
4.2.1 Size of a SACCO ... 39
4.2.2 Capitalization ... 39
4.2.3 Operating Expenses ... 42
4.2.4 Liquid Investments ... 42
4.2.5 Volume of Loan Portfolio ... 45
4.3 Difference in Financial Performance Between E-SACCOs and C-SACCOs 47 4.3.1 Size of a SACCO ... 47
4.3.2 Capitalization ... 48
4.3.3 Operating Expenses ... 48
4.3.4 Liquid Investments ... 49
4.3.5 Volume of Loan Portfolio ... 49
4.3 Comparison of Financial Performance between E-SACCOs and C-SACCOs50 4.3.1 Size of a SACCO ... 50
4.3.2 Capitalization ... 51
4.3.3 Operating Expenses ... 52
4.3.4 Liquid Investment ... 53
4.3.5 Volume of Loan Portfolio ... 54
CHAPTER FIVE ... 56
5.0 DISCUSSION, CONCLUSION AND RECOMMENDATIONS ... 56
5.1 Introduction ... 56
5.2 Discussions ... 56
5.3 Conclusions ... 58
5.5 Recommendations ... 59
5.4 Areas of Further Research ... 60
REFERENCES ... 62
LIST OF TABLES
Table 1.1: Active SACCOs Operating in Kisarawe District ... 5 Table 2.1: Role of ROE, ROA, EM, PM, and AU in Analyzing Financial Institution
Performance ... 19 Table 3.1: Financial Performance Variables Against Measurements ... 35 Table 4.1: Assets of SACCOs Operating in Kisarawe District in Tanzanin Shillings
(T shs.) Employee-based SACCOS ... 40 Table 4.2: Capitalization of SACCOs Operating in Kisarawe Districts in Tanzanian
Shillings (Tshs.) Employee-based SACCOS ... 41 Table 4.3: Operating Expenses of SACCOs Operating in Kisarawe District in
Tanzanian Shillings (T shs.) Employee- based SACCOS ... 43 Table 4.4: Liquid Investments of SACCOs Operating in Kisarawe District in
Tanzanian Shillings (T shs.) Employee-based SACCOS ... 44 Table 4.5: Loan Portfolios of SACCOs Operating in Kisarawe District in Tanzanian
LIST OF FIGURE
Figure 2.1: Conceptual Framework ... 26
APPENDICES
Appendix I: Checklist Designed for Collecting Secondary Data... 72 Appendix II: Balance Sheet Information ... 73 Appendix III: Income and Expenditure Statement Information ... 75 Appendix IV: Assessing the Financial Health of SACCOs by using WOCCU Ratio
Benchmarks ... 76
LIST OF ABBREVIATIONS AND ACRONYMS
KDC - Kisarawe District Council
SACCOs - Saving and Credit Cooperatives Societies C- SACCOs - Community –based SACCOs
E-SACCOs - Employee-based SACCOs WOCCU - World Council of Credit Unions MFIs - Microfinance Institutions
CHAPTER ONE
1.0 BACKGROUND INFORMATION
1.1 Introduction
This study intends to examine the comparative analysis of financial performances of employee and community based saving and credit cooperative society operating in Kisarawe district. It does so by computing selected financial performance measures, examining the difference in performance between the two SACCOs and determining whether E-SACCOs perform better financially than C-SACCOs in terms of size of a SACCO, capital, liquidity, loan to members, and operating expenses ratios.
The study motivation stem from the fact that no studies that has been done in Tanzania which focused on the comparative analysis of financial performance of employee and community based SACCOs. The study will use both quantitative and qualitative data, secondary data will be collected through special data filling sheets named balance sheet information forms and income and expenditure statement information forms. Secondary data will be obtained from Department of Cooperatives of the Kisarawe district council and from respective employee and community based SACCOs offices.
In Tanzania, informal microfinance programmes have been in operation for many years, however the majority of formal schemes were initiated in 1990s (Chijoriga, 2000). Additionally, the government put in place the National Microfinance Policy in 2000 with the main objective of establishing the basis for efficient and effective microfinance system in the country that serves the low income segment of the society
and thereby contributing to economic growth and reduction of poverty (URT, 2000). Like in other countries, institutions which are providing microfinance services in Tanzania fall into three categories: formal, semiformal and informal sectors (Cornford, 2001 and ADB, 2000). Depending on the sector, the level of organisation management may differ considerably from one category of microfinance institution to another.
For example, while formal financial institutions may require a particular organisation structure to function effectively, the informal financial institutions may require a totally different structure (Malaki, 2005). The formal sector is characterized by a high level of regulation and supervision that provides some level of resources to borrowers and savers. Organisations within this sector include banks (commercial, rural, savings, postal, cooperative), development banks (state-owned or private), finance companies, building societies and credit unions, pension funds and insurance companies (Cornford, 2001).
Given the nature of the informal sector, the arrangements for the service providers and their clients are based on social networks/ties, in which norms and conventions are socially embedded (Malaki, 2005). MFIs in Tanzania were not allowed to collect savings from their clients in previous years. However, a new legislation enacted in 2006 allows the creation of microfinance companies (MFCs) that will be regulated by the BOT and be able to do banking business (URT, 2006). Under this new regulation, MFIs are allowed to receive deposits from the general public through payable upon demand.
This is considered as one of the achievements in the industry because savings mobilisation creates a saving culture among MFIs clients and also builds up the capacity of MFIs in providing micro-credits. Basing on the regulatory improvements, Randhawa and Gallardo (2003) argued that a legal and regulatory framework is one factor that influences the emergence of different kinds of institutional providers of microfinance and, especially, their development into self-sustaining, commercial microfinance institutions capable of reaching growing numbers of poor clients, especially in rural areas.
Empirical evidence shows that Savings and Credit Cooperative Society (SACCOS) is one type of cooperative societies with the principal objective of accumulating savings and create a source of credit to its members at a fair and reasonable rate of interest (URT, 2004). The primary activities of SACCOS are to mobilize savings and furnish secured and unsecured loans or credits. SACCOS are recognized as an important means achievement of individual members‟ development goals.
Randhawa and Gallond (2003) observed that in a very real sense cooperatives were contributing substantially to economic development in most developing countries. However, following the introduction of free market, the SACCOS have struggled to compete with private sector and many have not been able to provide their members with services they needed (Abeid, 2001). The government has responded to this problem by introducing a new Cooperative Development Policy (2002), Cooperative Societies Act No.20 of 2003 and its regulations (2004) to help cooperative societies regain their importance in the economic living of the people. The policy provided the
basis for the development of cooperative societies as members owned and organized institutions. The Act provided that the objective of cooperative societies was the promotion of economic and social interests of its members by means of common undertaking.
Community-based SACCOs are defined as democratic member-owned financial cooperatives exist to serve their members and communities through provision of convenientand affordable financial services; they are user-owned financial cooperatives that offer savings, credit and other financial services to their members (WOCCU, 2005). These SACCOs can be found in urban areas or regional towns, but are most frequently encountered on village level. A variety of group and individual loans can be found, including women solidarity loans, business loans for individual members, or loans for small and micro enterprises.
Employee-based SACCOs are cooperative based on employment as a common bond, that is, all members who work under one employer form a savings and credit cooperative society and are encouraged to save through a check-off system from their monthly salaries. This way, regular savings are accumulated and it is from this that loans are given (Ouma, 1989). These represent SACCOs where all the members are drawn from one employer and these SACCOs are generally located in urban areas or regional level. Specific salary-based loans are extended which are often guaranteed by the employer.
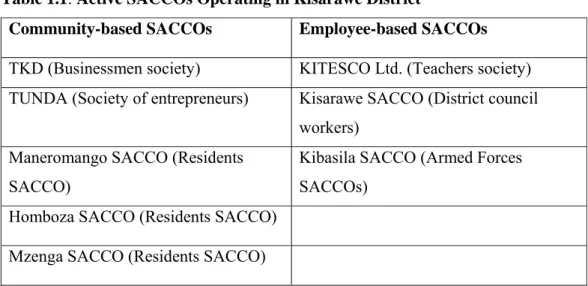
The Department of cooperatives of the Kisarawe district council annual reports of 2012 sho that in Kisarawe district there were 25 SACCOs and only 8 of them are
active. The following Table 1.1 shows the active Employee-based SACCOs and Community-based SACCOs.
Table 1.1: Active SACCOs Operating in Kisarawe District
Community-based SACCOs Employee-based SACCOs TKD (Businessmen society) KITESCO Ltd. (Teachers society) TUNDA (Society of entrepreneurs) Kisarawe SACCO (District council
workers) Maneromango SACCO (Residents
SACCO)
Kibasila SACCO (Armed Forces SACCOs)
Homboza SACCO (Residents SACCO) Mzenga SACCO (Residents SACCO)
Source: Department of Coopertives, Kisarawe District Council, (2012)
The main purpose of this study is to conduct comparative analysis of financial performance of Employee-based SACCOs and Community-based SACCOs in Kisarawe district.
1.2 Statement of the Research Problem
The main concern of this study was to conduct comparative analysis of financial performances of employee based and community based saving and credit cooperatives societies operating in Kisarawe district. In Tanzania, various studies has mainly focused on examining the evaluation of financial performance of SACCOs (Wingerden and Levelink, 2012); values of savings in occupational SACCOS (Kerstin and Wiberg, 2003); and sustainability of employee based SACCOs (Ikandilo Kushoka, 2010).
Ikandilo Kushoka, (2010) revealed that SACCOS which issues less amount of loan to its members and which has little capital base is likely to be unsustainable. Insufficient fund lead SACCOS members to opt for banking and NGO’s financial institutions which are providing credit facilities. Kerstin and Wiberg (2003) noted that financial development is playing an important role in Tanzania’s economic progress. The study revealed that financial failures, particularly high transaction costs limit poor people’s access to formal finance and prevent low income people from borrowing and saving.
They asserted that employees based SACCOS have great possibility of serving its members, since they are situated at working places and that occupational SACCOS are more successful than rural SACCOS. This study takes Kerstin and Wiberg (2003) as its point of departure which noted the significance of occupation based SACCOS in savings mobilization and wealth accumulation but less focus on the comparison of financial performance between employee and community based SACCOs.
It is against this background that the current study wants to compare the financial performance of employee and community based SACCOS.
1.3 Research Objectives 1.3.1 General Research Objective
This study aims at conducting comparative analysis of financial performance of Employee-based SACCOs (E-SACCOs) and Community-based SACCOs (C-SACCOs) operating in Kisarawe district.
1.3.2 Specific Objectives
(i) To compute selected financial performance measures of E-SACCOs and C- SACCOs
(ii) To examine the difference in performance between E-SACCOS and E-C-SACCOS) using Size of a SACCO, Capital, liquidity, Loan to members, and operating expenses ratios.
(ii) To determine whether E-SACCOs perform better financially than C-SACCOs in terms of size of a SACCO, capital, liquidity, loan to members, and operating expenses ratios
1.4 Research Questions
1.4.1 General Research Question
(i) How do SACCOs measure their financial performance?
(ii) Is there any difference in performance between E-SACCOs and C-SACCOs using size of SACCO, capital, liquidity, loan to members, and operating expenses ratios?
(iii) Do E-SACCOs perform better financially than C-SACCOs in terms of size of a SACCO, Capital, liquidity, loan to members, and operating expenses ratios?
1.4.2 Specific Research Questions
(i) At what percentages do E- SACCO and C- SACCO measure their financial performance?
(iv) Is there any difference in percentages of the financial performance measures between the two SACCOs in terms of size of a SACCO, capital, liquidity, loan to members, and operating expenses ratios?
(v) Are E-SACCOs percentages of the financial performance measures better than C-SACCOs percentages in terms of size of a SACCO, capital, liquidity, loan to members, and operating expenses ratios?
1.5 Relevance of the Research
This study will be of benefit to policy makers, SACCO members, extension staff, women, youth and the community at large. The study explores and compares financial performance between employee and community based SACCOs and determines financial positions of the two associational bonds so as to obtain an insight on the performance of these SACCOs and suggest possible recommendations for improvement.
Policy makers will also benefit in the sense that, the findings provide informed suggestions on how policy can be improved. With improved and easy to implement policies, more people, women, youth and the community at large will be able to access, join and benefit from the loan fund of SACCOs. Inaddition, policy makers in the industry will have performance benchmarks against which to steer the operations of SACCO towards better operations. The findings of this study will enhance the efforts of government regulators in coming up with regulations that will govern the operations of SACCOs. The researcher will gain immense knowledge in the way SACCOs should be run and thus organize programs aimed at creating awareness on how to run these institutions for the benefit of the members.
The study will contribute to the achievement of the government’s policy of prosperity for all through sensitizing the rural poor on how to benefit from properly
run SACCOs. The study will facilitate better SACCO’s management by enhancing the knowledge of the board members in overseeing the management of the Institutions. SACCO members will also be able to realize their roles in the operations of SACCOs and begin or continue to play their part.
The results will help SACCO managers in Tanzania to improve financial performance of SACCOs under their charge. This is important because improved performance of SACCO will instil confidence in members and encourage them to participate in SACCO activities. Finally, the general microfinance industry, whose role is to agglomerate savings and lend to borrowers, will find these results useful.
1.6 Organization of the Report
Chapter two contains literature review which is subdivided into over view, conceptional definitions, critical review of supporting theories or theoretical analysis, empirical analysis of relevant studies, identification of research gap, analytical/conceptual framework for studying the problem and analyzing the data, theoretical framework, statement of hypothesis and summary. Chapter three contain Research Design and Methods which is composed of overview, research or survey, sampling design and procedures, variables and measurement procedures, methods of data collection, data processing and analysis and expected results of the study. The remaining part consists of research activities/schedule, work plan, estimated research budget, expected time of commencing the study, expected time of completing the study, signatures of student and date, comments of supervisor and signature, references and appendices.
CHAPTER TWO 2.0 LITERATURE REVIEW
2.1 Introduction
This chapter explains conceptual definitions, critical review of supporting theories or theoretical analysis, empirical analysis of relevant studies, research gap identified, analytical/conceptual frame week, theoretical framework, and summary. This chapter defines all concepts used in this proposal and other meanings prevailing in the literature. It explains some theories of similar problem which has been studied from different perspectives and approaches, and how relevant are these theories to my study.
The chapter elaborates some practical studies of this nature which have been done in Tanzania, other African countries, and the outside world. The chapter identifies research gap from the analysis of theoretical and empirical literature, conceptualization of research problem showing what variables and relationships are involved and the probable strategies for solving it. This chapter also identifies and describes the characteristics of the variables considered in the conceptual model, which are variables that will be measured. Lastly is a brief account of the analysis of the literature.
2.2 Conceptual Definition 2.2.1 SACCOs/Credit Unions
The World Council of Credit Union (WOCCU) defines Savings and credit cooperatives as democratic member-owned financial cooperatives exist to serve their
members and communities through provision of convenientand affordable financial services; they are user-owned financial cooperatives that offer savings, credit and other financial services to their members (WOCCU, 2005). This definition tells that the primary objectives of SACCOs is not profit making.
However, SACCOs use excess earnings to offer members more affordable loans, a higher return on savings, lower fees or new products and services. Hence, SACCOs have to charge rates on loans that cover all costs (cost of fund, operation costs, administration cost and cost of provision). Paying competitive salary to its employee and contribution to increase capital are also vital to growth and success.
Ouma (1989) defines Savings and Credit Cooperatives (SACCOs) as cooperative based on employment as a common bond, that is, all members who work under one employer form a savings and credit cooperative society and are encouraged to save through a check-off system from their monthly salaries. This way, regular savings are accumulated and it is from this that loans are given. In Tanzania Maganga (2009) defines SACCOs as part of the larger scheme of microfinance and are “user owned financial intermediaries” in which members are identical in some aspects such as community or location.
Were (2009) defines SACCOs as member owned institutions whose core business is to encourage thrift and easy access to credit to their members. Members pull resources together in form of savings, and the SACCO uses the mobilized savings to extend small credit facilities to them. From these definitions, several facts emerge
clearly. A SACCO is a cooperative financial intermediary institution, owned and controlled by members who use its services.
They exist to provide a safe, convenient place for members to save money and to get loans and other financial services at reasonable rates. They play an important role in resource allocation where savings are transferred to economic units that have opportunity for profitable investment. In this study the words “SACCOs” and “credit unions” are used interchangebly.
2.2.2 Comparative Analysis
Comparative analysis is the item by item comparison of two or more comparable alternatives, processes, or the like. In accounting, for example, changes in a financial statement’s items over several accounting periods may be presented together to detect the emerging trends in the company’s operations and results (www.businessdictionary.com).
"Classic" compare-and-contrast papers, in which you weight A and B equally, may be about two similar things that have crucial differences (two pesticides with different effects on the environment) or two similar things that have crucial differences, yet turn out to have surprising commonalities (www.fas.havard.edu). The comparisons of financial performance among nonprofit organizations gained popularity in the 1960s and 1970s as the method to prevent publicized fundraising abuses. Since IRS Form 990 was required in the early 1940s, “the availability of IRS Form 990 and the accessibility of research datasets generated from these forms have
substantially increased the comparison of the finances of nonprofit organizations.” (Nonprofit Overhead Cost Project, 2004). Especially, through the investigation of 350 organizations, Froelich et al. (2000) compared “the adequacy, reliability, and appropriate interpretation” of IRS Form 990 with each organizations’ audited financial statements.
They concluded that IRS 990 Form has an adequacy and reliability for measuring financial performance of nonprofit organizations. Basically, IRS 990 form requires nonprofit organizations to report more detailed components of revenue and expenses than audited financial statements.
2.2.3 Financial Performance
Financial performance could be defined as a measure of how well a firm has used assets from its primary mode of business to generate profits. This term is also used as a general measure of a firm's overall financial health over a given period of time, and can be used to compare similar firms across the same industry or to compare industries or sectors in aggregation (Investopedia, 2008). A related explanation defines financial performance as the measure of the efficiency with which the firm uses various funds to generate a return to providers of the funds.
In evaluating financial performance of SACCOs, an important question is whether the traditional corporate goal of profit maximization holds. According to Branch and Baker (1998) profitability is not the primary concern for credit unions. However, the WOCCU report (2005) looked at profitability of credit unions from a different
perspective. It stated that credit unions sought to generate profits in order to directly benefit the owners as they (members) serve as both the owners of the credit union and the recipients of the credit union services. Thus when credit unions maximize their profits, it results in the form of lower interest rates on loans, lower service fees and higher dividends for the members.
In line with the WOCCU report (2005), Bauer (2007) stated that credit unions were financial cooperatives, organized to meet the needs of their members thus surpluses or profits were returned to members in the form of reinvestment in the credit union, dividends to members, or lower interest rates on loan products. Kyazze (2010) pointed out that low profitability in SACCOs was not due to governance issues but due to poor costing in order to make the loans attractive to the members, partly due to lack of know-how or relatively high operating costs.
2.2.4 Financial Analysis
Financial analysis (also referred to as financial statement analysis or accounting analysis or Analysis of finance) refers to an assessment of the viability, stability and profitability of a, business, sub-business or project. It is performed by professionals who prepare reports using ratios that make use of information taken from financial statements and other reports. These reports are usually presented to top management as one of their bases in making business decisions.
Continue or discontinue its main operation or part of its business; Make or purchase certain materials in the manufacture of its product; Acquire or rent/lease certain
machineries and equipment in the production of its goods; Issue stocks or negotiate for a bank loan to increase its working capital; Make decisions regarding investing or lending capital; Other decisions that allow management to make an informed selection on various alternatives in the conduct of its business.
2.3 Critical Review of Supporting Theories
Cornett et al. (1999) observes that analyzing financial statement using ratio analysis is one way of identifying weaknesses and problem areas of financial institution. They propose two approaches to financial statement analysis. The first approach is called time series analysis and it is used when the intention is to evaluate ratios of a financial institution over a period of time to tract down its performance over time. The second approach is called cross-sectional analysis and it is used when the intention is to compare the performance of a financial institution relative to that of competitor financial institutions at a particular point in time.
Ratio analysis is a frequently used tool in the evaluation of financial performance. Brigham and Ehrhardt (2005), commenting on analysis of financial statements, observe that financial statement analysis involves comparing the firm‟s performance with that of other firms in the same industry and evaluating trends in the firm‟s financial position overtime. They note that financial ratios provide a useful tool to evaluate financial statements and single out return on equity (ROE) as the most important accounting ratio.
Athanasoglou et al. (2005) used two measures to represent bank profitability: return on assets (ROA) and return on equity (ROE). They note that ROA reflects the ability
of a banks management to generate profits from bank‟s assets. On the other hand, ROE indicates the return to shareholders on their equity and equals ROA times the total assets-to-equity ratio. Further, they observe that banks with lower leverage (higher equity) will generally report higher ROA, but lower ROE.
They argue that since an analysis of ROE disregards the greater risks associated with high leverage, ROA emerges as the key ratio for the evaluation of bank profitability. An important qualification made by the authors is that both ROA and ROE are measured as running averages. This mean that in calculating these ratios, average value of assets (or equity) of two consecutive years and not the end-year values are used, since profits are a flow variable generated during the year.
Similarly, the explanatory variables that will be used in this study will be measured as running averages rather than end-year values to reflect the fact that performance is a flow variable generated during the year. Naceur (2003) proposes two measures of performance: the net interest margin (NIM) and the return on assets (ROA). The NIM variable is defined as the net interest income divided by total assets. He observes that NIM and ROA have been used in most banks performance studies.
ROA measures the profit earned per dollar of assets and reflect how well bank management use the bank‟s real investments resources to generate profit while NIM is focused on the profit earned on interest activities. Demirguc-Kunt et al. (1999) use net interest margin and before tax profit/total assets as measures of financial performance. Pandey (1999) gives the conventional corporate finance reason of why
firms must make profit. He defines profit as the difference between revenues and expenses over a period of time, usually one year. He asserts that a company should earn profits to survive and grow over a period of time. Further, Pandey notes that a firm must earn sufficient profits to sustain operations of the business to be able to obtain funds from investors for expansion and growth and to contribute towards the social overheads for the welfare of the society.
Fried et al. (1993) argue that since credit unions are owned and operated by members, the objectives of credit unions can be thought of as maximising benefits provided to members. They define benefits as the saving and loan services a credit union offers. This immediately suggests that profit maximization is not an appropriate objective. However, Fried et al. (1993) acknowledge that it is not appropriate to ignore the services offered by other financial intermediaries when developing a behavioural model for credit unions since they compete in many of the same markets.
Townsend (1995) propose five model specifications for credit union financial performance, starting with a purely profit based approach in line with conventional interpretation of corporate goal of profit maximization. Piesse and Townsend (1995) note that a credit union will be more efficient when minimizing operating expenses, raising non-retail funds cheaply, and earning high returns on non-retail investments. Moreover, for the case of Tanzania it is valid to note that members want to earn a dividend and how much dividends a SACCO can pay is a function of how well assets have been deployed to generate revenue, and how well cost elements have been
managed. Further, applying the profit maximization approach to modelling financial performance in SACCOs would not negate the principal of maximizing members benefit advanced by Fried et al. (1993). Since in this study the objective is to compare financial performance of Savings and Credit Cooperatives, two issues have to be addressed.
These are how to measure financial performance and then how to compare financial performance to variables posited to the comparison of performance. Traditionally, analysis of financial statements using ratio analysis is the most common method employed in measuring financial performance of business entities. For instance, Pandey (1999) notes that return on equity (ROE) ratio is one of the most important relationship in financial analysis.
Ogindo (2006) observes that profitability indicators such as return on equity (ROE) and return on assets (ROA) tend to summarize performance in all areas of the company. If portfolio quality is poor or efficiency is low, this will tend to be reflected in these ratios. Athanasoglou et al. (2005) uses both ROE and ROA to measure profitability. They observe that ROA reflects the ability of a bank‟s management to generate profits from banks assets while ROE indicates the return to shareholders on their equity and equals ROA times the total asset-to-equity ratio.
The latter is often referred to as the banks equity multiplier, which measures leverage. Naceur (2003) uses ROA and the net interest margin (NIM) as the measures of financial performance. Demirguc-Kunt et al. (1998) use net interest
margin (NIM) and the ratio of before tax profit to total asset as their measure of bank efficiency. Worthington (1999 & 2000), Brown et al (1999) and Berger (1995) use what is called Xefficiency, or deviations from the efficient frontier to measure the credit union efficiency. A method called ROE framework shows the relationship between the key financial ratios frequently used to measure performance of financial institutions (Cornet and Sanders, 1999).
Table 2.1 summarizes the role of ROE and the first two levels of the ROE framework in analyzing a financial institutions performance.
Table 2.1: Role of ROE, ROA, EM, PM, and AU in Analyzing Financial Institution Performance
Variable What it Measures
Return on Equity (ROE) Measures overall profitability of the FI per Tsh. of equity
Return on Assets (ROA) Measures profit generated relative to the FI‟s Asset Equity Multiplier (EM) Measures the extent to which assets of the FI are
funded with equity relative to debt
Profit Margin (PM) Measures the ability to pay expenses and generate net income from interest and non interest income Asset Utilization (AU) Measures the amount of interest and non interest
income generated per Tsh of total assets Source: Cornett and Sander, (1999)
Cornett et al. (1999) proposes two other profit measures. These are the spread and operating expenses efficiency. The spread measures the difference between the average yield of earning assets and average cost of interest bearing liabilities and is thus another measure of return on banks assets. The higher the spread, the more
profitable is the bank. Operating expenses efficiency measures the bank‟s ability to generate non-interest income to cover non-interest expenses.
2.4 Empirical Analysis of Relevant Studies 2.4.1 General Studies
Since 1990s, there have been several empirical studies that measured the financial performance of nonprofit organizations using various financial ratios. (Green and Griesinger 1996; Greenlee and Bukovinsky 1998; Siciliano 1996, 1997) Among many studies, Tuckman and Chang (1991) mentioned the unreliability of applying financial ratios derived from private sector to nonprofit organizations and developed financial ratios applicable to nonprofit organizations firstly.
They suggested four financial ratios to define whether a charitable nonprofit organization is financially vulnerable or not and applied the ratios to the sample organizations of 4,730 U.S charitable nonprofit organizations. The developed financial ratios are ‘Inadequate Equity Balances,’ ‘Revenue Concentration,’ ‘Low Administrative Costs,’ and ‘Low or Negative Operating Margins. Shinwoo Lee (2010) in the study “Comparative analysis of the financial performance of Non profit Organisations:
Focusing on the Franklin County Senior Activity Center” found out that the fiscal performance ratio has decreased from 1.41 to 1.18, while the public support ratio has increased from 0.94 to 0.99. This trend indicates that the gap between total revenues and expenses has decreased, and that the Center has increasingly depended on public
support. Second, the Franklin County Senior Activity Center has never spent its revenue on fundraising activity. The amount of fundraising expenses is zero every year during 2007 ~ 2009. This result shows that the Center does not pay attention to fundraising activities, or that the Center does not have any surplus for financing fundraising activities in its revenues.
2.4.2 Studies on African Countries
Sebhatu (2011) compared the financial performances ten SACCOs using total deposits, total credits, ROA, ROE, total assets (measures size of a SACCO), asset utilization ratio (measures asset management and is expressed as the ratio of operational income to total assets), and operating efficiency ratio (expressed as total operating expenses divided by average gross loan portfolio). The sample of his study contained all of the ten SACCOs.
His study employed both quantitative and qualitative data collected through primary and secondary sources. A descriptive financial analysis was used to describe, measure, compare, and classify the financial situations of SACCOs. Tables, percentages, financial ratios and bar graphs were used to interprete the data. The study area was located in the Southern part of Tigray state of Ethiopia.
Sabhatu (2011) found out that number of active members (with outstanding loan) rose in the period from 2007 to 2010 by 25.08% and the pull factor that attracted new members to join the SACCO was found out to be cost/or effort saving experienced by the earlier members from their affiliation, better output prices, lower input prices,
and dividends obtained from membership also contributed their own share in attracting new members. He also found that to rank the SACCO based on their average total deposits, Deremeit SACCO had the highest growth rate of deposits (15,798.75 Ethiopian Birr) based on 2007 as base year while the lowest was Weini SACCO with 2,997.25 Ethiopian Birr. Similarly, comparing the amount of credit disbursed by various SACCOs he found out that Weini was the lowest average credits growth rate (2,555 Birr) from 2010 to 2007 whereas Deremeit SACCO was the highest average of total credits (12,549 Birr). He concluded that member deposits growth in 2010 for all ten SACCOs has higher than the loan portfolio and the combined deposits of these SACCOs increased by 81.34% in 2010, while net credits rose by 61.52%.
Therefore, SACCOs in the study area have attained significant financial performance and outreach in a short period of time between 2007 and 2010, in terms of number of members, savings and volume of loan portfolio which increased by 20.58%, 81.34%, and 61.52% respectively.
2.3.3 Studies in Tanzania
Wingerden and Levelink (2012) in their study “Company assessment Rungwe Smallholder Tea Growers Association SACCO” found out that Net loans/Total assets (Loan to members ratio) was 86% above International standards for excellent performance (70-80%). This value was relatively high, it meant that most of the SACCOs’ capital was invested in loans, a too high value could cause liquidity problems. Savings deposits/Total assets ratio was 62 % below standards set by World
Council of Credit Unions (70-80 %). For the case of SACCOs, Capital is represented by members’ savings deposits (Njoroge, 2008).
Operating expenses/ Average assets (Operating expense ratio) rose to17% higher than International standards (≤ 5%) because the SACCO was in a period of growth and once the SACCO matures it is good to review this ratio. Development International Desjardins (2005) finds that Tanzania was the first country in Africa to have a National Associations of credit Union. This is the savings and credit union league of Tanganyika (SCULT) Ltd registered in 1964.
Tito (2005) finds that savings and credit cooperatives societies (SACCOs) sectors in Tanzania is still low and their formation being strong in Urban areas and cash crops growing areas. Areas producing food crops still experiencing low formation of savings and credit cooperatives societies (SACCOs). Chao-Beroff et al (2000), noted that loans granted by savings and credit cooperatives societies (SACCOs) in Tanzania were very few with further characterized by low level of diversified investments.
The study carried out by Agrisystems (2003) finds that the rural financial services program (RFSP) established in 1999 in Tanzania, has targeted rural poor house holders in Tanzania which are farm house holders non-farm house holds, community based organizations (CBO), Rotating Savings and Credit Associations (ROSCAs) and Solidarity groups. Other important source of financing for crisis risks in some areas is commercial money lenders.
They normally extend short-term loans ranging between 5% to 30% a month. The loans are usually used for paying school fees, medical expenses and hiring labor for harvesting. Most reports (Rutherford, 1999, Lwoga, 1999, Mugwanga 1999 and Mutesasira, 1999a) suggest that there are very few moneylenders in Tanzania. However, Bagachwa (1995) suggests otherwise noting that, ‘The relatively low profile allegedly assumed by moneylenders in channeling credit could be a camouflage, reflecting in part the traditional view that commercial lending is exploitative...Given the rather hostile environment… most moneylenders do not admit to engaging in this practice.
Therefore, their number and their roles tend to be underestimated’’. In spite of its limitations and sometimes significant disadvantages, the informal sector plays a significant role in financing crisis risk situations. The vibrancy of the informal sector reflects its responsiveness to client’s management requirements. These include easily understood procedures, flexible lending arrangements, the absence of restrictions on how loans are used, credit at short notice, limited or no paper work, proximity to borrower and local adaptability.
Finally, informal financial institutions face relatively low transactions costs. Due to strong local knowledge and social pressure, there are extremely low costs for assessing the borrower’s creditworthiness and collecting loans, (Bagachwa 1996, Rutherford 1999, mutesasira 1999a). East African banks and MFIs need go beyond the limited group-based micro-enterprise credit. They need to develop and pilot test new products and strengthen their product development capacity to produce micro
financial services that meet clients needs and from which the MFIs can levy charges that permit sustainability and profitability. In addition this will enable MFIs to increase the breadth and of their outreach. .Those that does will be taking a risk: those that do not will be history (Hulme, 1999; Maximbali, 1999; Kagashaki, 1999; Mugwanga, 1999).
2.5 Research Gaps
Improvement in the financial performance of SACCOs in Tanzania would have far reaching positive economic consequences on the Tanzania’s economy at large, and the savings and credit movement in particular. Despite the fact that there are benefits to be gained from a clear understanding of the comparative analysis of financial performance of saving and credit unions in Tanzania, there are no studies in Tanzania covering this subject.
Comparative analysis of financial performance focusing on SACCOs have been done outside Tanzania. These studies include researches done by Shinwoo Lee, (2010); Green and Griesinger, (1996); Greenlee and Bukovinsky, (1998); and Siciliano, (1996) in USA; Alfed Okwee, (2011); Kifle Tesfamariam Sebhatu, (2011) in Uganda and Ethiopia respectively; Duncan and Elliot, (2004) in Australia The purpose of this study on Comparative analysis of financial performance of Employee and Community based SACCOs operating in Kisarawe district is to cover this gap.
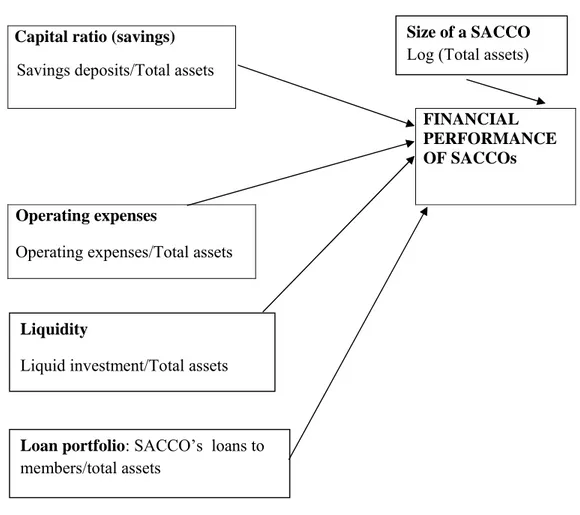
The conceptual framework in this study explains how the researcher conceptualised comparative analysis of the financial performance of SACCOs in Kisarawe district, showing the variables and relationships involved and the probable strategies for
solving the problem.The researcher calculated five alternative measures of financial performance:
2.6 Analytical / Conceptual Framework
Figure 2.1: Conceptual Framework
Source: Adopted from Sebhatu, (2011); Njoroge, (2008)
2.6.1 Size of a SACCO
In most of finance literature, the total assets of the bank are taken as a proxy for bank size. However, since the other variables in the study are normally deflated by total assets, it is common practice to log total assets before including it in the model.
Capital ratio (savings) Savings deposits/Total assets
FINANCIAL PERFORMANCE OF SACCOs
Operating expenses
Operating expenses/Total assets
Liquidity
Liquid investment/Total assets
Loan portfolio: SACCO’s loans to members/total assets
Size of a SACCO Log (Total assets)
Naceur (2003) in his study of the determinants of the Tunisian banking industry profitability uses size of a SACCO, operating expenses, capital, bank’s loans to total assets ratios, and the ratio of non interest bearing assets.
The current study will include four of the variables utilized by Naceur (2003) that is size of a SACCO, operating expenses, capital and SACCO’ loans to total assets rarios to compare the financial performance between E-SACCO and C-SACCO operating in Kisarawe district. Size of a SACCO was introduced as the log of total assets, in the same way as used by Naceur (2003). Size of a SACCO accounts for existing economies or diseconomies of scale. The bigger the size of a SACCO the more efficient the economies of scale as found out by Akhavein et al. (1997), Smirlock (1985), and Njoroge (2008).
2.6.2 Capital Ratio
Capital ratio is measured as the ratio of savings deposits to total assets.Capital is represented by members’savings for the case of SACCOs (Njoroge, 2008). Deposits in SACCOs are non volatile and can be only withdrawn from the society upon member’s resigning or demise. A SACCO with a sound capital position is able to pursue business opportunities more effectively and is more flexible to deal with problems arising from unexpected losses, thus achieving increased profitability.
Ben Naceur (2003) point that well-capitalised businesss support lower expected bankruptcy costs, which reduce their cost of capital. Sum of member’ shares and deposits for each SACCO were calculated and thereafter capital ratio was computed.
The researcher then compared financial perfomance between Employee based and Community based SACCOs using the calculated capital ratios. The SACCO group with higher capital ratio was better performing financially than the other SACCO group.
2.6.3 Operating Expenses Ratio
Operating expenses ratio is measured by operating expenses divided by total assets. The total costs of a financial institution (net of interest payments) can be separated into operating costs and other expenses(including taxes, depreciation etc.). This study focus on operating expenses because this is the component at the discretion of the management. Impoved management of these expenses will increase efficiency and therefore raise financial performance.
Operating expense ratio was calculated and similarly the researcher then compared financial perfomance between Employee based and Community based SACCOs using the calculated capital ratios. The SACCO group with lower operating expense ratio was better performing financially than the other SACCO group.
2.6.4 Loan Portfolio Ratio
Loan to members is expressed as the ratio of SACCO’s loans to members to total assets. The World Council of Credit Unions (Richardson, 2002) asserts that loan portfolio is the most profitable asset of the credit union. This points to the need to convert as much as possible of SACCO’s assets into loans to members. Similarly, the researcher calculated this ratio for each SACCO and then compared financial perfomance between Employee based and Community based SACCOs using the
calculated capital ratios. The SACCO group with higher loan portfolio ratio was better performing financially than the other SACCO group.
2.6.5 Liquidity Ratio
Liquidity ratio is expressed as the ratio of cash & near cash assets to total assets. Excess liquidity is discouraged because the margins on liquid investments are significantly lower than those earned on the loan portfolio. As Richardson (2002) notes, liquidity reserves are important but they also imply opportunity cost. Funds in checking accounts and simple savings accounts earn negligible returns, in comparison with other investment alternatives.
Liquidity in SACCOs is the cash available to lend; it is the working capital that make a SACCO able to fulfil its core business of lending to its members. Similarly, the researcher calculated this ratio for each SACCO and then compared financial perfomance between Employee based and Community based SACCOs using the calculated liquidity ratios. The SACCO group with higher liquidity ratio will be better performing financially than the other SACCO group. In order to compute the above five ratios for each SACCO the following measures should be obtained from secondary sources:
(i) Total assets
(ii) Total capital/Equity (Sum of members shares and deposits) (iii) Value of loan outstanding (volume of loan portfolio) (iv) Operating expenses
CHAPTER THREE
3.0 RESERCH METHODOLOGY 3.1 Introduction
This chapter contains research strategies, survey population, area of the research, sampling design and procedures; variables and measurement procedures, methods of data collection, and data processing. The research strategies explains the use of secondary data, survey population was composed of the 8 SACCOs operating in Kisarawe district, area of research consisted of 4 wards of Kisarawe district, sampling design is not applicable in this study.
All 8 SACCOs were used, variables and measurements were the five ratios with their five measurements, methods of data collection consisted of both quantitative and qualitative data which were collected through secondary sources, and data proccessing employed statistical analysis Microsoft Excel spead sheets for windows. 3.2 Research Strategies
This study compared financial performance of employee-based and community-based SACCOs by looking at data covering the period 2008-2011. This involved the use of secondary data which is a data set containing observations on multiple variables observed over multiple time periods. It allows the evaluation of performance indicators over a period of time. The researcher used secondary data model that was analytical and descriptive to understand the relationship amongst the study variables because the performance of SACCOs in Kisarawe district had come under the spot light only recently. This was appropriate because the study involved SACCO performance comparison at a point in time.
3.2.1 Survey Population
The population of interest in this study consisted of all SACCOs in Kisarawe district. According Department of Cooperatives Annual report (2012), there were 8 SACCOs in Kisarawe district that were registered with Registrar of Cooperatives by December 31st 2012 which are KITESCO Ltd. (Teachers society), Kisarawe SACCO (District council workers), and Kibasila SACCO (Armed Forces SACCOs) in Employee-based group.
TDK, TUNDA, Maneromango, Homboza, and Mzenga SACCOs are in Community-based group. The basic units of analysis were SACCOs, and the main focus of this study was the Employee- based and Community-based SACCOs. Specifically, the financial performance of the Employee-based SACCOs were compared with that Community-based SACCOs. Basically, as Finkler (2004) said, financial comparison should be conducted among the organizations that have similarities in mission, size and budget.
Thus, to compare financial performance of the Employee-based SACCOs with Community-based SACCOs, this study selected Community-based SACCOs that have similarities in mission, size and budget. The reasons for limiting the study in Kisarawe district were twofold. The first reason was limitation in resources and time that was allocated for this study. The second reason was related to the need to control for variations in local conditions and hence the decision to sample from a population drawn from same environment.
Such variations are recognised in the literature as affecting the performance of financial intermediaries (Brown et al., 1999). Moreover, Worthington (1998) notes,
“efficiency measures themselves are extremely sensitive to residual differences in geographic and institutional characteristics‟.
3.2.2 Area of the Research or Survey
Coast Region was established in 1972 as one of the regions across the Indian Ocean. It measures approximately about 33,539 sq. km. It is divided into six districts namely, Bagamoyo, Kisarawe, Kibaha, Rufiji, Mkuranga and Mafia. It also has 25 divisions, 81 wards and 417 villages. The area of research was in four wards of Kisarawe district which were Kisarawe (KITESCO Ltd., Kisarawe SACCO, Kibasila SACCO, TDK, and TUNDA), Maneromango, Homboza and Mzenga wards.
3.3 Sampling Design and Procedure
The basic structure of the research design was comparative analysis. This study measured the financial performance of each SACCO, and compared the results with others’. As Finkler (2004) said, comparisons in financial performance can be made with the industry, other organizations or with an organization’s own data over a 3 to 5 year period. Thus, this study measured the financial performance of each SACCO yearly from 2008 to 2011 and compared its average and trend.
3.3.1 The Sample Frame
The sample frame was constructed using a list of SACCOs provided by Department of Cooperatives, Kisarawe district council department which registers all SACCOs in the district. The main objectives of the department of cooperatives are to promote the development of viable SACCOs, disseminating information concerning SACCOs and coordinate their operating methods and practices to maintain basic uniformity.
3.3.2 The Sample Size and Sampling Design
There was no sampling of SACCOs for this study, since the researcher used all the eight SACCOs available in the whole district.
3.4 Variables and Measurement Procedures
Variables and measurements of financial performance in this study were: (i) Size of a SACCO measured by log (total assets)
(ii) Capital ratio measured by the ratio of savings deposits to total assets
(iii) Liquidity measured by the ratio of liquid investment to total asset (in this case liquid investment is the cash at hand and cash held in savings and current accounts),
(iv) Operating expenses ratio measured by operating expenses divided by total assets.
(v) Loan to members ratio measured by the ratio of SACCO’s loan to total assets
Measurements of financial performance in this study (Capital, liquidity etc.) were not adjusted for subsidies since SACCOs in this study did not receive subsidies, also not be adjusted for inflation, loan loss provision and exchange rate difference.
3.5 Methods of Data Collection
Secondary data were used in this study and only audited financial statements for individual SACCOs for the period 2008-2011 were used. Secondary data included among others annual SACCOs’reports to determine the various ratios. Financial ratios were computed from the financial reports. The secondary data were collected
from the department of Cooperatives of the Kisarawe district council headquarters; from all 8 registered SACCOs’annual reports and collected also from literature review on SACCOs to determine the various ratios. All registered SACCOs at Kisarawe district council are required by law to file annual returns with the Department head of cooperatives which include a set of financial statements among others. Specially designed data filling sheets (see Appendices) were used to collect relevant data from the audited financial reports and then were digitized by entering it into Microsoft Excel speadsheets for windows. This study used a descriptive financial analysis to describe, measure, compare, and classify the financial situations of the SACCOs.
Tables, percentages, and financial ratios were used to interprete the data. The researcher also tried to complete data insufficiency and information gaps through interview and personal discussions. Since this study employed both quantitative and qualitative data that were collected through secondary sources the data included literature review on SACCOs, review of financial reports of the SACCOs, and discussions with key informants including staff of Department of Cooperatives of the Kisarawe district council and Management committee of the sample SACCOs to have mere information about the problems of the credit unions with respect to financial performance.
3.6 Data processing and Analysis
The collected raw data both quantitative and qualitative were processed and analyzed using Microsoft Excel spreadsheets for windows. Quantitative data needed to be
processed to make them useful to turn them into information. In this study tables and inferential statistics were used to explore, present, describe, and examine relationships and trends within the data. The quantitative data in this study were numerical data. Simple tables that show the variables of Financial performance; Size of a SACCO, Capital ratio, liquidity ratio, operating expenses ratio, and loan to members ratio, were created. The Table 3.1 is an example.
Table 3.1: Financial Performance Variables Against Measurements
Financial Performance Variables Measurements Size of a SACCO Log (Total Assets)
Capital ratio Member’s savings deposits/Total assets Liquidity ratio Ratio of liquid investment to total assets Loan to members SACCO’loan divided by total assets Operating expenses ratio Operating expenses divided by total assets Source: Field Data
Then statistics of the measurements were used to enable establishing statistical relationships between variables. Data were analyzed by using personal-computer-based analysis software, Excel spreadsheets rather than analyzing by hand or calculator number-crunching which is time consuming and prone to error. Type of data in this study such as Size of a SACCO, Capital ratio, liquidity, loan to members, and operating expenses were categorical and descriptive since they were classified into categories according to the characteristics that describe the financial performance variable and these data simply gave the numerical data in each category of a variable.
These data were entered in a data matrix into analysis software so that to save them in a format that can be read by other software. Within a data matrix, each column represented a separate financial performance measure (e.g. Loan to members, Capital etc) for which the data have been obtained. Each matrix row contained the financial performance measures for an individual year that is an individual unit for which data have been obtained.
Key financial ratios of Employee-based SACCOs were compared to those of similar Community based SACCOs in select sectors, using data reported in the credi unions’ annual reports over the 4-year period, 2008 through 2011. The data for the research included a sample of 8 SACCOs in Kisarawe district. Listed below is the sectoral mix of credit unions:
(i) 3 Employee based SACCOs (ii) 5 Community based SACCOs
Financial statements of SACCOs were provided by the Department of cooperatives of the Kisarawe district council. Financial ratios were calculated from their qualified annual reports for the period 2008-2011. For each observation year, the aggregates of two variables comprising each ratio were calculated; then these aggregates were used to compute the ratios for each year for each sector. For example, the capital ratio for Employee based SACCOs was calculated by adding the savings deposits of all three SACCOs in the sector and dividing this sum by the sum of total assets for these three SACCOs. Hence, 10 time series (Five ratios for each sector) of 4 aggregated ratio observations were derived. Financial data for comparable Community based SACCO
were also obtained in the same way. The data for the individual SACCOs were aggregated similarly to maintain their comparability. This aggregation method effectively weighted the sample by SACCO size. Financial ratios were calculated from these aggregate financial variables for Community- based SACCOs, to match the ratios calculated for the Employee-based SACCOs.
Community-based SACCOs with operations comparable to Employee-based SACCOs were represented by the following credit unions:
(i) TKD (Businessmen society) (ii) TUNDA (Society of entrepreneurs)
(iii) Maneromango SACCO (Residents SACCO) (iv) Homboza SACCO (Residents SACCO) (v) Mzenga SACCO (Residents SACCO)
In addition to being comparable in operations, the Community-based SACCOs were comparable to the Employee-based SACCOs with respect to their average total assets.
CHAPTER FOUR
4.0 DATA PRESENTATION, ANALYSIS AND INTERPRETATION
4.1 Introduction
This chapter presents the findings obtained from secondary data. The findings are a result of application of statistical tools and techniques among which include financial ratios, sums and means summarized in form of tables used to analyze study variables. The study variables were Size of a SACCO (Log total assets), Volume of loan portfolio (Loan to members ratio), Liquid investment (Liquidity ratio), capitalization (Capital ratio) and Operating expenses (Operating expenses ratio).
This chapter is directly concerned with answering the three specific research questions. The researcher was interested in establishing at what percentages do Employee-based SACCOs and Community-based SACCOs measure their financial performance, whether there is any difference in percentages of the financial performance measures between the two SACCOs in terms of size of a SACCO, capital, liquidity, loan to members, and operating expenses ratios, and does E-SACCOs perform better financially than C-E-SACCOs in terms of size of a SACCO, capital, liquidity, loan to members, and operating expenses ratios.
This was believed to be a basis of conducting comparative analysis of financial performance between Employee-based SACCOs and Community-based SACCOs operating in Kisarawe district.
4.2 Financial Performance Measures of E-SACCOs and C-SACCOs 4.2.1 Size of a SACCO
Size of a SACCO is measured by log (total assets). Since the other variables in the study are normally deflated by total assets, it is common practice to log total assets before including it in the model. Table 4.1 summarises the log of total assets of Employment-based (E) SACCOs and Community-based (C) SACCOs. Findings reveales that the value of log total assets of E-SACCOs and C-SACCOs are 8.231632604 or average total assets of Tshs. 326754629.00 and 7.114271169 or average total assets of Tshs. 14840235.40.
Sizes within E-SACCOs consist of KITESCO Ltd (Teachers society) with log total assets of 8.9025 or average total assets of Tshs. 798890260.00, Kisarawe SACCOs (District council workers) with log total assets of 8.1325 or average total assets of Tshs. 135673777.00 and Kibasila SACCOs (Armed forces SACCOs) with log total assets of 7.6599 or average total assets of Tshs.45699849.50. In the group of C-SACCOs there are TDK C-SACCOs with log(total assets)=7.4438 or Tshs.27783601.20.
Maneromango SACCOs with log(total assets)=7.2138 or Tshs. 16361996.60, Homboza SACCOs with log(total assets)=7.1620 or Tshs. 14521250.90, Mzenga SACCOs with log(total assets)=6.9883 or Tshs. 9734559.77 and TUNDA SACCOs with log(total assets)=6.7634 or Tshs. 5799768.60.
4.2.2 Capitalization
Capital ratio is measured by the ratio of savings deposits to total assets. Table 5 summarizes capital ratios of E-SACCOs and C-SACCOs.