ANOMALY BASED INTRUSION DETECTION SYSTEM WHICH ANALYZE
THE DATASET AND DETECT INTRUSION
MUHAMMAD HAMZA AZIZ1, ASGHAR ALI SHAH*2 1Department of Computer Sciences, Bahria University, Lahore, Pakistan
mhamzaaziz1@gmail.com
ABSTRACT: As the research increased in computer science highlight the scientists mind for the growing research world towards security. Researchers have done a lot of research work in network Security. Cybersecurity has progressively become a zone of alarm for officials, Government agencies and industries, including big commercialized infrastructure, are under attack daily. First signature-based intrusion detection systems were developed, and it detects only novel attacks. To detect strange attacks statistical IDS came into being recognized as anomaly-based IDS. It is not as much efficient as it detects all. In this, study the author focus on the efficiency of IDS using NSL-KDD99 dataset and support vector machine (SVM) technique to identify attacks. NSL-KDD dataset is used for the evaluation of these type of systems.
Keywords: Anomaly Based IDS, SMO, Poly kernel, Normalized poly kernel RBF kernel, support vector machine, Decision tree, J48.
1. Introduction. An IDS [1] is employed to differentiate every kind of nasty link traffic and device use that cannot be identified traditional firewall. This embrace network attacks in contradiction of susceptible facilities, data driven attacks on products, host-based attacks such as permission increase, unlicensed logins and entrée to sensitive data, and nasty files (i.e. viruses, Trojans, and worms). IDS classification is done in many ways.
Network Intrusion Detection System acknowledge intrusions by investigating network traffics data and inspecting hosts data. Network IDS get permission to networks traffic by joining to a hub, network switch organized for port mirroring, or network faucet. An exemplar of a Network IDS is Snort.
Host-based IDS involves the working of an agent on a host machine which distinguishes intrusions by inspecting system calls, application log files, file-system variations (binaries, password files, capability/Access Control List databases) and other host activities and situations.
Hybrid IDS syndicates one or more methods. Host data is united with network info to create a comprehensive view of the system. A model of a HIDS is Prelude. Recognition is done by two ways:
Signature Based Detection method is specifically used for known patterns/novel attacks to detect nasty code. These specific patterns are termed as signatures. Detecting the worms in the network is an example of signature-based detection. These intrusions are said to be as misuse.
Anomaly Based Detection methods are Designed to distinguish abnormal behavior in the system to normal behavior. The ordinary usage is base lined, and signals or messages are created when someone diverges from the standard behavior.
i. Need for Intrusion Detection System
Confidentiality is the main concern from individual to corporate sector. If these problems are not solved, businesses will not be in a better position to truly take advantage of all. Like, Sony Pictures Entertainment [2] experienced one of the most distressing commercial attacks in history in the history of mankind. Thousands of records, grabbed by hackers and were revealed online with personal details of around 6,000 Sony employees, forthcoming Sony feature films and the pay details of top management. The hackers also achieved to retrieve details about Deloitte financiers who are Sony’s auditors. The foremost data breach, which happened on 24th November, caused in the halt of the whole computer network of one of Hollywood’s prime and most authoritative studios. Here have been collective reports that the hacking was carried out by North Korea in payback for the future release of a Sony comedy movie called “The Interview”. The storyline tracks Seth Rogan and James Franco who are working in the CIA (Central Intelligence Agency) to eliminate Kim Jong-un the dictator of North Korea.
Industrial thinktanks guesstimate that almost 60,000 new, nasty computer programs and 315,000 new, nasty files are discovered daily. From 2006 to 2012, the number of security happenings stated by federal agencies amplified from 5,503 to 48,562 – a rise of 78.2%– and in 2013 McAfee investigation estimated that worldwide cybercrime VAWKUM Transactions on Computer Sciences
http://vfast.org/journals/index.php/VTCS@ 2019, ISSN(e):2308-8168, ISSN(p): 2411-6335
failures might total $400 billion. Cyber-attacks are a risk to America’s nationwide and financial security, in addition to separate privacy, and to the fundamental and most important factor, corporate strategies, and knowledgeable property for tom, dick and harry [3].The dawn of cloud computing, though, has taken new applicability to IDS structures, resulting in a flow in the IDSmarketplace. A vital element of today’s security top preparations, Intrusion Detection Systems are created to sense attacks that can happen, regardless of preventive procedures. In fact, Intrusion Detection System is today’s unique top selling security equipment and it is predicted to remain to increase impetus. Destinationtinationpite everything, cloud security is far too multifaceted to be checked physically. The logic and waya Intrusion Detection System usages is very related to these days technology. Through cloud computing, Intrusion Detection System has creäted a world where it can flourish and be most operative. By means of cloud computing, the fundament has engrossed with the Intrusion Detection technology.
This study deals with anomaly-based intrusion detection system. It uses support vector machine different kernels for better model evaluation so, efficiency increases.
ii. SVM
SVM is the leading recognized algorithm for binary classification. It uses statistical learning method for classification and regression by using different kernel functions. Its applications include a wide range of pattern recognition applications and now it’s also popular in networks security due to good generality nature and to overcome the curse of dimensionality. The SVM select the appropriate parameters for model evaluation.
iii. Limitations of SVM: SVM is a supervised learning model required labelled data for learning. It is Destinationtinationigned for Binary classification nut IDS formation is a multi-class classification [4]. Another issue is Training of Support Vector Machine (SVM) [5] is a time-consuming process and required a huge dataset. Thus, it is computationally costly, and resource restricted for informal networks, which increase the architecture complexity and decrease accuracy [6].
While information in dataset isn’t labelled, supervised learning isn’t attainable, an associate degreed an unsupervised learning method is needed, that tries to seek out traditional clustering of the information to groups, so map new information to those fashioned teams. The clustering rule that makes associate degree improvement to the support vector machines is named support vector clustering [7]. It’s a hybrid variety of clustering that mix clustering with support vector machine.
To resolve this issue NSL-KDD binary dataset is used where data is divided into normal or Anomaly only.
2. LITERATURE REVIEW. Computer world is growing explosively. Computer System suffer security vulnerabilities that are technical difficult and end economically costly. On KDD test set there is a classification rate of 86% to nearly 100%.
NSL-KDD is formed by using KDD99 dataset. NSL-KDD is openly accessible for students and scientists. Although, the info set still suffers from many glitches mentioned in paper by McHugh [8] and Its won’t be a perfect demonstration of existing actual networks, due to shortage of knowledge in dataset available publicly for network-based IDSs, it tends to have faith in it because it still often practical as an efficient benchmark knowledge driven to assist data scientist to compete completely different intrusion detection strategies. There square measure some issues within the KDD knowledge set that cause the analysis results on this knowledge set to be dishonest. That square measure mentioned below: One of the foremost vital insufficiency within the KDD dataset is that the immense variety of duplicate records, that causes the training algorithms to be prejudiced to the redundant data records, and so stop learning uncommon data typically malicious to networks like User to Root and Remote to Local attacks. additionally, presence of those frequent data within the test dataset can cause the assessment results to be biased by the strategies that have higher detection rates on the repeated records [9].Problem is solved by using two prior approaches, that are discussed below. Before solution first take away whole redundant data from training and test datasets. moreover, make a tougher set from KDD dataset, then we have a tendency to willy-nilly sampled data records from the successful prediction price teams, In such, how numeral of records chosen after every cluster is reciprocally proportional to the proportion of records within the original successful prediction price teams. for example, the quantity of records within the successful prediction price cluster of the KDD toy constitutes zero.04% of the initial records, therefore, 99.96% of the records during this cluster square measure enclosed within the generated sample. The generated knowledge sets, square measure KDDTrain+ and KDDTest+. Dataset social control is important to boost the efficiency of IDS once datasets square measure is big. Hence, technique used is Min-Max technique of social control.Features will be selected based on information gain. It is calculated as Let [10] D be a group of training set with their match up labels. Imagine there are m categories and the training set has Di category I and D are that the total variety of samples within the preparation set. predictable data required to classify a sample, it is computed as:
A [10] named feature will split the training set into v subsets wherever Dj is that the set that has the worth Aj for feature A. Moreover, let Dj contain Dij samples for category i. Entropy of the feature D is calculated as:
Information gain for A is calculated as:
( ) = + ⋯ + ∗ , … . ,
The dependency magnitude relation [11] is solely calculated therefore
= −
Where
H V = highest variety of occurrence variation for a category label in attribute A. T I = total variety of occurrences of that category within the dataset.
O T = variety of occurrences for different category labels supported a or a group of Variations. T O = total variety of instances of category/class labels within the dataset creating OT. It helps to pick out options by high worth to low worth and so they're evaluated.
Rule induction is [12] one in all the chief varieties of data processing and is probably the foremost common variety of information discovery in unsupervised learning systems. Rule induction is a vast responsibility wherever all doable patterns are completely force out of the information and so Associate in Nursing correctness and worth are accessorial to them that tell the user how powerful the pattern is? and the probability it can happen another time.
For the how much the rule to be helpful there must be two things that provide a great information [13]. Accuracy– however typically is that the rule corrects? Coverage–however typically will the rule apply?
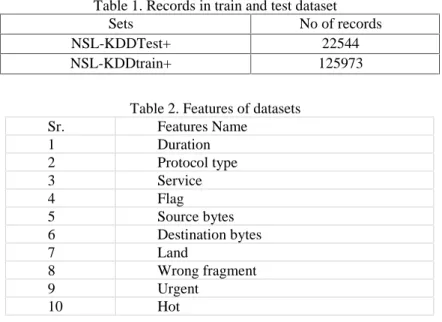
3. NSL-KDD DATASET. The dataset employed in the study is NSL-KDD. NSL-KDD could be a dataset counseled to resolve a number of the characteristic issues of the KDD'99 dataset [13]. Although, this new sort of the KDD information set still suffers from a number of the issues and won't be an ideal demonstration of current real networks, attributable to the deficiency of public datasets for network-based Intrusion Detection Systems, it still is sensible as a good benchmark dataset to assist researchers to compare completely different intrusion detection ways. Moreover, the quantity of records within the NSL-KDD train and test set are affordable. As detail are in table 1. This advantage makes it cheap to run the experiments on the whole set while not the requirement to arbitrarily choose a little portion. Therefore, analysis results of various analysis work are reliable and comparable. Features are Destinationtinationcribed in table 2.
Table 1. Records in train and test dataset
Sets No of records
NSL-KDDTest+ 22544
NSL-KDDtrain+ 125973
Table 2. Features of datasets
Sr. Features Name 1 Duration 2 Protocol type 3 Service 4 Flag 5 Source bytes 6 Destination bytes 7 Land 8 Wrong fragment 9 Urgent 10 Hot ….. eq (2) ….. eq (3)
11 Failed logins 12 Logged in 13 Num compromised 14 Root shell 15 Su attempted 16 Num root
17 Num file creations
18 Num shells
19 Num access files
20 Num outbound cmds 21 Is host login 22 Is guest login 23 Count 24 Srv count 25 Serror rate 26 Srv serror rate 27 Rerror rate 28 Srv rerror rate 29 Same srv rate 30 Diff srv rate
31 Srv diff host rate
32 Dst host count
33 Dst host srv count
34 Dst host same srv rate
35 Dst host diff srv rate
36 Dst host same source port rate 37 Dst host srv diff host rate
38 Dst host serror rate
39 Dst host srv serror rate
40 Dst host rerror rate
41 Dst host srv rerror rate
42 Labels
4. PURPOSED WORKING OF ANOMALY BASED IDS. Anomaly based refer to the statistical measure of system features. For this NSL-KDD dataset is used.
In general, Anomaly based detection involves following steps Pre-processing
It an important step in data mining process. It converts the raw into understandable format. There it required a training dataset for the learning of IDS. It contains 41 features.
Feature Selection
In machine learning it is a procedure of choosing a subset of pertinent features/attributes used to create model. For specific results we need relevant features. Feature selection methods are adopted for following motives
O
versimplification of model so it become easy to understand.
S
horter training time.
T
o avoid curse of dimensionality.
E
nhance generalization by reducing over fitting.
Feature are selected using Cfs Subset Evaluation with Genetic Search algorithms. Attributes are selected using percentage folds. Results are in table 3 and features are selected in table 4.
number of folds (%) attribute 1( 10 %) 1 duration 0( 0 %) 2 protocol type 5( 50 %) 3 service 8( 80 %) 4 flag 10(100 %) 5 source bytes 10(100 %) 6 dst bytes 3( 30 %) 7 land 2( 20 %) 8 wrong fragment 0( 0 %) 9 urgent 0( 0 %) 10 hot
0( 0 %) 11 num failed logins 10(100 %) 12 logged in 1( 10 %) 13 num compromised 1( 10 %) 14 root shell
0( 0 %) 15 su attempted 0( 0 %) 16 num root
0( 0 %) 17 num file creations 3( 30 %) 18 num shells 3( 30 %) 19 num access files 0( 0 %) 20 num outbound cmds 0( 0 %) 21 is host login 3( 30 %) 22 is guest login 3( 30 %) 23 count 0( 0 %) 24 srv count 7( 70 %) 25 serror rate 7( 70 %) 26 srv serror rate 2( 20 %) 27 rerror rate 1( 10 %) 28 srv rerror rate 10(100 %) 29 same srv rate 7( 70 %) 30 diff srv rate 8( 80 %) 31 srv diff host rate 4( 40 %) 32 dst host count 3( 30 %) 33 dst host srv count 4( 40 %) 34 dst host same srv rate 0( 0 %) 35 dst host diff srv rate
2( 20 %) 36 dst host same source port rate 4( 40 %) 37 dst host srv diff host rate 5( 50 %) 38 dst host serror rate 7( 70 %) 39 dst host srv serror rate 0( 0 %) 40 dst host rerror rate 2( 20 %) 41 dst host srv rerror rate
Table 4. Feature selected based on fold percentage
No of fold
percentage
Features selected No of features
100 5,6,12,29 4
>50 3,4,5,6,12,25,29,30,31,34,38,39 12
25,26,27,28,29,30,31,32,33,34,36,37, 38,39,41
Figure 1. Features selected based upon percentage fold
Parameter Optimization
It is a process of choosing optimal parameter for learning algorithms. This measure is known as hyperparameter and resultant model solve problem optimally.
Classification
Classification is a process of arrangement of optimized parameters so that useful information can extract in data. It assigns items in a collection to categories or classes. It results in the formation of a model. In machine learning, modelling SVM is supervised learning model it uses linked learning algorithms that examine facts used for classification or regression study[15]. SVM method is a classification method founded on SLT (Statistical Learning Theory). The goal of SVM is to find a linear optimal hyper plane so that the boundary of split-up between the two classes is increased. An intensive study is carried out in [16] which declared that SVM is mostly used machine learning technique for classification. Models are developed using SMO. Sequential minimal optimization (SMO) is a process for elucidation the quadratic programming (QP) problem that rises during the learning of support vector machines. Following kernels are to be used.
Poly kernel is said to be polynomial kernel [17]. It finds the similarities not only between features but also among there subsets. Polynomial kernel is calculations are computed as:
( , ) = ( + )
In this,
x and y = vectors in vector space
c= effect of higher degree order term vs lower degree term. C always greater than 0. If c=0 then kernel is said to be homogenous.
Normalized poly kernel is the refined form of Polynomial kernel [18]. First data is normalized and then processed. It is defined as:
( , ) = ( , )
( , ) ( , )
RBF kernel is said to be radial basis function kernel [19]. Normally, it is used in SVM. It is defined as:
( , ) = e x p − eq (6)
Where‖ − ‖ is square Euclidean distance
Evaluation: Model will be evaluated on the bases of confusion matrix. Multiple scores are measured such as: accuracy, precision, recall, F-measure by performance of 10-fold cross-validation[20].
4 12 29 0 10 20 30 40 100 >50 >0
Features Selection
No of features ….. eq (4) ….. eq (5)5. Result.
This proposed study of IDS is tested by using WEKA (Waikato Environment for knowledge Analysis). The dataset NSL-KDD has advantages over KDD99 due to Removal of redundant records and affordability for use in experimental purpose. Classification results are based on features selected in table 4 NSL_KDD 20%. The cross-validation folds are set to 10.
No of fold percentage No of feature Accuracy Precision Recall F-measure
100 % 4 0.863 4 0. 81 9 0.955 0.882 >50 12 0.963 9 0. 96 4 0.968 0.966 >0 29 0.973 7 0. 96 6 0.986 0.976
Figure 2. Poly kernel Evaluation results.
As by table 4 and figure 2 the number of features increase in poly kernel, the accuracy increases to some extent but not so much because slop of efficiency deceases.
Table 6. Normalized poly kernel No of fold
percentage
No of features Accuracy Precision Recall F-measure
100 % 4 0.8284 0.959 0.709 0.815 >50 12 0.9689 0.965 0.978 0.971 >0 29 0.9813 0.975 0.99 0.983 4 12 29 86. 34 96. 39 97. 37 81. 9 95.5 96.4 96.8 96.6 98.6 88. 2 96. 6 97. 6 1 0 0 % > 5 0 > 0
POLY KERNEL
No of features Accuracy Precision Recall F-measure 4 12 29 82. 84 95.9 96.89 96.5 98.13 97.5 70. 9 97.8 99 81. 5 97.1 98.3 1 0 0 % > 5 0 > 0
NORMALIZED POLY KERNEL
No of features Accuracy Precision Recall F-measureFigure 3. Normalized poly kernel results
By results from table 5 and figure 3 the Normalized poly kernel accuracy also increases as the no of features increase. but it achieves high accuracy then poly kernel.
Table 7. RBF kernel No of fold
percentage
No of features
Accuracy Precision Recall
F-measure 100 % 4 0. 8632 0.819 0.955 0.882 >50 12 0.9629 0.968 0.969 0.965 >0 29 0.9724 0.963 0.986 0.974
Figure 4. RBF kernel results
Results from table 6 and figure 4, It also follows the same pattern as other kernels follows. Accuracy is directly proportional to numbers of features selected. But this kernel will not be able to achieve high accuracy as normalized poly kernel achieve.
Table 8. Decision tree (J48) No of fold
percentage
No of features Accuracy Precision Recall F-measure
100 %
4 0.9786 0.965 0.997 0.98
>=50 13 0.9958 0.995 0.997 0.996
>0 30 0.9957 0.996 0.996 0.996
Figure 5. Decision tree (J48) results
By table 7 and figure 5, J48(Decision tree) use rule-based induction for model evaluation and it follow same pattern of proportionality as others but accuracy stopped at a peak point. As the no of attribute increase it doesn’taffect the accuracy. 4 12 29 86. 32 96. 29 97. 24 81. 9 95.5 96.8 96.9 96.3 98.6 88. 2 96. 5 97. 4 1 0 0 % > 5 0 > 0
RBF KERNEL
No of features Accuracy Precision Recall F-measure 4 13 30 97. 86 99. 58 99. 57 96. 5 99. 5 99. 6 99. 7 99. 7 99. 6 98 99.6 99.6 1 0 0 % > = 5 0 > 0
DECISION TREE (J48)
No of features Accuracy Precision Recall F-measureTable 8. Accuracy comparison of all No of fold percentage No of feature s Poly kernel Normalize d poly kernel
RBF kernel Decision tree (J48)
100 % 4 86.34 82.84 86.32 97.86
>50 12 96.39 96.89 96.29 99.58
>0 29 97.37 98.13 97.24 99.57
Figure 6. Accuracy comparison of all techniques
As the no of attributes increases the accuracy increases to some extent. If comparison is done between all techniques, the normalized poly kernel achieved high accuracy then others in SMO kernels. But rule-based induction decision tree (J48) always achieve high accuracy with minimum attributes/features.
6. CONCLUSION. IDS is todays want because, it helps the people to stay up their confidentiality and integrity. Intrusion that disturbs the safety and secrecy of the structure, has become chief concern of several organizations. Hence, there is a want of robust IDS which could observe utterly completely different attack with high attack recognition accuracy. In this, we tend to be mentioned techniques of intrusion detection victimisation SVM which increase the intrusion detection.
REFERENCES
[1] Rao, A. A., Srinivas, P., Chakravarthy, B., Marx, K., & Kiran, P. (2006). A Java Based Network Intrusion Detection System (IDS). In Andhra university college of engineering, India, proceeding of the 2006 IJME-INTERTECH Conference.
[2] Shackelford, S. J. (2014). Managing cyber attacks in international law, business, and relations: In search of cyber peace. Cambridge University Press.
[3] Cha, B., Park, K., & Seo, J. (2005, May). Neural network techniques for host anomaly intrusion detection using fixed pattern transformation. In International Conference on Computational Science and Its Applications (pp. 254-263). Springer, Berlin, Heidelberg.
[4] Shon, T., Kim, Y., Lee, C., & Moon, J. (2005, June). A machine learning framework for network anomaly detection using SVM and GA. In Information Assurance Workshop, 2005. IAW'05. Proceedings from the Sixth Annual IEEE SMC (pp. 176-183). IEEE.
[5] Jha, J., & Ragha, L. (2013). Intrusion detection system using support vector machine. International Journal of Applied Information Systems (HAIS)-ISSN, 2249-0868.
[6] Tavallaee, M., Bagheri, E., Lu, W., & Ghorbani, A. A. (2009, July). A detailed analysis of the KDD CUP 99 data set. In Computational Intelligence for Security and Defense Applications, 2009. CISDA 2009. IEEE Symposium on (pp. 1-6). IEEE.
[7] Ben-Hur, A., Horn, D., Siegelmann, H. T., & Vapnik, V. (2001). Support vector clustering. Journal of
4 12 29 86. 34 96.39 97.37 82. 84 96.89 98.13 86. 32 97.86 96.29 99.58 97.24 99.57 1 0 0 % > 5 0 > 0
COMPARISON
No of features Poly kernel Normalized poly kernel RBF kernel Decision tree (J48)machine learning research, 2(Dec), 125-137.
[8] McHugh, J. (2000). Testing intrusion detection systems: a critique of the 1998 and 1999 darpa intrusion detection system evaluations as performed by lincoln laboratory. ACM Transactions on Information and System Security (TISSEC), 3(4), 262-294.
[9] Tavallaee, M., Bagheri, E., Lu, W., & Ghorbani, A. A. (2009, July). A detailed analysis of the KDD CUP 99 data set. In Computational Intelligence for Security and Defense Applications, 2009. CISDA 2009. IEEE Symposium on (pp. 1-6). IEEE.
[10] Kayacik, H. G., Zincir-Heywood, A. N., & Heywood, M. I. (2005, October). Selecting features for intrusion detection: A feature relevance analysis on KDD 99 intrusion detection datasets. In Proceedings of the third annual conference on privacy, security and trust.
[11] Olusola, A. A., Oladele, A. S., & Abosede, D. O. (2010, October). Analysis of KDD’99 intrusion detection dataset for selection of relevance features. In Proceedings of the World Congress on Engineering and Computer Science (Vol. 1, pp. 20-22).
[12] Chandolikar, N. S., & Nandavadekar, V. D. (2012). Selection of relevant feature for intrusion attack classification by analyzing KDD Cup 99. MIT International Journal of Computer Science & Information Technology, 2(2), 85-90.
[13] Cini, F. G., & e Civiltà, V. C. D. C. (1957). Saggi e memorie di storia dell'arte. Olschki.
[14] Joseph, J. F. C., Lee, B. S., Das, A., & Seet, B. C. (2011). Cross-layer detection of sinking behavior in wireless ad hoc networks using SVM and FDA. IEEE Transactions on Dependable and Secure Computing, 8(2), 233-245.
[15] Shah, A. A., Hayat, M. S., & Awan, M. D. (2015). Analysis of Machine Learning Techniques for Intrusion Detection System: A Review. Infinite Study.
[16] Khaing, K. T. (2010). Enhanced Features Ranking and Selection using Recursive Feature Elimination (RFE) and k-Nearest Neighbor Algorithms in Support Vector Machine for Intrusion Detection System. International Journal of Network and Mobile Technologies, 1(1), 1832-6758.
[17] Wiki, B. (2018). OP_RETURN.[ONLINE] Available at https://en. bitcoin. it/wiki. OP_RETURN.[Accessed 13 January 2018].
[18] Ivanciuc, O. (2008). Weka machine learning for predicting the phospholipidosis inducing potential. Current topics in medicinal chemistry, 8(18), 1691-1709.
[19] Wiki, B. (2018). OP_RETURN.[ONLINE] Available at https://en. bitcoin. it/wiki. OP_RETURN.[Accessed 13 January 2018].
[20] Mulay, S. A., Devale, P. R., & Garje, G. V. (2010). Intrusion detection system using support vector machine and decision tree. International Journal of Computer Applications, 3(3), 40-43.
[21] Abid, A., Hussain, N., Abid, K., Ahmad, F., Farooq, M. S., Farooq, U., ... & Sabir, N. (2016). A survey on search results diversification techniques. Neural Computing and Applications, 27(5), 1207-1229.