Procedia - Social and Behavioral Sciences 43 ( 2012 ) 192 – 200
1877-0428 © 2012 Published by Elsevier B.V. Selection and/or peer review under responsibility of Beijing Jiaotong University [BJU], Systems Engineering Society of China (SESC)
doi: 10.1016/j.sbspro.2012.04.091
8
thInternational Conference on Traffic and Transportation Studies
Changsha, China, August 1–3, 2012
Can Left-turn Waiting Areas Improve the Capacity of
Left-turn Lanes at Signalized Intersections?
Zhao Yang
a,*, Pan Liu
a, Yuguang Chen
a, Hao Yu
a a School of Transportation, Southeast University, Sipailou #2, Nanjing, 210096, P. R. ChinaAbstract
This study estimated the operational impacts of left-turn waiting areas at signalized intersections using the VISSIM simulation technique. A procedure was proposed to model capacity of single left-turn lanes with waiting areas in VISSIM. Using data collected from 7 different sites, the VISSIM simulation model was calibrated and validated. The simulation results of the calibrated VISSIM model were compared to field measured capacity, as well as the capacity estimated using the analytical model developed in our previous studies. The calibrated VISSIM simulation model yields a Mean Absolute Percent Error (MAPE) of 8.28% for the exclusive left-turn lanes, indicating that VISSIM provides reasonable capacity estimates for left-turn lanes with waiting areas at signalized intersections. Based on the calibrated VISSIM simulation model, the capacity for left-turn lanes with waiting areas with different storage capacity was compared with the scenario for which the left-turn waiting area is not installed. The results show that the use of left-turn waiting areas could increase the capacity for the left-turn movement, and the capacity gains would increase with the increase in the size of the left-turn waiting areas.
© 2012 Published by Elsevier Ltd. Selection and peer-review under responsibility of Beijing Jiaotong University (BJU) and Systems Engineering Society of China (SESC).
Keywords: signalized intersections; left-turn waiting areas; left-turn movement; capacity; VISSIM simulation
1. Introduction
As a consequence of rapid motorization, many signalized intersections in China suffer from congestion and long queues in the past two decades. Accordingly, some unconventional traffic control treatments
*Corresponding author. Tel.: 13605152958 E-mail address: seuyangzhao@gmail.com.
© 2012 Published by Elsevier B.V. Selection and/or peer review under responsibility of Beijing Jiaotong University [BJU], Systems Engineering Society of China (SESC) Open access under CC BY-NC-ND license.
have been proposed to improve traffic operations at signalized intersections. Recently, traffic engineers in China started using left-turn waiting areas to improve traffic efficiency at signalized intersections. Left-turn waiting areas are usually set up beyond the stop bar at exclusive left-Left-turn lanes. Such design allows left-turning vehicles to enter and wait at the waiting areas after the initiation of the through phase. Left-turning vehicles in the waiting areas will later be discharged during a lagging left-turn phase.
A typical layout of a signalized intersection with left-turn waiting areas is given in Fig. 1 As shown in Fig. 1, the left-turn waiting area can be considered an extension of the exclusive left-turn lane. Theoretically, the presence of the left-turn waiting area will help reducing the probability of overflow of left-turning vehicles onto the adjacent through lanes under oversaturated conditions. In addition, using left-turn waiting areas also has the potential to improve the capacity of left- turn movements since it increases the actual green time available for left-turning vehicles to cross the intersection.
Fig. 1. Typical layout of a signalized intersection with left-turn waiting area
To successfully implement this unconventional left-turn design, the operational impacts of left-turn waiting areas at signalized intersections must be carefully studied. Of particular interest is the capacity of exclusive left-turn lanes. Traditionally, the capacity of a left-turn movement at a signalized intersection has been estimated using the capacity estimation model provided in the Highway Capacity Manual, which is based on the concept of saturation flow and saturation flow rate (HCM 2010). However, this model cannot be directly used for estimating the capacity of exclusive left-turn lanes with waiting areas.
In our previous research, an analytical model was proposed to evaluate the impacts of left-turn waiting areas on capacity of left-turn movements. Based on the surveyed data from 12 sites in the city of Nanjing, the capacity of exclusive left-turn lanes with different sizes of left-turn waiting areas was compared. It was found that using left-turn waiting areas increased capacity of left-turn lanes and the capacity gains
would increase with the increase in the size of the left-turn waiting areas. Assuming that the green arrow time plus yellow time for the lagging left-turn phase is 20 sec, installing a left-turn waiting area with a storage capacity of 3 passenger cars will increase the capacity of a single left-turn lane by 20.50%, as compared to the scenario for which the left-turn waiting area is not installed. However, the analytical model proposed in our previous study was not testified.
As a supplement to the analytical models, traffic engineers and designers often use traffic simulation techniques to compare different design alternatives and to convey the needs for implementing unconventional traffic control treatments in practical engineering applications (Hummer, 1997; Bared, 2002; Yang, 2004; Topp, 2005; Liu, 2010). VISSIM is a microscopic simulation software that can be used to model left-turn movements at signalized intersections. This traffic simulation software has been widely used for the evaluation of transportation system design alternatives and traffic management strategies. One of the major benefits of VISSIM is that it allows users to model detailed geometric configurations as well as drivers’ behavioral characteristics encountered in the transportation system. Previous researchers have used VISSIM to model capacity of minor movements at modern roundabouts, U-turns at unsignalized intersections, etc.. However, research regarding the use of VISSIM for estimating capacity of left-turn lanes with waiting areas is still limited.
The study presented in this paper is a continuous effort following our previous study to further examine the operational benefits associated with left-turn waiting areas using the traffic simulation software VISSIM. A procedure is proposed to help transportation professionals model the capacity of left-turn lanes with waiting areas at signalized intersections in VISSIM. The simulation model was calibrated using data collected from 7 locations in the Nanjing area of China. Using capacity of left-turns as measure of effectiveness (MOEs), simulation results of the calibrated VISSIM model was compared to the results of analytical models, which were developed in our previous studies, as well as capacity data directly measured in the field. Based on the calibrated simulation model, the capacity of a specific left-turn lane with waiting areas with different storage capacity was compared. More specifically, the research presented in this paper intends to answer the following two questions: 1) how to model the driving behavior of left-turning vehicles at signalized intersections with waiting areas in VISSIM; 2) can VISSIM provide reasonable capacity estimates for left-turn lanes with waiting areas at signalized intersections; and 3) can left-turn waiting areas improve the capacity of left-turn lanes at signalized intersections according to the simulation data? Note that the focus of this study is on left-turning passenger cars. The impacts of left-turning heavy vehicles were not considered in this study.
2. Methodology
Assuming that left-turning vehicles arrive at left-turn lanes at a uniform rate, and left-turn traffic is in an unsaturated condition. Fig. 2 illustrates an idealized time-distance diagram for an interrupted left-turn traffic stream. G, R and Y represent the duration of green, red and yellow time for the left-turn movement (sec), respectively. kn represents the nth (n=1, 2…) vehicle in the queue and hn denotes the nth headway
for the queue.
As shown in Fig 2(a), for left-turn lanes without waiting areas, a total of 12 vehicles are shown in the diagram. At time t=0 vehicle 1 is stopped by the red light. Vehicles 2 to 8 consecutively join the stopped platoon. Line AB represents the shock wave between the approach conditions and the stationary-platoon conditions. After a startup delay due mostly to the first driver’s perception-reaction following the onset of green, the leading vehicle begins to move through the intersection. The subsequent vehicles follow at shorter release headways. Line CB represents the shock wave at the front of the platoon between the jam and the release conditions. When the two shock waves meet, the stationary platoon is totally dissipated. In
this case this event occurs before the onset of the following red, so that vehicles 9, 10, and 11 are able to clear the intersection without interruption. Finally, vehicle 12 is obliged to stop for the next red display.
For signalized intersections with waiting areas, the time-distance diagram for left-turning vehicles is slightly different. The presence of a turn waiting area affects the queue discharge patterns of the left-turn movement. As shown in Fig. 2(b), left-left-turning vehicles start to enter the waiting area at time t0 before
the initiation of the left-turn phase. The presence of left-turning vehicles in the waiting area may also affect the start-up lost time and saturation headways for left-turning vehicles behind the stop line. Note that vehicles at the waiting areas shall be considered discharged vehicles since they have already crossed the stop line. Theoretically, the discharge headways for these vehicles should not be considered when estimating the start-up lost time and saturation headways for left-turning vehicles. In this condition, the first vehicle behind the stop line shall be considered the leading vehicle of the left-turn queue, as shown in Fig. 2(b). Based on the analysis of the discharge process in Fig. 2(b), the capacity of left-turn lanes at signalized intersections with waiting areas can be calculated as:
' ' ( G Y Ls Lc) 3600 C' N T h (1) where C’ represents the capacity of exclusive left-turn lanes at signalized intersections with left-turn waiting areas (pcu/hr/ln); N denotes the number of passenger cars in the waiting area; Ls’ represents the
start-up lost time of the left-turn queue behind the stop line (sec); and h’ is the saturation headway for left-turning vehicles behind the stop line (sec).
Fig. 2. Time-distance diagram of the left-turn movement
As shown in Eq. (1), the capacity of left-turn lanes at signalized intersections with left-turn waiting areas is mainly determined by three parameters. They are: (1) the storage capacity of the waiting area (N); (2) the start-up lost time of the left-turn queue behind the stop line (Ls’); and (3) the saturation headway of left-turn movement (h’). One of the major tasks of this study is to estimate the impacts of the storage capacity of the left-turn waiting area on queue discharge characteristics of left-turning vehicles behind the stop line.
In our previous studies, the research team evaluated the impacts of left-turn waiting areas on saturation headway and start-up lost time for the protected left-turn movements. The results indicated that the use of
left-turn waiting areas did not significantly affect the saturation headways of left-turn passenger cars behind the stop bar (h1=h2=h). However, the presence of left-turn vehicles in the waiting areas
significantly increases the start-up lost time and the impacts increases in the storage capacity of left-turn waiting areas (Ls2> Ls1). The recommended saturation headway and start-up lost time for left-turns at
signalized intersections are given in Table 1.
Table 1. Saturation headways and start-up lost time for different turning movements
Na Saturation Headway Start-up Lost Time
Sample Size Mean Std. Sample Size Mean Std.
0 225 2.10 0.39 97 3.54 1.30
1 333 2.14 0.41 81 4.22 1.60
2 608 2.13 0.45 119 4.94 1.58
3 241 2.11 0.55 43 6.28 1.42
With the estimated saturation headway and start-up lost time, the percentage of increase in capacity for left-turn lanes with waiting areas, as compared with the without waiting area condition, can be estimated using the following equation:
s1 s2 2 1 1 s1 c N h L L C - C ǻC 100% C G Y L L (2) The capacity estimation results of the proposed analytical model were compared to left-turn capacity data measured in the field. It was found that the model provided reasonable capacity estimates for left-turns at signalized intersections.
3. Data collection
To achieve the research objective, traffic data were collected using video-tapes at 16 approaches of 5 signalized intersections in the Nanjing area of China. The purpose of field data collection was to collect traffic, geometric and drivers’ behavioral information which will be used to setup, calibrate and validate VISSIM simulation models. The following criteria were applied in the site selection process: (1) The selected approach should provide a protected lagging left-turn phase and exclusive left-turn lanes for the left-turn movement; The impacts of dual left-turn lanes and permitted left-turn phases were not considered in this study; (2) The selected sites should have large numbers of left-turn traffic demand; (3) There were limited numbers of pedestrians or cyclists; (4) There was no roadside parking or bus stop adjacent to a travel lane within 100 meters of the stop line; (5) The approach grade was level; and (6) The intersections were located in a non-central business district area.
The selected sites are summarized in Table 2. A video camera was set up in the field to video tape traffic data. Field data collection was usually conducted during weekday peak periods. Data were not collected during inclement weather or under unusual traffic conditions such as traffic congestion or roadway maintenance. In total, the research team recorded 45 hours of traffic data in the field.
The recorded video tapes were later reviewed in the laboratory for obtaining traffic data. The following three pieces of information were collected: (1) the signal timing strategy for each site; (2) the capacity of left-turn lanes with waiting areas; and (3) the turning speeds of left-turning vehicles. In this study, the capacity of left-turn lanes were measured as the number of left-turning vehicles that pass the stop line during an hour in a saturated condition. The turning speed is defined as the point speed when left-turning vehicles complete the left-turn movement and will start to accelerate to the operating speed of through
traffic. The research team selected a reference line which is 4.5 meters beyond the stop bar in the other approach at the signalized intersection. The time interval between the crossing of the rear wheel of each left-turning passenger car over the reference line and the stop bar was recorded. Turning speed for each left-turning vehicle was then calculated as the average speed that the vehicle passes through the section.
Table 2. Selected sites for field data collection
Site Intersection Direction Na Number of Lanes
LTb TMc RTd
1 Beijing Rd. & Danfeng Rd. EB 0 1 2 1
2 Beijing Rd. & Danfeng Rd. WB 0 1 2 1
3 Longpan Rd. & Zhongshan Rd. SB 0 1 4 1
4 Beijing Rd. & Danfeng Rd. NB 1 1 2 1
5 Huaihai Rd. & Hongwu Rd. NB 2 1 2 1
6 Longpan Rd. & Zhongshan Rd. EB 3 1 3 2
7 Longpan Rd. & Ruijing Rd. WB 3 1 2 2
aN represents the storage capacity of the left-turn waiting area; bLT represents the protected left-turn movement;
cTM represents the through movement;
dRT represents the protected right-turn movement.
4. VISSIM Simulation Model
In this study, VISSIM was used to model the left-turn movement at signalized intersections. The process of modeling a signalized intersection started from tracing an aerial photo or a technical drawing of the intersection, and specifying the number, length and width of lanes in each approach. Once the geometry of the intersection was defined, traffic flow parameters for each approach were allocated to each lane group. Then the signal control strategy in VISSIM was defined according to field measured signal timing information. Using the turning speed data measured in the field, reduced speed areas for left turn movements were also included in the simulation model to more accurately reflect drivers’ behavior of turning vehicles.
Before VISSIM simulation model can be used for modeling capacity of left-turn lanes with waiting areas at signalized intersections, the model must be calibrated and validated against field data to ensure that VISSIM provides reasonable capacity estimates for left-turns. Simulation model calibration in this stage followed the normal calibration procedures proposed by previous studies (Milam, 2002; Byungkyu, 2003; Chu, 2004). In this study, capacity of left-turns was selected as the MOEs for simulation model calibration and validation. The VISSIM capacity estimates for left-turns were obtained by inputting a very large left-turn traffic demand to ensure that the left-turn traffic flow was in an over-saturated state. The entering traffic volume for left-turns was then considered the capacity of left-turns at signalized intersections.
The calibrated VISSIM simulation models were run for one-hour time interval at each selected site. Simulation results of the VISSIM model were then compared to field measured capacity, as well as the capacity estimated using the analytical model developed in our previous studies. The results are illustrated in Table 3. The mean absolute percent error (MAPE) was used to measure the differences between the field measured and simulated results. The MAPE value can be estimated using the following equation:
¦
n i if i f i m c c c n MAPE 1 1 (3) where n represents the number of observations, cmirepresents the number of simulated conflicts for timeinterval i, and cfi is the number of traffic conflicts observed in the real world during time interval i.
Table 3. Results of field measured and simulated capacity
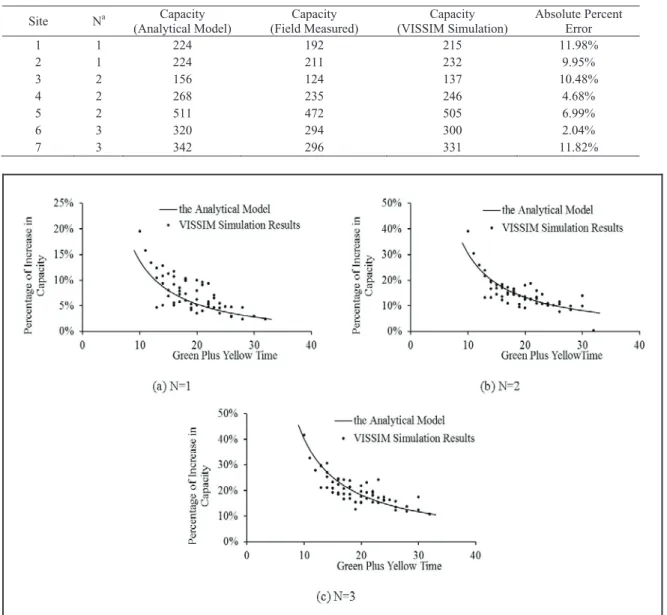
Site Na Capacity (Analytical Model) Capacity (Field Measured) Capacity (VISSIM Simulation) Absolute Percent Error 1 1 224 192 215 11.98% 2 1 224 211 232 9.95% 3 2 156 124 137 10.48% 4 2 268 235 246 4.68% 5 2 511 472 505 6.99% 6 3 320 294 300 2.04% 7 3 342 296 331 11.82%
Fig. 3. Simulation results for exclusive left-turn lanes
As shown in Table 3, the calibrated VISSIM simulation model yields a MAPE value of 8.28% for the exclusive left-turn lanes. Model validation results suggested that the calibrated VISSIM simulation models provided reasonable capacity estimates for left-turns with waiting areas at signalized intersections.
5. Comparison of capacity for left-turn lanes with and without waiting areas
To evaluate the operational impacts of left-turn waiting areas at signalized intersections, the capacity for left-turn lanes with waiting areas with different storage capacity was compared with the without waiting area condition. In the calibrated VISSIM simulation model, the size of left-turn waiting area was set to accommodate different number of passenger cars. Under each condition (N=0, 1, 2, 3), the capacity for the left-turn movement was obtained by inputting a very large left-turn demand, which has been mentioned above. The percentage of increase in capacity for left-turn lanes with waiting areas, as compared with the without waiting area condition, was estimated using Equation (3). Simulation results of the VISSIM model were then compared to the results obtained using the analytical model developed in our previous studies. The results are illustrated in Fig. 3. The simulation results are generally close to the data estimated using the analytical model. The results suggested that the use of left-turn waiting areas could increase the capacity for the left-turn movement, and the capacity gains would increase with the increase in the size of the left-turn waiting areas. According to the VISSIM simulation results, if the green arrow time plus yellow time for the lagging left-turn phase is 20 sec, installing a left-turn waiting area with a storage capacity of 3 passenger cars will increase the left-turn capacity by 17.82% for the exclusive left-turn lane.
6. Conclusions and discussions on clusions and discussions
The operational impacts of left-turn waiting areas is currently of great interest to many transportation professionals due to the widespread use of unconventional left-turn treatments at signalized intersections. In this study, a procedure was proposed to help transportation professionals model capacity of left-turn lanes with waiting areas at signalized intersections in VISSIM. Geometric features and turning speed of left-turns were determined using data collected from 7 different sites in the Nanjing area of China.
The VISSIM simulation model was calibrated and validated using the conventional approaches. Simulation results of the calibrated VISSIM model were compared to field measured capacity, as well as the capacity estimated using the analytical model developed in our previous studies. The calibrated VISSIM simulation model yields a Mean Absolute Percent Error (MAPE) of 8.28% for exclusive left-turn lanes. The estimation error can be considered acceptable in practical engineering applications.
Based on the calibrated VISSIM simulation model, the capacity for left-turn lanes with waiting areas with different storage capacity was compared with the scenario for which the left-turn waiting area is not installed. The simulation results are generally close to the data estimated using the analytical model. The results suggested that the use of left-turn waiting areas could increase the capacity for the left-turn movement, and the capacity gains would increase with the increase in the size of the left-turn waiting areas. According to the VISSIM simulation results, if the green arrow time plus yellow time for the lagging left-turn phase is 20 sec, installing a left-turn waiting area with a storage capacity of 3 passenger cars will increase the left-turn capacity by 17.82% for the exclusive left-turn lane.
One of the limitations of this study is that the impacts of left-turning heavy vehicles are not considered in the simulation model. This was due to the reason that left-turning heavy vehicles are very scarce in the selected sites. In addition, this study is based on data collected from the Nanjing area of China where left-turn waiting areas have been widely used at signalized intersections. The simulation model may need to be recalibrated before it is to be used in other places with different traffic conditions.
Acknowledgements
This research was jointly sponsored by China’s National Science and Technology Plan of Action for Traffic Safety (Project #: 2009BAG13A07-5), China’s National Natural Science Foundation (Project #: 50908050), as well as the Excellent Young Faculties Program at the Southeast University. The authors also would like to thank the graduate research assistants at the School of Transportation at the Southeast University for their assistance in field data collection and data reduction.
References
Bared, J. and Kaisar, E. I. (2002). Median U-turn design as an alternative treatment for left turns at signalized intersections, Journal of ITE, Institute of Transportation Engineers, Vol. 72, pp. 50–54. Byungkyu, P. and Schneeberger, J. (2003). Microscopic simulation model calibration and validation: case study of VISSIM simulation model for a coordinated actuated signal system. Proc. the 82th Annual
Meeting of the Transportation Research Board, Washington, D.C., 1856, pp. 185-192.
Chu, L. Liu, H. X. Oh, J. K. and Recker, W. (2003). A calibration procedure for microscopic traffic simulation. Proc. 14th International IEEE Conference on Intelligent Transportation Systems,Washington, D.C., Vol. 2, pp. 1574-1579.
Hummer, E. J. and Boone, J. (1997). Travel efficiency of unconventional suburban arterial intersection designs.Transportation Research Record 1500, Washington D.C., pp. 153-161.
Liu, P. Wu, X. Wang, W. and Cao, B. (2010). Using VISSIM to model capacity of U-turns at unsignalized intersections with non-traversable median cross sections. Proc. the 90th Annual Meeting of
the Transportation Research Board, Washington, D.C.
Milam, R. T. and Chao, F. (2002). Recommended guidelines for the calibration and validation of traffic simulation models. Proc. the 8th TRB Conference on the Application of Transportation Planning Methods, Texas. pp. 178-187.
Topp, A. and Hummer, J. E. (2005). Comparison of two median U-Turn design alternatives using microscopic simulation. Proc. the 3rd International Symposium on Highway Geometric Design, Transportation Research Board, Chicago.
Transportation Research Board. (2010). Highway Capacity Manual. Washington D.C.
Yang, X. K. and Zhou, H. G. (2004). CORSIM-based simulation approach to evaluation of direct left turn versus right turn plus U-turn from driveways. Journal of Transportation Engineering, Vol.130, pp. 68-75.