T
ABLEO
FC
ONTENTSGOLD COAST REGIONAL PLAN ... 3
ABOUT RDA GOLD COAST ... 4
HOW TO GET INVOLVED WITH RDA GOLD COAST ... 4
GOLD COAST REGIONAL PROFILE ... 5
WORKFORCE ... 6
POPULATION ... 6
EMPLOYMENT ... 8
YOUTH UNEMPLOYMENT ...10
VOLUNTEERS ...10
INDUSTRY AND OCCUPATION ...11
PLACE OF USUAL RESIDENCE ...13
MINING ...14
OUTPUT BY INDUSTRY ...16
REGIONAL EXPORTS BY INDUSTRY...17
REGIONAL IMPORTS BY INDUSTRY ...18
VALUE-ADDED BY INDUSTRY ...19
GOLD COAST TOURISM...20
TOURISM OUTPUT ...20
OUTPUT ATTRIBUTABLE TO TOURISM ...21
EMPLOYMENT ATTRIBUTABLE TO TOURISM...21
MANUFACTURING ...22
CONSTRUCTION ...22
ACCOMMODATION AND FOOD SERVICES ...23
HEALTH CARE AND SOCIAL ASSISTANCE SERVICES ...24
EDUCATION AND TRAINING SERVICES ...25
OCCUPATIONS AND QUALIFICATIONS ...26
EMPLOYMENT OUTLOOK FOR THE REGION ...28
EMPLOYMENT OPPORTUNITIES...30
EDUCATION ...31
SUSTAINABLE (ECONOMIC, ENVIRONMENTAL AND SOCIAL) COMMUNITIES AND POPULATION GROWTH ...32
THE ECONOMIC VALUE OF THE REGION ...32
THE ECONOMIC VALUE BY INDUSTRY IN THE REGION (INCLUDING THE TOURISM SECTOR) ...32
GROWTH INDUSTRIES ...34
2011INDUSTRY PROFILE – BUSINESS NUMBERS ...35
TOURISM ...36
DWELLING APPROVALS AND CONSTRUCTION ...37
ENVIRONMENTAL ASSETS...38
CLIMATE CHANGE ...39
GREENHOUSE GAS EMISSIONS -PROJECTED EMISSIONS ...40
AIR QUALITY...41
WATER RESOURCES...41
SOCIAL ...42
URBAN DEVELOPMENT PROFILE ...42
URBAN DENSITY ...43
HEALTH ...44
POPULATION PROFILE ...45
CURRENT POPULATION CHARACTERISTICS ...45
FUTURE POPULATION LEVELS ...46
FUTURE DWELLING LEVELS ...48
AGEING OF THE POPULATION ...49
POPULATION LEVELS – LIFECYCLE ...49
DEMOGRAPHIC PROFILE -INDIGENOUS POPULATION ...51
ETHNICITY ...52
MIGRATION ...53
DWELLINGS ...54
MORTGAGE AND RENT REPAYMENTS ...55
HOUSEHOLD AND INDIVIDUAL INCOME ...57
Acknowledgements
Compilation of the 2013 Regional Profile was coordinated by Executive Officer, Ian Pritchard.
A special thanks to participants in a number of community consultation events, forums and other community engagement activities organised, or supported, by RDA Gold Coast over the past 12 months.
The RDA Gold Coast Committee consists of Craig Devlin, Colette McCool, Jevena O’Brien, Stephen Simpson, Prof Paul Burton, Anne Norton Knight, John Jones OAM, Vivienne Mallinson, Trina Hockley and Kerrie Young.
RDA Gold Coast has taken due care in preparing this document. However, noting that data used for analyses have been provided by third parties, RDA Gold Coast gives no warranty to the accuracy, reliability, fitness for purpose, or otherwise of the information.
Copyright © 2013 Regional Development Australia Gold Coast Incorporated - Version Sep 2013
Photographs: Courtesy of Absolom Photography www.absolomphotography.com.au
Acknowledgements
Compilation of the 2013 Regional Profile was coordinated by Executive Officer, Ian Pritchard.
A special thanks to participants in a number of community consultation events, forums and other community engagement activities organised, or supported, by RDA Gold Coast over the past 12 months.
The RDA Gold Coast Committee consists of Craig Devlin, Colette McCool, Jevena O’Brien, Stephen Simpson, Prof Paul Burton, Anne Norton Knight, John Jones OAM, Vivienne Mallinson, Trina Hockley and Kerrie Young.
RDA Gold Coast has taken due care in preparing this document. However, noting that data used for analyses have been provided by third parties, RDA Gold Coast gives no warranty to the accuracy, reliability, fitness for purpose, or otherwise of the information.
Copyright © 2013 Regional Development Australia Gold Coast Incorporated - Version Sep 2013
T
ABLEO
FC
ONTENTSGOLD COAST REGIONAL PLAN ... 3
ABOUT RDA GOLD COAST ... 4
HOW TO GET INVOLVED WITH RDA GOLD COAST ... 4
GOLD COAST REGIONAL PROFILE ... 5
WORKFORCE ... 6
POPULATION ... 6
EMPLOYMENT ... 8
YOUTH UNEMPLOYMENT ...10
VOLUNTEERS ...10
INDUSTRY AND OCCUPATION ...11
PLACE OF USUAL RESIDENCE ...13
MINING ...14
OUTPUT BY INDUSTRY ...16
REGIONAL EXPORTS BY INDUSTRY...17
REGIONAL IMPORTS BY INDUSTRY ...18
VALUE-ADDED BY INDUSTRY ...19
GOLD COAST TOURISM...20
TOURISM OUTPUT ...20
OUTPUT ATTRIBUTABLE TO TOURISM ...21
EMPLOYMENT ATTRIBUTABLE TO TOURISM...21
MANUFACTURING ...22
CONSTRUCTION ...22
ACCOMMODATION AND FOOD SERVICES ...23
HEALTH CARE AND SOCIAL ASSISTANCE SERVICES ...24
EDUCATION AND TRAINING SERVICES ...25
OCCUPATIONS AND QUALIFICATIONS ...26
EMPLOYMENT OUTLOOK FOR THE REGION ...28
EMPLOYMENT OPPORTUNITIES...30
EDUCATION ...31
SUSTAINABLE (ECONOMIC, ENVIRONMENTAL AND SOCIAL) COMMUNITIES AND POPULATION GROWTH ...32
THE ECONOMIC VALUE OF THE REGION ...32
THE ECONOMIC VALUE BY INDUSTRY IN THE REGION (INCLUDING THE TOURISM SECTOR) ...32
GROWTH INDUSTRIES ...34
2011INDUSTRY PROFILE – BUSINESS NUMBERS ...35
TOURISM ...36
DWELLING APPROVALS AND CONSTRUCTION ...37
ENVIRONMENTAL ASSETS...38
CLIMATE CHANGE ...39
GREENHOUSE GAS EMISSIONS -PROJECTED EMISSIONS ...40
AIR QUALITY...41
WATER RESOURCES...41
SOCIAL ...42
URBAN DEVELOPMENT PROFILE ...42
URBAN DENSITY ...43
HEALTH ...44
POPULATION PROFILE ...45
CURRENT POPULATION CHARACTERISTICS ...45
FUTURE POPULATION LEVELS ...46
FUTURE DWELLING LEVELS ...48
AGEING OF THE POPULATION ...49
POPULATION LEVELS – LIFECYCLE ...49
DEMOGRAPHIC PROFILE -INDIGENOUS POPULATION ...51
ETHNICITY ...52
MIGRATION ...53
DWELLINGS ...54
MORTGAGE AND RENT REPAYMENTS ...55
Page | 3
G
OLD COAST REGIONAL PLAN
The Gold Coast is a diverse and robust regional community relatively dependent upon traditional economic sectors such as tourism, construction and retail.
In order to address the challenges and opportunities facing the region, Regional Development Australia (RDA) Gold Coast has been working with a variety of business, government, community and environmental groups to identify the Gold Coast regional priorities.
These priorities form the basis of the 2013-2016 Regional Plan. The framework created identifies five
significant priorities for the region: economic diversity, investment and infrastructure, digital innovation, workforce and sustainable communities.
A collaborative, purpose driven approach is required to overcome the challenges facing the region and address these priorities; this has been identified in the Regional Plan as regional leadership.
The Regional Plan framework is underpinned by this body of research, the 2013 Regional Profile report.
This profile outlines a complex and fluctuating regional economy and provides a detailed overview of key economic, social and environmental metrics over time.
The 2013-2016 Regional Plan can be viewed online at www.rdagoldcoast.org.au ADVANCETOWN ALBERTON ARUNDEL ASHMORE AUSTINVILLE BENOWA BIGGERA WATERS BONOGIN BROADBEACH BROADBEACH WATERS BUNDALL BURLEIGH HEADS BURLEIGH WATERS CARRARA CEDAR CREEK CLEAR ISLAND WATERS COOLANGATTA COOMBABAH COOMERA CURRUMBIN CURRUMBIN VALLEY CURRUMBIN WATERS ELANORA GAVEN GILBERTON GILSTON GUANABA HELENSVALE HIGHLAND PARK HOLLYWELL HOPE ISLAND JACOBS WELL KINGSHOLME LABRADOR LOWER BEECHMONT LUSCOMBE MAIN BEACH MAUDSLAND MERMAID WATERS MERRIMAC MIAMI MOLENDINAR MOUNT NATHAN MUDGEERABA NATURAL BRIDGE NERANG NERANWOOD NORWELL NUMINBAH VALLEY ORMEAU ORMEAU HILLS OXENFORD PACIFIC PINES PARADISE POINT PARKWOOD PIMPAMA REEDY CREEK ROBINA RUNAWAY BAY SOUTH STRADBROKE SOUTHPORT SPRINGBROOK STAPYLTON STEIGLITZ SURFERS PARADISE TALLAI TALLEBUDGERA TALLEBUDGERA VALLEY UPPER COOMERA VARSITY LAKES WILLOW VALE WONGAWALLAN WOONGOOLBA WORONGARY PALM BEACH MERMAID BEACH CLAGIRABA YATALA SOUTHERN MORETON BAY ISLANDS TUGUN BILINGA
Tweed Shire Council New South Wales
Coral Sea Scenic Rim Regional Council Logan City Council Redland City Council
Disclaimer: © City of Gold Coast, Queensland 2013 or © State of Queensland 2013. No warranty given in relation to the data (including accuracy, reliability, completeness or suitability) and no liability accepted (including without limitation, liability in negligence) for any loss, damage or costs (including consequential damage) relating to any use of the data. Data must not be used for direct marketing or be used in breach of the privacy laws.
0 1,250 2,500 5,000m
/
ADVANCETOWN ALBERTON ARUNDEL ASHMORE AUSTINVILLE BENOWA BIGGERA WATERS BONOGIN BROADBEACH BROADBEACH WATERS BUNDALL BURLEIGH HEADS BURLEIGH WATERS CARRARA CEDAR CREEK CLEAR ISLAND WATERS COOLANGATTA COOMBABAH COOMERA CURRUMBIN CURRUMBIN VALLEY CURRUMBIN WATERS ELANORA GAVEN GILBERTON GILSTON GUANABA HELENSVALE HIGHLAND PARK HOLLYWELL HOPE ISLAND JACOBS WELL KINGSHOLME LABRADOR LOWER BEECHMONT LUSCOMBE MAIN BEACH MAUDSLAND MERMAID WATERS MERRIMAC MIAMI MOLENDINAR MOUNT NATHAN MUDGEERABA NATURAL BRIDGE NERANG NERANWOOD NORWELL NUMINBAH VALLEY ORMEAU ORMEAU HILLS OXENFORD PACIFIC PINES PARADISE POINT PARKWOOD PIMPAMA REEDY CREEK ROBINA RUNAWAY BAY SOUTH STRADBROKE SOUTHPORT SPRINGBROOK STAPYLTON STEIGLITZ SURFERS PARADISE TALLAI TALLEBUDGERA TALLEBUDGERA VALLEY UPPER COOMERA VARSITY LAKES WILLOW VALE WONGAWALLAN WOONGOOLBA WORONGARY PALM BEACH MERMAID BEACH CLAGIRABA YATALA SOUTHERN MORETON BAY ISLANDS TUGUN BILINGATweed Shire Council New South Wales
Coral Sea Scenic Rim Regional Council Logan City Council Redland City Council
Disclaimer: © City of Gold Coast, Queensland 2013 or © State of Queensland 2013. No warranty given in relation to the data (including accuracy, reliability, completeness or suitability) and no liability accepted (including without limitation, liability in negligence) for any loss, damage or costs (including consequential damage) relating to any use of the data. Data must not be used for direct marketing or be used in breach of the privacy laws.
0 1,250 2,500 5,000m
/
Page | 3
Page | 3
G
OLD COAST REGIONAL PLAN
The Gold Coast is a diverse and robust regional community relatively dependent upon traditional economic sectors such as tourism, construction and retail.
In order to address the challenges and opportunities facing the region, Regional Development Australia (RDA) Gold Coast has been working with a variety of business, government, community and environmental groups to identify the Gold Coast regional priorities.
These priorities form the basis of the 2013-2016 Regional Plan. The framework created identifies five
significant priorities for the region: economic diversity, investment and infrastructure, digital innovation, workforce and sustainable communities.
A collaborative, purpose driven approach is required to overcome the challenges facing the region and address these priorities; this has been identified in the Regional Plan as regional leadership.
The Regional Plan framework is underpinned by this body of research, the 2013 Regional Profile report.
This profile outlines a complex and fluctuating regional economy and provides a detailed overview of key economic, social and environmental metrics over time.
The 2013-2016 Regional Plan can be viewed online at www.rdagoldcoast.org.au
Regional Development Australia Gold Coast Regional Plan 2013-2016
Gold Coast
Page | 4
Page | 5G
OLD COAST REGIONAL PROFILE
The 2013 Regional Profile (which forms part of the 2013-2016 Regional Plan) provides an in-depth overview of the people, their lifestyles, employment, businesses, and the threats and opportunities within the Gold Coast region, using latest data from a variety of sources including the Australian Bureau of Statistics (ABS).
It examines human capital, economic, environmental, social, and population factors, accessing markets and comparative advantages of the region.
Key statistics for the Gold Coast are summarised in the table below:
We would like to thank Remplan for providing the data for this Profile.
Page | 4
A
BOUT
RDA
GOLD COAST
Regional Development Australia (RDA) Gold Coast is a partnership between all three levels of government and aims to use their combined resources more efficiently to develop the Gold Coast community, strengthen business growth, and enhance community development and engagement. It provides strategic and targeted responses to local issues and builds partnerships between governments, regional development organisations, the private sector and other regional stakeholders. RDA Gold Coast provides additional support though networking opportunities, partnership building, project planning, development and regional advocacy.
RDA Gold Coast is a not-for-profit community organisation led by local leaders from government, business and the community. Committee members are all volunteers and have been ministerially appointed. RDA Gold Coast is a strong advocate for the region and, as a driver of change, has a pivotal role in ensuring the region’s long-term sustainability.
H
OW TO GET INVOLVED WITH
RDA
GOLD COAST
PARTNERSHIP PROJECTSRDA Gold Coast leverages its own resources, available funding opportunities and the capacity of existing organisations to identify potential areas to diversify the regional economy through partnership projects which are aligned with the Regional Plan’s priority areas.
The committee welcomes community, business and government involvement. Please contact RDA Gold
Coast to discuss your project. Phone (07) 5583 5095 or email admin@rdagoldcoast.org.au
COMMITTEE MEMBERSHIP
RDA committee members are local people developing local solutions to local issues. They build partnerships to develop strategies and deliver sustainable infrastructure and services to their regions. As the regional development voice of their communities, the committee:
consults and engages with communities
promotes and participates in regional programs and initiatives
provides information and advice on their region to all levels of government, and
supports informed regional planning
For more information about RDA committees visit http://rda.gov.au/join-your-rda
REGIONAL DEVELOPMENT AUSTRALIA FUND (RDAF)
RDAF has contributed almost $1 billion to capital infrastructure projects identified as priorities by local
Page | 5
Page | 5
G
OLD COAST REGIONAL PROFILE
The 2013 Regional Profile (which forms part of the 2013-2016 Regional Plan) provides an in-depth overview of the people, their lifestyles, employment, businesses, and the threats and opportunities within the Gold Coast region, using latest data from a variety of sources including the Australian Bureau of Statistics (ABS).
It examines human capital, economic, environmental, social, and population factors, accessing markets and comparative advantages of the region.
Key statistics for the Gold Coast are summarised in the table below:
We would like to thank Remplan for providing the data for this Profile.
Factor Gold Coast Sunshine Coast Hunter Region
Population 2012 526,173 324,266 653,346 Population growth 2011-2012 2.13% 1.88% 1.24% Population increase 2011-2012 10,971 5,987 8,021 Median Age (2011) 37 42 40 Employment June 2013 303,100 161,400 323,800 Unemployment June 2013 6.50% 5.90% 5.90% Volunteering 2011 (% of population) 12.20% 16.40% 13.20% % Managers/Professionals 2011 30.90% 31.80% 30.10%
Participation in university education
2011 (15-24 year olds) 18.80% 13.50% 14.70%
Economy size 2011/12 $19,575.3 million $12,129.4 million $36,166 million
Number of businesses 2012 60,015 35,528 70,028
Tourism visitors Dec 2012 11.9 million 8.7 million 7.6 million
Average new house value (2012) $299,341 $291,548 $263,809
Average water use per person per day
(September 2013) 175 litres 190 litres 198 litres
Number of households with internet 77.40% 77.70% 71.10%
% use motor vehicle as main method of
Page | 6
Page | 7 CHART 2 GOLD COAST POPULATION CHANGE BY AGE, 2006 AND 2011Chart 2 illustrates the change in age cohorts that has occurred between the last two census periods. In the period between 2006 and 2011 there has been significant growth in the 60 to 74 age cohorts.
Page | 6 300,000 350,000 400,000 450,000 500,000 550,000 20 01 20 02 20 03 2004 2005 2006 2007 2008 2009 2010 2011 2012
Gold Coast City Population
14,952 15,914 13,460 12,666 13,404 16,865 14,629 14,266 10,300 9,067 10,971 0 5,000 10,000 15,000 20,000 2001 2002 2003 2004 2005 2006 2007 2008 2009 2010 2011 2012
Gold Coast City Population Increase (Number)
W
ORKFORCE
P
OPULATION
A key feature of the region has been its consistently strong population increases. Between 2001 and 2012 the population has grown 38.6%, and added 146,494 people, an increase of 3.0% per annum over this time. Several factors have driven these increases, including the relaxed lifestyle, favourable climate and more than 80km of coastline.
In the period from 2001 to 2012, the Gold Coast’s share of Queensland population growth averaged 14.7%, peaking in 2002 at 18.3% of Queensland’s growth, and reaching its lowest share in 2012 with 12.4%. The reasons for the slowdown include the overall weaker economy, the soft tourism market which is a critical industry to the Gold Coast, and infrastructure bottlenecks. It is still the case, however, that the Gold Coast has been one of the fastest growing regions in Australia.
In 2013 RDA Gold Coast commissioned Bernard Salt of KPMG1 to undertake an analysis of the long
distance commuter workforce. At the time of the 2011 Census, the Gold Coast had emerged as having Australia’s leading commuter flow with 26,000 workers making the daily trip from the Gold Coast to Brisbane. The second largest flow at this time was 18,000 workers travelling daily from Wollongong to Sydney.
The reasons for the significant flow of daily workers from the Gold Coast to Brisbane is a combination of workers choosing the lifestyle option of living on the Gold Coast and a shortage of employment opportunities on the Gold Coast.
1 Analysis of the Gold Coast Long Distance Commuter Workforce. Regional Development Australia – Gold Coast. August 2013
CHART 1 GOLD COAST POPULATION LEVELS AND INCREASES, 2001 TO 2011
Source: ABS 3218.0 Regional Population Growth, 30 August 2013.
The charts above reflect this increase. Since 2002 the growth rate in absolute numbers of people has increased as more people have been attracted to the region. Even since the GFC started in 2008, the Gold Coast has added 59,233 people between 2008 and 2012.
Page | 7
Page | 7 CHART 2 GOLD COAST POPULATION CHANGE BY AGE, 2006 AND 2011
Chart 2 illustrates the change in age cohorts that has occurred between the last two census periods. In the period between 2006 and 2011 there has been significant growth in the 60 to 74 age cohorts.
Page | 8
Page | 9Charts 4 and 5, Regional Employment and Unemployment2, shows the Gold Coast has not been immune
to the impacts of the GFC. During this time employment has levelled, while unemployment has trended up.
CHART 5 REGIONAL UNEMPLOYMENT RATES
2The Small Area Labour Markets (SALM) data has been compiled by the Department of Education, Employment and Workplace Relations (DEEWR).
SALM data incorporates three primary datasets:
1. Centrelink data on people in receipt of Newstart or Youth Allowance (Other), by postcode (not including people in receipt of the Community Development Employment Projects Participant Supplement)
2. ABS Labour Force Survey data at the ABS Labour Force Region level
3. ABS Census of Population and Housing labour force data at the Statistical Local Area level.
The estimates presented have been smoothed by DEEWR using a four-quarter average to minimise the variability inherent in the estimates at the Statistical Local Area level.
0.0 2.0 4.0 6.0 8.0 10.0
Far North Wide-Bay Burnett Gold Coast South & East Brisbane SD Balance Sunshine Coast Mnorthern-Nort West Queensland Australia North Brisbane SD Balance Ipswich City Mackay-Fiztroy-Central West Brisbane City Outer Ring Darling Downs-South West West Moreton Brisbane City Inner Ring
Unemployment Rates*
*12 month averages Labour Force Survey data to Nov 2011 Source: ABS Regional Labour Force Data
Page | 8
E
MPLOYMENT
CHART 3 GOLD COAST LABOUR FORCE STATUS, 2011
In comparison to the Queensland average, the Gold Coast labour force has a relatively high proportion of people that are employed on a part-time basis, this is reflective of the large number of people employed in the ‘Retail Trade’ and ‘Accommodation & Food Services’ industry sectors. The above graph
is based on “Place of Usual Residence’ data from the 2011 Population and Housing Census1.
CHART 4 REGIONAL EMPLOYMENT & UNEMPLOYMENT
CHART 6 REGIONAL UNEMPLOYMENT
CHART 7 REGIONAL UNEMPLOYMENT RATES
1 The Labour Force variable records a person's labour force status for the week prior to Census Night. People aged 15 years and over who are neither
employed nor unemployed are classified as not in the labour force. This includes people who are retired, pensioners and people engaged solely in home duties. Information about employment type is important for a wide range of social and economic policy and planning purposes. The Census of Population and Housing and the Labour Force Survey (LFS) both measure information about the labour market activity of people aged 15 years and over. The Census provides a five yearly snapshot with social-economic data at a small area level, while the Labour Force Survey is based on a
monthly household survey. This variable is applicable to persons aged 15 years and over. It includes a ‘Not applicable’ category, which comprises persons aged under 15 years.
240,000 250,000 260,000 270,000 280,000 290,000 300,000 310,000 Se p-0 8 Ja n-0 9 M ay-09 Se p-0 9 Ja n-1 0 M ay -1 0 Se p-1 0 Ja n-1 1 M ay -1 1 Se p-1 1 Ja n-1 2 M ay -1 2 Se p-1 2
Unsmoothed - Labour Force (Number) Smoothed - Labour Force (Number)
0.0 1.0 2.0 3.0 4.0 5.0 6.0 7.0 8.0 Se p-0 8 Dec-08 M ar-09 Ju n-09 Se p-0 9 Dec-09 M ar-10 Ju n-10 Se p-1 0 Dec-10 M ar-11 Ju n-11 Se p-1 1 Dec-11 M ar-12 Ju n-12 2012 Dec-12
Unsmoothed - Unemployment Rate (%) Smoothed - Unemployment Rate (%)
Source: DEEWR, Small Area Labour Markets Australia
Page | 9
Page | 9
Charts 4 and 5, Regional Employment and Unemployment2, shows the Gold Coast has not been immune
to the impacts of the GFC. During this time employment has levelled, while unemployment has trended up.
CHART 5 REGIONAL UNEMPLOYMENT RATES
2The Small Area Labour Markets (SALM) data has been compiled by the Department of Education, Employment and Workplace Relations (DEEWR).
SALM data incorporates three primary datasets:
1. Centrelink data on people in receipt of Newstart or Youth Allowance (Other), by postcode (not including people in receipt of the Community Development Employment Projects Participant Supplement)
2. ABS Labour Force Survey data at the ABS Labour Force Region level
3. ABS Census of Population and Housing labour force data at the Statistical Local Area level.
The estimates presented have been smoothed by DEEWR using a four-quarter average to minimise the variability inherent in the estimates at the Statistical Local Area level.
0.0 2.0 4.0 6.0 8.0 10.0
Far North Wide-Bay Burnett Gold Coast South & East Brisbane SD Balance Sunshine Coast Mnorthern-Nort West Queensland Australia North Brisbane SD Balance Ipswich City Mackay-Fiztroy-Central West Brisbane City Outer Ring Darling Downs-South West West Moreton Brisbane City Inner Ring
Unemployment Rates*
*12 month averages Labour Force Survey data to Nov 2011 Source: ABS Regional Labour Force Data
Page | 10
Page | 11I
NDUSTRY AND OCCUPATION
Based on the 2011 Census, there were 182,274 jobs located within the Gold Coast Region. The ‘Retail Trade’ sector accounted for the highest proportion of jobs (13.5%), followed by ‘Health Care & Social Assistance’ (12.3%) and ‘Accommodation & Food Services’ (10.9%). The following chart provides a comparison with the Queensland employment profile by industry sector.
In comparison to the State averages, the Gold Coast has a higher representation for ‘Retail Trade’ and ‘Accommodation & Food Services’ which is reflective of population growth and tourism being major drivers of the Gold Coast region.
The proportion of the workforce in ‘Public Administration & Safety’ and ‘Transport & Warehousing’ is considerably higher across the State than the Gold Coast and may provide potential opportunities given the Gold Coast’s strategic location to transport infrastructure and the States capital, Brisbane.
CHART 8 GOLD COAST & QUEENSLAND EMPLOYMENT BY INDUSTRY
Page | 10
Y
OUTH UNEMPLOYMENT
Employment statistics for those who work and live in the region from 2011 ABS Census data indicates that the majority of 15-24 year olds working and living in the region were employed in the ‘Retail Trade’ industry sector (26.2%), followed by ‘Accommodation & Food Services’ (25.3%) and ‘Health Care & Social Assistance’ (6.9%). In total, these industries employed 15,393 (58.5%) of 15-24 year olds who work and live in the region. This largely reflects the region’s economic base and employment opportunities. Alternative employment options need to be developed for young people outside these population servicing core industries.
CHART 6 YOUTH EMPLOYMENT
Live and Work in Gold Coast (C) Work in QLD
Industry Sector Jobs % %
Retail Trade 6,910 26.20% 22.00%
Accommodation & Food Services 6,658 25.30% 18.40% Health Care & Social Assistance 1,826 6.90% 7.60%
Total 15,394 58.50% 48.10%
Source: REMPLAN Economy Workforce
According to the ABS labour data, young people in Queensland continue to experience significantly higher rates of unemployment:
In Queensland (at February 2013), the unemployment rate among 15–19 year-olds not in
full-time education was 21.1%. The participation rate is 78.7% for the same cohort.
In Queensland (at February 2013), the unemployment rate among 20–24 year-olds not in
full-time education was 10.8%. The participation rate is 85.8% for this cohort.
Youth unemployment is a significant issue concerning young people in the region, with high levels of unemployment and low levels of long term employment opportunities, this is an area that requires focus to ensure that today’s youth are trained and skilled to be welcomed into tomorrow’s workforce.
V
OLUNTEERS
The proportion of Gold Coast residents who spent time doing unpaid voluntary work through an organisation or group in the twelve months prior to Census Night was marginally lower that the State average, with 12.2% of the population undertaking some form of volunteering, compared to 14.9% of the Queensland population. This is a reflection of the Coast’s age profile (see Chart 2), as older people who are no longer in the workforce are more likely to volunteer, such as the 70 years and older cohorts.
CHART 7 PERCENTAGE OF POPULATION THAT VOLUNTEER, 2011
Source: REMPLAN Community and ABS 2011 Census
14.9 16.75 11.1 12.16 0 5 10 15 20 Queensland Toowoomba (R) Logan (C) Gold Coast (C)
Page | 11
Page | 11
I
NDUSTRY AND OCCUPATION
Based on the 2011 Census, there were 182,274 jobs located within the Gold Coast Region. The ‘Retail Trade’ sector accounted for the highest proportion of jobs (13.5%), followed by ‘Health Care & Social Assistance’ (12.3%) and ‘Accommodation & Food Services’ (10.9%). The following chart provides a comparison with the Queensland employment profile by industry sector.
In comparison to the State averages, the Gold Coast has a higher representation for ‘Retail Trade’ and ‘Accommodation & Food Services’ which is reflective of population growth and tourism being major drivers of the Gold Coast region.
The proportion of the workforce in ‘Public Administration & Safety’ and ‘Transport & Warehousing’ is considerably higher across the State than the Gold Coast and may provide potential opportunities given the Gold Coast’s strategic location to transport infrastructure and the States capital, Brisbane.
Page | 12
Page | 13P
LACE OF USUAL RESIDENCE
CHART 10 PLACE OF USUAL RESIDENCE OF GOLD COAST WORKERS
Of the 182,274 jobs located within the Gold Coast region, 161,233 people also live on the Gold Coast, 6,310 are from over the border in the Tweed Local Government Area, 6,280 people travel down from Logan (C) and 3,728 from Brisbane (C).
Page | 12
The following chart illustrates the change in employment by industry profile for the Gold Coast region over the five years from 2006 to 2011. The data is for those whose ‘place of usual residence’ was the Gold Coast.
The most significant change has been in the ‘Health Care & Social Assistance’ sector where there were an additional 5,858 jobs generated in the region. This was followed by the ‘Professional, Scientific and Technical Services’ (+3,041 jobs) and ‘Education & Training’ (+3,014 jobs).
The most significant decrease was for the ‘Manufacturing’ sector (-3,565 jobs).
Page | 13
Page | 13
P
LACE OF USUAL RESIDENCE
CHART 10 PLACE OF USUAL RESIDENCE OF GOLD COAST WORKERS
Of the 182,274 jobs located within the Gold Coast region, 161,233 people also live on the Gold Coast, 6,310 are from over the border in the Tweed Local Government Area, 6,280 people travel down from Logan (C) and 3,728 from Brisbane (C).
Page | 14
Page | 15 CHART 11 MINING JOBS – LIVE ON GOLD COAST, LGA OF WORKCHART 12 MINING JOBS – LIVE ON GOLD COAST, OCCUPATION
The primary occupation of those working in the ‘Mining’ sector that live on the Gold Coast is ‘Machinery Operators & Drivers’ (32.9%) followed by ‘Technicians and Trades Workers’ (19.4%).
43.1% of ‘Mining’ sector workers living on the gold Coast report an average weekly income of ‘$2,000 or more’ (the highest grouping), and 19.1% have a weekly income of $1,500-$1,999.
Page | 14
M
INING
RDA Gold Coast recently commissioned Bernard Salt of KPMG to undertake an analysis1 of the long
distance commuter workforce, including FIFO (Fly In Fly Out) workers working in the resources sector. Employment in the mining industry in Queensland hit a record high of 76,000 in May 2013 after experiencing three steady quarters of growth. This is in contrast to the trend experienced in the mining industry nationally which declined by 16,000 workers over the 12 months to May 2013. Queensland is the only state that has recorded consistent and steady growth in mining industry employment since August 2012. The Gold Coast region was home to 6,700 long distance commuters in 2011 as a subset of the region’s overall workforce of 254,000. In comparison, Adelaide had a resident long distance commuter workforce of 6,800 with a workforce of 548,000. The gold Coast id thus able to support a resident long distance workforce the same size as Adelaide’s with less than half the total workforce. The growth of long distance commuting workers residing in the Gold Coast region and travelling to the Bowen Basin was approximately 45% the size of Brisbane’s corresponding growth between 2006 and 2011. Similarly, Gold Coast accounted for 35% of Brisbane’s increase in workers travelling to Surat Basin. Based on the 2011 Census, there were 1,652 people working in the ‘Mining’3 sector who live on the Gold Coast, this is an increase from 729 people in 2006. The 1,652 jobs contribute 0.7% of Gold Coast’s total employment.
1 Analysis of the Gold Coast Long Distance Commuter Workforce. Regional Development Australia Gold Coast, August 2013
3
The Mining Division includes units that mainly extract naturally occurring mineral solids, such as coal and ores; liquid minerals, such as crude petroleum; and gases, such as natural gas. The term mining is used in the broad sense to include underground or open cut mining; dredging; quarrying; well operations or evaporation pans; recovery from ore dumps or tailings as well as beneficiation activities (i.e. preparing, including crushing, screening, washing and flotation) and other preparation work customarily performed at the mine site, or as a part of mining activity. The Mining Division distinguishes two basic activities: mine operation and mining support activities. Mine operation includes units operating mines, quarries, or oil and gas wells on their own account or for others on a contract or fee basis, as well as mining sites under development. Mining support activities include units that perform mining services on a contract or fee basis, and exploration (except geophysical surveying).
Regional Development Australia Gold Coast Inc.
Analysis of the Gold Coast Long Distance Commuter Workforce
Page | 15
Page | 15 CHART 11 MINING JOBS – LIVE ON GOLD COAST, LGA OF WORK
CHART 12 MINING JOBS – LIVE ON GOLD COAST, OCCUPATION
The primary occupation of those working in the ‘Mining’ sector that live on the Gold Coast is ‘Machinery Operators & Drivers’ (32.9%) followed by ‘Technicians and Trades Workers’ (19.4%).
43.1% of ‘Mining’ sector workers living on the gold Coast report an average weekly income of ‘$2,000 or more’ (the highest grouping), and 19.1% have a weekly income of $1,500-$1,999.
Page | 16
Page | 17 CHART 14 MANUFACTURING OUTPUT BY INDUSTRY SUB-SECTORR
EGIONAL EXPORTS BY INDUSTRY
CHART 15 GOLD COAST REGIONAL EXPORTSPage | 16
O
UTPUT BY INDUSTRY
Output data represents the gross revenue generated by businesses /organisations in each of the industry sectors in a defined region.
The output generated by the Gold Coast regional economy is estimated at $44,016.708 million. ‘Manufacturing’ contributes $9,098.034 million, ‘Construction’ contributes $5.145.167 million followed by ‘Rental, Hiring & Real Estate Services’ $5,067.281 million.
CHART 13 GOLD COAST OUTPUT BY INDUSTRY
The ‘Manufacturing’ industry sector is a large sector contributing 20.7% of total Gold Coast regional output. Chart 13 provides a breakdown of the ‘manufacturing’ sector into sub-sectors (this can be further broken down) to provide an understanding of the industry sub-sectors that are driving the regional ‘manufacturing’ output.
‘Metal & Metal Product’ makes the largest contribution ($1,898.914 million) followed by ‘Transport Equipment & Parts’ ($1,535.293 million) and ‘Technical Equipment & Appliances’ ($1,379.282 million).
Page | 17
Page | 17 CHART 14 MANUFACTURING OUTPUT BY INDUSTRY SUB-SECTOR
R
EGIONAL EXPORTS BY INDUSTRY
CHART 15 GOLD COAST REGIONAL EXPORTSPage | 18
Page | 19V
ALUE
-
ADDED BY INDUSTRY
Value-Added data represents the marginal economic value that is added by each industry sector in a defined region.
Value-Added can be calculated by subtracting local expenditure and expenditure on regional imports from the output generated by an industry sector, or alternatively, by adding the wages and salaries paid to local employees, the gross operating surplus and taxes on products and production.
Value-Added by industry sector is the major element in the calculation of Gross Regional Product. The total value-added by the Gold Coast economy is estimated at $19,575.332 million. ‘Rental, Hiring & Real Estate Services’ contributes the highest value-added ($3,030.288 million) followed by ‘Manufacturing’ ($2,034.172 million) and ‘Financial & Insurance Services ($1,796.933 million).
CHART 17 VALUE-ADDED
Page | 18
Regional Exports data represents the value of goods and services exported outside of the region that have been generated by industry sectors within the region. Chart 12 depicts the contribution to total regional exports generated by each of the industry sectors ranked from highest to lowest.
The total regional export estimate for Gold Coast (C) is $9,727.589 million. The ‘Manufacturing’ sector has the highest contribution to regional exports ($3,558.740 million) followed by ‘Accommodation & Food Services’ ($1,092.567 million) and ‘Rental, Hiring & Real Estate Services’ ($941.274 million).
R
EGIONAL IMPORTS BY INDUSTRY
Regional Imports data represents the value of goods and services imported into the region by businesses / organisations in each of the industry sectors. Another way of defining imports is as an outflow of money from the region.
The total regional import estimate for Gold Coast (C) is $9,258.208 million. The ‘Manufacturing’ sector has the highest level of regional imports of $4,395.236 million, followed by ‘Accommodation & Food Services’ ($703.318 million) and ‘Construction’ sector ($690.843 million).
CHART 16 GOLD COAST REGIONAL IMPORTS
Imports reflect demand in the region’s economy for goods and services not supplied locally and represent ‘Gaps’ in local supply chains. Many of the goods and services imported from overseas are priced at a level making substitution with local supply unlikely and in instances, unfeasible. However, imports from the rest of Australia may indicate opportunities for import replacement, increased value-adding and supply chain development in your region. Supply of these goods and services is currently feasible in the Australian context and may provide a guide to realistic, high value strategic opportunities to further develop the local economy. While the total replacement of imports with local production is improbable, it may be possible to capture a proportion of this escape expenditure.
Page | 19
Page | 19
V
ALUE
-
ADDED BY INDUSTRY
Value-Added data represents the marginal economic value that is added by each industry sector in a defined region.
Value-Added can be calculated by subtracting local expenditure and expenditure on regional imports from the output generated by an industry sector, or alternatively, by adding the wages and salaries paid to local employees, the gross operating surplus and taxes on products and production.
Value-Added by industry sector is the major element in the calculation of Gross Regional Product. The total value-added by the Gold Coast economy is estimated at $19,575.332 million. ‘Rental, Hiring & Real Estate Services’ contributes the highest value-added ($3,030.288 million) followed by ‘Manufacturing’ ($2,034.172 million) and ‘Financial & Insurance Services ($1,796.933 million).
Page | 20
Page | 21O
UTPUT ATTRIBUTABLE TO TOURISM
Tourism output has been estimated to be $3,195.840 million, the following chart shows the gross revenue generated by businesses and organisations in Gold Coast to service demand generated by tourists to the area.
CHART 19 OUTPUT ATTRIBUTABLE TOURISM
E
MPLOYMENT ATTRIBUTABLE TO TOURISM
The total tourism related employment estimate for Gold Coast is 20,553 jobs. The following chart shows the number of jobs in each industry sector which service demand generated by tourists to the area.
CHART 20 EMPLOYMENT ATTRIBUTABLE TOURISM
Page | 20
G
OLD COAST TOURISM
The tourism industry is an important contributor to the Australian economy. However, the System of National Accounts (SNA) does not capture tourism as a single industry, because of tourism’s diverse products and services. Consequently, Tourism Satellite Accounts (TSA’s) are used to supplement the SNA by measuring the economic contribution of tourism.
The TSA estimates the worth of the tourism sector by combining the contributions of various goods and services across the economy. This then makes it possible to compare the economic contribution of the tourism industry, and its individual sectors, to conventional industries.
(Source: State Tourism Satellite Accounts 2010/11, TRA).
T
OURISM OUTPUT
The estimated output generated by tourism for each industry sector has been deducted and consolidated into a separate tourism sector. The total output estimate for the Gold Coast region is $44,016.708 million, with Tourism contributing $3,195.840 million (7.3%).
Page | 21
Page | 21
O
UTPUT ATTRIBUTABLE TO TOURISM
Tourism output has been estimated to be $3,195.840 million, the following chart shows the gross revenue generated by businesses and organisations in Gold Coast to service demand generated by tourists to the area.
CHART 19 OUTPUT ATTRIBUTABLE TOURISM
E
MPLOYMENT ATTRIBUTABLE TO TOURISM
The total tourism related employment estimate for Gold Coast is 20,553 jobs. The following chart shows the number of jobs in each industry sector which service demand generated by tourists to the area.
Page | 22
Page | 23ACCOMMODATION AND FOOD SERVICES
The number of people employed in the ‘Accommodation and Food Services’ sector has been relatively consistent from 21,653 in June 2002 to 21,899 in June 2012.
However, there was a peak in the number of people employed in this sector of 26,514 in 2009, with the increase occurring during the period of the GFC, considered to be a reflection of an increase in the number of part-time and casual jobs, as well as people entering this sector as an employment option during the GFC.
CHART 23 GOLD COAST ACCOMMODATION & FOOD SERVICES EMPLOYMENT JUNE 2012
0 5,000 10,000 15,000 20,000 25,000 30,000 2002 2003 2004 2005 2006 2007 2008 2009 2010 2011 2012
Accommodation and Food Services
Employment
Source: GCCC Economic Profile
Page | 22
MANUFACTURING
The ‘Manufacturing’ industry sector on the Gold Coast is one of the largest employing sectors. It is estimated that at June 2012 there were 25,666 people employed in this sector, an increase of 7,911 since 2002 (44.6%). This sector can be further broken down into a number of sub-sectors, with the ‘Food Product Manufacturing’ sub-sector having the largest number of ‘Manufacturing’ workers, estimated at 3,943 people, followed by the ‘Transport Equipment Manufacturing’ sub-sector employing 3,464 people.
CHART 21 GOLD COAST MANUFACTURING EMPLOYMENT, JUNE 2012
CONSTRUCTION
Construction is one of the major industries on the Gold Coast, with the current employment estimate being 28,828. Although this is below the peak from earlier years, it has remained fairly constant due to the region’s continued population expansion. Between 2002-2012 this sector has increased by 50.3%.
CHART 22 GOLD COAST CONSTRUCTION EMPLOYMENT JUNE 2012
0 5,000 10,000 15,000 20,000 25,000 30,000 2002 2003 2004 2005 2006 2007 2008 2009 2010 2011 2012
Manufacturing Employment
0 5,000 10,000 15,000 20,000 25,000 30,000 35,000 40,000 20 02 20 03 20 04 2005 2006 2007 2008 2009 2010 2011 2012Construction Employment
Source: GCCC Economic Profile
Page | 23
Page | 23
ACCOMMODATION AND FOOD SERVICES
The number of people employed in the ‘Accommodation and Food Services’ sector has been relatively consistent from 21,653 in June 2002 to 21,899 in June 2012.
However, there was a peak in the number of people employed in this sector of 26,514 in 2009, with the increase occurring during the period of the GFC, considered to be a reflection of an increase in the number of part-time and casual jobs, as well as people entering this sector as an employment option during the GFC.
CHART 23 GOLD COAST ACCOMMODATION & FOOD SERVICES EMPLOYMENT JUNE 2012
0 5,000 10,000 15,000 20,000 25,000 30,000 2002 2003 2004 2005 2006 2007 2008 2009 2010 2011 2012
Accommodation and Food Services
Employment
Page | 24
Page | 25EDUCATION AND TRAINING SERVICES
The ‘Education and Training Services’ sector has emerged as one of the largest sectors on the Gold Coast with 17,119 people employed.
Over the period from 2002 to 2012, the overall growth trend has been strong.
The chart below shows that numbers have been steadily increasing. Since 2002 this sector has increased by 5,408 (46.2%) on the Gold Coast.
CHART 25 GOLD COAST EDUCATION & TRAINING EMPLOYMENT JUNE 2012
0 2,000 4,000 6,000 8,000 10,000 12,000 14,000 16,000 18,000 20,000 2002 2003 2004 2005 2006 2007 2008 2009 2010 2011 2012
Education and Training Employment
Source: GCCC Economic Profile
Page | 24
HEALTH CARE AND SOCIAL ASSISTANCE SERVICES
‘Health Care and Social Assistance’ is one of the largest sectors on the Gold Coast with 25,196 people employed in this sector.
Although there appears to have been a decrease in the number of workers in June 2012, the overall growth trend is strong and is expected to continue with the aging demographic on the Gold Coast. Since 2002 this sector has increased by 9,079 (56.3%) on the Gold Coast.
CHART 24 GOLD COAST HEALTH CARE & SOCIAL ASSISTANCE SERVICES EMPLOYMENT JUNE 2012
0 5,000 10,000 15,000 20,000 25,000 30,000 2002 2003 2004 2005 2006 2007 2008 2009 2010 2011 2012
Health Care and Social Assistance
Employment
Page | 25
Page | 25
EDUCATION AND TRAINING SERVICES
The ‘Education and Training Services’ sector has emerged as one of the largest sectors on the Gold Coast with 17,119 people employed.
Over the period from 2002 to 2012, the overall growth trend has been strong.
The chart below shows that numbers have been steadily increasing. Since 2002 this sector has increased by 5,408 (46.2%) on the Gold Coast.
CHART 25 GOLD COAST EDUCATION & TRAINING EMPLOYMENT JUNE 2012
0 2,000 4,000 6,000 8,000 10,000 12,000 14,000 16,000 18,000 20,000 2002 2003 2004 2005 2006 2007 2008 2009 2010 2011 2012
Education and Training Employment
Page | 26
Page | 27 CHART 27 GOLD COAST CHANGE IN OCCUPATION 2006 TO 2011The above graph highlights the change in occupation between 2006 and 2011. (Data has been illustrated for changes that were greater than 400 workers over the period).
Page | 26
O
CCUPATIONS AND QUALIFICATIONS
The workforce’s skill level is increasing, with professionals and managers accounting for a higher share of the overall Gold Coast workforce.
Based on the 2011 Census, 31% of the region’s workforce (people working in the region) was classified by the ABS as either ‘Managers’ or ‘Professionals’, an increase from 28.7% from the 2006 Census.
In 2011, ‘Professionals’ accounted for the highest proportion of occupations, 18.5%, an increase from 15.9% in 2006.
‘Technicians and Trade Workers’ accounted for the second highest proportion in 2011 (13.4%), a decrease from the 14.7% in 2006.
CHART 26 GOLD COAST OCCUPATION PROFILE 2006 & 2011
The above chart has been further broken down in Chart 27 to demonstrate the change by Occupation sub-sector, highlighting the increase in workforce numbers particularly for ‘Health Professionals’, ‘Education Professionals’ and ‘Specialist Managers’.
Page | 27
Page | 27 CHART 27 GOLD COAST CHANGE IN OCCUPATION 2006 TO 2011
The above graph highlights the change in occupation between 2006 and 2011. (Data has been illustrated for changes that were greater than 400 workers over the period).
Page | 28
Page | 29 CHART 29 REGIONAL EMPLOYMENT PROJECTIONS BY INDUSTRY, 2011 TO 2031Developing and attracting the appropriate skills and educated workforce and managing the redeployment of workers between these industry sectors will not only be a regional issue, but an issue facing Queensland in general. In a workforce planning study and forecast workforce change report conducted by Deloitte Access Economics for RDA Sunshine Coast, the report finds that due to the ageing of the population and therefore retirement from the workforce, that Queensland overall will see a significant shortage of labour from about 2020.
The growth in employment across service-related industries is expected to generate a strong demand for professional and skilled workers in the Gold Coast Region over the next two decades.
Source : SGS Economics & Planning, July 2013
Page | 28
E
MPLOYMENT OUTLOOK FOR THE REGION
SGS Economics & Planning recently completed a study for RDA Gold Coast and the forecast workforce change is shown in the chart below.
CHART 28 REGIONAL EMPLOYMENT PROJECTIONS, 2011 TO 2031
The workforce on the Gold Coast is forecast to expand by 50.6% from 236,395 in 2011 to 355,895 by 2031. Over the same period the population of the Gold Coast is projected to increase by 46.7%,
compared to 43% projected increase for Queensland4. As a share of total Queensland employment, the
Gold Coast region has recorded a gradual rise over the past decade from 10.6% in 2001 to 11.4% in 2011.
Given that population and employment growth on the Gold Coast has outpaced the State average in the past, and population growth is expected to continue to be higher on the Gold Coast than for Queensland, growth in labour demand in the Gold Coast region is expected to generally outpace growth in Queensland over the forecast period.
At the industry level (as shown in the following chart), by 2031, the ‘Health Care and Social Assistance’; Retail Trade’ and ‘Accommodation and Food Services’ industry sectors are projected to account for the largest employing industries on the Gold Coast.
Between 2011 and 2031 the largest growth sectors include ‘Health Care and Social Assistance’, ‘Mining’, ‘Financial and Insurance Services’ and ‘Finance and Insurance Services’.
The ‘Agriculture, Forestry and Fishing’ and ‘Manufacturing’ industry sectors are likely to see reductions in the number of jobs on the Gold Coast.
4Queensland Government population projections, 2011 edition (medium series), Office of Economic and Statistical Research, Queensland Treasury
and Trade.
Source : SGS Economics & Planning, July 2013. 150,000 200,000 250,000 300,000 350,000 400,000 2011 2016 2021 2026 2031
Page | 29
Page | 29 CHART 29 REGIONAL EMPLOYMENT PROJECTIONS BY INDUSTRY, 2011 TO 2031
Developing and attracting the appropriate skills and educated workforce and managing the redeployment of workers between these industry sectors will not only be a regional issue, but an issue facing Queensland in general. In a workforce planning study and forecast workforce change report conducted by Deloitte Access Economics for RDA Sunshine Coast, the report finds that due to the ageing of the population and therefore retirement from the workforce, that Queensland overall will see a significant shortage of labour from about 2020.
The growth in employment across service-related industries is expected to generate a strong demand for professional and skilled workers in the Gold Coast Region over the next two decades.
Page | 30
Page | 31E
DUCATION
Education is one of the key drivers of the region’s social, cultural and economic development and is recognised as a fundamental human right. Formal education on the Gold Coast is primarily provided through government and non-government schools, tertiary education, including TAFE, and private and public universities and campuses, as well as various business and training colleges.
The Gold Coast has close to 100 state and independent schools, four universities and six TAFE campuses contributing towards educational opportunities in the region.
Griffith University, Bond University, Southern Cross University and Central Queensland University each have a campus on the Gold Coast which collectively attracts over 25,519 full and part time students, including over 6,800 overseas students. Additionally, Gold Coast TAFE attracts close to 17,000 students, including over 700 overseas students.
The Australian Bureau of Statistics 2011 and Gold Coast Community Profile, show the following levels of qualifications in the region:
Among the Gold Coast population, fewer people have a degree or higher (17.8%) versus
Queensland (19.8%) but the gap is has been decreasing over time. From 13.8% in Gold Coast in 2006 and 16.6% of Queensland in 2006.
Among 15-24 year olds 22.4% are attending ‘University or other Tertiary Institution’ compared
with a Queensland average of 16.2%. This is a substantial increase from 2006 when only 13.6% of Gold Coast residents in this age group were attending university.
The following graph shows the qualification levels for Gold Coast residents for 2006 and 2011. There has been a steady growth in the levels of qualifications that have been attained.
CHART 31 GOLD COAST QUALIFICATIONS 2006 TO 2011
Page | 30 CHART 30 GOLD COAST REGION GROWTH IN EMPLOYMENT BY OCCUPATION, 2011 TO 2031 (%)
As the above chart shows, over the next 20 years, the demand for ‘Community and Personal Service Workers’, ‘Sales Workers’ and ‘Professionals’ is expected to be particularly strong over the period, supported by ‘Clerical and Administrative’ workers and growth in ‘Managers’ and ‘Labourers’.
The Gold Coast has a diverse economic base, with the projected employment growth for the region is expected to increase by 50.6% between 2011 and 2031, this growth will be heavily driven by population growth and the tourism sector. The growth to meet the continued demand from these population serving sectors will continue to be major drivers for the region.
E
MPLOYMENT OPPORTUNITIES
The Gold Coast requires suitable employment to be generated to accommodate the demand for employment during the key stages of the lifecycle, including key employment growth areas for families. The types of jobs created will also need to be attractive for these segments, i.e. family-friendly, good wages and opportunities for advancement.
A greater emphasis will be needed to reduce the level of youth unemployment and actively work toward a target unemployment rate below the State average.
Another area requiring focus is working with the business community to use the skills and experience available in the older demographic groups. Many people close to retirement or semi-retired in this region have exceptional skills and experience that could be better used.
There is also value in increasing opportunities for the older population to take on new skills and learning opportunities that can lead to employment options.
Page | 31
Page | 31
E
DUCATION
Education is one of the key drivers of the region’s social, cultural and economic development and is recognised as a fundamental human right. Formal education on the Gold Coast is primarily provided through government and non-government schools, tertiary education, including TAFE, and private and public universities and campuses, as well as various business and training colleges.
The Gold Coast has close to 100 state and independent schools, four universities and six TAFE campuses contributing towards educational opportunities in the region.
Griffith University, Bond University, Southern Cross University and Central Queensland University each have a campus on the Gold Coast which collectively attracts over 25,519 full and part time students, including over 6,800 overseas students. Additionally, Gold Coast TAFE attracts close to 17,000 students, including over 700 overseas students.
The Australian Bureau of Statistics 2011 and Gold Coast Community Profile, show the following levels of qualifications in the region:
Among the Gold Coast population, fewer people have a degree or higher (17.8%) versus
Queensland (19.8%) but the gap is has been decreasing over time. From 13.8% in Gold Coast in 2006 and 16.6% of Queensland in 2006.
Among 15-24 year olds 22.4% are attending ‘University or other Tertiary Institution’ compared
with a Queensland average of 16.2%. This is a substantial increase from 2006 when only 13.6% of Gold Coast residents in this age group were attending university.
The following graph shows the qualification levels for Gold Coast residents for 2006 and 2011. There has been a steady growth in the levels of qualifications that have been attained.
Page | 32
Page | 33 CHART 32 GROSS REGIONAL PRODUCT BY INDUSTRY, 2011/12Source: REMPLAN Economy, utilising 2011 ABS Census; 2008/09 ABS National Input Output Tables, June 2012 ABS Gross State Product; 2011-12 ABS Tourism Satellite Account
Page | 32
S
USTAINABLE
(
ECONOMIC
,
ENVIRONMENTAL AND SOCIAL
)
COMMUNITIES AND POPULATION GROWTH
T
HE ECONOMIC VALUE OF THE REGION
The Gold Coast region’s gross regional product (GRP) has been growing strongly over the last 20 years, although growth has slowed recently due to the GFC. The size of the region’s economy is estimated by
REMPLAN5 to be$21.378 billion, accounting for 7.5% of Queensland’s $283.6 billion GRP.
Key drivers of this economic growth have been:
Strong population increases on the Gold Coast
Growth in key coastal industries such as tourism, retail and construction
Attracting a more flexible workforce
This economic activity supports approximately 60,015 businesses on the Gold Coast6; 22.3% of these
businesses have between one and four employees. The number of employees per business is lower than the Queensland average of 22.5%. Within the Gold Coast, 64.8% of businesses do not employ any staff (“non employing” businesses), which is comparable to the State average of 62.3%
T
HE
E
CONOMIC
V
ALUE BY
I
NDUSTRY IN THE
R
EGION
(I
NCLUDING THE
T
OURISM
S
ECTOR
)
Chart 32 ‘Gross Regional Product by Industry, 2011/12’ shows ‘Ownership of Dwellings’ has the highest value-added by industry on the Gold Coast, estimated to be worth $2,082 million in 2011/12.
Other strong performers include ‘Manufacturing’ ($2,005 million); ‘Financial & Insurance Services’ ($1,797 million) and ‘Health Care & Social Assistance’ ($1,524 million).
The impact of strong population increases is evident in other industry sectors, with ‘Construction’, ‘Retail Trade’; ‘Education’ having a relatively high GRP on the Gold Coast.
Tourism is a strong industry on the Gold Coast adding $1,430 million to total GRP.
5 REMPLAN Economy utilising ABS National Input Output Tables 2008/2009, ABS Gross State Product June 2011; 6 June 2012
Page | 33
Page | 33 CHART 32 GROSS REGIONAL PRODUCT BY INDUSTRY, 2011/12
Source: REMPLAN Economy, utilising 2011 ABS Census; 2008/09 ABS National Input Output Tables, June 2012 ABS Gross State Product; 2011-12 ABS Tourism Satellite Account
Page | 34
Page | 352011
I
NDUSTRY PROFILE
–
BUSINESS NUMBERS
The Gold Coast has a higher proportion of construction industry businesses compared to the Queensland average (20.2% and 18.3%, respectively), which reflects its importance in the region. ‘Rental, Hiring & Real Estate Services’ businesses have a higher representation on the Gold Coast than Queensland (14.5% and 11.2%, respectively). The ‘Transport, Postal and Warehousing’ business sector is underrepresented on the Gold Coast with 4.8% of businesses compared to 6.1% in Queensland. The Coast has a below average number of agricultural business of 1.6% compared to 10.0% for Queensland.
CHART 34 GOLD COAST INDUSTRY BUSINESS PROFILES – 2011
Page | 34
G
ROWTH INDUSTRIES
The largest industries have been growing at impressive rates; ‘Health Care & Social Assistance’ has increased by 38.3%, ‘Financial & Insurance Services’ by 30.6%, ‘Education & Training’ by 22.6% and ‘Retail Trade’ 19.9%.
Over the six year period, which includes the impact of the Global Financial Crisis (GFC) on the Gold Coast, there were four sectors which experienced negative growth, including ‘Construction’ (-9.1%), ‘Accommodation & Food Services’ (-9.6%), ‘Manufacturing’ (-28%) and ‘Mining’ (-34.4%). Chart 33 represents the changes in Value-added across industry sectors.
CHART 33 CHANGE ($M) VALUE-ADDED7 BY INDUSTRY, 2006-2012
While the ‘Construction’ sector has experienced a decline in value-added from 2006 to 2012, this sector is one of the largest contributors to GRP (see Chart 32) and remains a strong driver of the Gold Coast economy. The impact of strong population increases and an ageing demographic is evident in the strong increase in the ‘Health Care and Social Assistance’ sector.
7 Value-Added data represents the marginal economic value that is added by each industry sector in a defined region. Value-Added can be calculated
by subtracting local expenditure and expenditure on regional imports from the output generated by an industry sector, or alternatively, by adding the Wages & Salaries paid to local employees, the gross operating surplus and taxes on products and production. Value-Added by industry sector is the major element in the calculation of Gross Regional Product.
Page | 35
Page | 35
2011
I
NDUSTRY PROFILE
–
BUSINESS NUMBERS
The Gold Coast has a higher proportion of construction industry businesses compared to the Queensland average (20.2% and 18.3%, respectively), which reflects its importance in the region. ‘Rental, Hiring & Real Estate Services’ businesses have a higher representation on the Gold Coast than Queensland (14.5% and 11.2%, respectively). The ‘Transport, Postal and Warehousing’ business sector is underrepresented on the Gold Coast with 4.8% of businesses compared to 6.1% in Queensland. The Coast has a below average number of agricultural business of 1.6% compared to 10.0% for Queensland.
Page | 36
Page | 37D
WELLING APPROVALS AND CONSTRUCTION
The number of residential dwelling approvals has varied significantly over the last 10 years from a high of 6,937 in 2006-07 to the lowest total number of 2,277 approvals in 2011-12. Prior to the peak in the market in 2006-07 the majority of approvals were for ‘other’ dwelling approvals, eg, attached dwellings, such as units. Since this market peak, the number of house approvals has been relatively consistent, with the unit market approvals experiencing significant shift from 3,467 in 2007-08 to 942 in 2011-12.
CHART 36 GOLD COAST DWELLING APPROVALS
CHART 37 GOLD COAST VALUE OF CONSTRUCTION
Source: State of the Regions 2013-14, National Economics / Australian Local Government Association
864 750 702 963 1,311 882 583 2,907 2,725 2,239 1,680 1,314 2,343 2,132 Page | 36
T
OURISM
Tourism is a major industry which generates a large number of visitors to the region.
Based on data from Tourism Research Australia, there were over 11 million visitors to the Gold Coast in the year to June 2012. This is comprised of 7,041,000 domestic day visitors, 3,402,000 domestic overnight visitors and 747,000 international visitors.
The Gold Coast accounts for 19.4% of all Queensland’s visitors including 18.9% of day trippers, 18.5% of domestic overnight visits and 38.2% of International visitors to Queensland.
In the last year the number of domestic overnight visitors increased by 1.2%; day trippers decreased by 4.2%, while the international market weakened by -1.1%.
CHART 35 GOLD COAST TOURISM VISITOR NUMBERS, 2007/08 – 2011/12
Domestic Visitors
Day trippers account for 67.4% of total domestic visitor numbers.
Domestic expenditure for the gold Coast region was $3.759 billion, with 80.1% attributed to
overnight visitors.
International Visitors
International visitor numbers from two of the Gold Coast’s key source markets, Japan and New
Zealand, declined by 13.1% and 1.7% respectively.
There was an 18.7% increase in the number of visitors from China.
International visitor expenditure was $776 million for 2011/12, accounting for 22% of total
Queensland international tourism expenditure.
Visitor numbers, in particular the domestic visitor market, have been strong over the last five years.
Source: National Visitor Survey and International Visitor Survey
650,000 700,000 750,000 800,000 850,000 900,000 2007-08 2008-09 2009-10 2010-11 2011-12
International Visitor Numbers
8,000,000 8,500,000 9,000,000 9,500,000 10,000,000 10,500,000 11,000,000 2007-08 2008-09 2009-10 2010-11 2011-12
Page | 37
Page | 37
D
WELLING APPROVALS AND CONSTRUCTION
The number of residential dwelling approvals has varied significantly over the last 10 years from a high of 6,937 in 2006-07 to the lowest total number of 2,277 approvals in 2011-12. Prior to the peak in the market in 2006-07 the majority of approvals were for ‘other’ dwelling approvals, eg, attached dwellings, such as units. Since this market peak, the number of house approvals has been relatively consistent, with the unit market approvals experiencing significant shift from 3,467 in 2007-08 to 942 in 2011-12.
CHART 36 GOLD COAST DWELLING APPROVALS
CHART 37 GOLD COAST VALUE OF CONSTRUCTION
Source: State of the Regions 2013-14, National Economics / Australian Local Government Association
864 750 702 963 1,311 882 583 2,907 2,725 2,239 1,680 1,314 2,343 2,132
Page | 38
Page | 39C
LIMATE CHANGE
The City of Gold Coast is defined by spectacular beaches, hinterland ranges, forests and waterways. Our city is a celebration of nature.
Following is a snapshot of our unique natural assets and values8:
The Gold Coast is home to more than 1,800 recorded species of native plants and more than 700
recorded species of native animals
75 native vegetation types and 58 regional ecosystem types have been mapped and described
for the City of Gold Coast
49.1% of the city's land area (63,678 hectares) is covered in native vegetation
82% of the city's vegetated areas classified as being of State Significance; 10% as being
of Regional Significance; and 8% as being of Local Significance
Almost 10% of the city's land area is managed by Council for nature conservation. One-third of
this land has been acquired through the Open Space Preservation Levy Acquisition Program
Council's Voluntary Conservation Agreement and Land for Wildlife Schemes cover 2.8% of the
city's land area (3,680 hectares)
The Gold Coast's coastal wetlands and islands form part of the Ramsar site which recognises and
protects wetlands of international significance
The Springbrook and Lamington plateaus form part of the Border Ranges group of World
Heritage-listed Gondwana Rainforests of Australia, protecting areas of extremely high species diversity.
The dynamic nature of the Gold Coast – its location, growth, development and demand for services – makes its exposure to climate change particularly unique. Protection of our natural assets, strengthening the economy, population growth and building sustainable communities are some of the
region’s biggest challenges. These challenges are all affected by the potential impact of climate change9.
According to the Gold Coast Council10, the Gold Coast has the following exposure to climate change:
a range of 18-79 centimetres increase in sea level by 2100
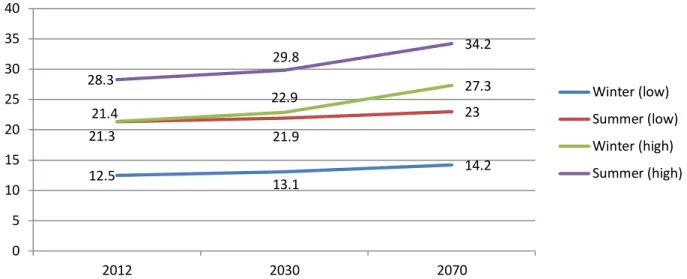
an increase in annual average temperature of 1.1° - 4.4° Celsius by 2070
an increase in the number of days over 35° Celsius up to 14 days per annum by 2070
an increase in 1-in-100 year storm surge height by 0.35 metres, and
an increase in extreme rainfall intensity for 2-hour events of 46 per cent by 2070
Risks as