Providing a Hybrid Methodology to Solve the
Supplier Selection Problems: Application of
MCDM Techniques
Agus Widodo1, Pinar Aytekin2 , Shahryar Ghorbani3, Media Rahmawati4 1,4Department of Mathematics, Brawijaya University, Indonesia
2Department of Business Administration, Faculty of Economics and Administrative Science, Izmir Democracy
University, Turkey
3Department of Production Management, Faculty of Management, Sakarya University, Turkey
1[email protected] 2[email protected]
3[email protected] 4[email protected]
Abstract— The emphasis of supply chain management
(SCM) is majorly on the relationship between enterprise alliance and core enterprise. One of the main decision-making problems in SCM is choosing strategic partners, which also is the key to a prosperous SCM. The initial step of the assessment is the recognition of assessment criteria which potential supplier will be assessed. The aim of this paper is to develop an AHP simulation methodology to handle SCM problems in choosing the best supplier based on several criteria that has been set up. In the present study, SCM is investigated using the analytical hierarchy process (AHP) simulation approach to examine the uncertainty involved in AHP and reduce its risk to some extent. Finally, The results demonstrate that the important criterion is quality and the best supplier is supplier 4.
Keywords—SCM, Uncertainly, AHP, Simulation, Topsis.
1.
Introduction
Among several available decision-making techniques, Analytical Hierarchy Process (AHP) technique has proven to be a useful and facile method in solving decision-making problems. Several researchers have considered AHP as a practical and efficient multi-criteria decision analysis tool in several fields such as Supply Chain Management (SCM) [25]-[28], [15] [11]. SCM, as a prevalent issue in academic studies, was firstly introduced by American Supply Chain Association. The supply chain includes all efforts that are made to produce or deliver a given final service or product offered by suppliers to customers. SCM is built upon
a decision-making problem [10]. As the integral components of the supply chain, the suppliers’ performance affects the advantages of the core enterprise in the supply chain as well as determining whether a mutually beneficial result can be achieved. Hence, supplier selection is a crucial problem and severe problem, at the same time. To the best of our knowledge, implementing this technique enables solving the key (and per se tough) problems involved in selecting a supplier in SCM. Accordingly, in the present work, we developed an AHP simulation methodology to handle SCM problems.
Despite numerous advantages of AHP in several aspects, the uncertainty involved in this approach affects the obtained results. Preference matrix is the core of AHP. This matrix consists of a pair wise comparison including some subjective and uncertain factors. To manage this issue, the uncertainty problem has been investigated by several authors. In this regard, the concept of “judgmental uncertainty” was initially proposed by [25]. Later, [31] elaborated it by assuming that the pairwise comparisons are random variables. Vargas and Saaty analytically demonstrated the mechanism by which uncertainty influences the Alternative ranks Vargas studied the incorporation of judgmental uncertainty in the AHP framework.
This study, however, suffered from some methodological limitations including complicated algorithm, overestimation of the uncertainty rank, and neglecting the probability distribution underlying the judgmental uncertainties. Later, [23] conducted a simulation approach in which they investigated the outcomes of risk in the AHP. Based on the obtained results, they proposed an AHP ______________________________________________________________
International Journal of Supply Chain Management
IJSCM, ISSN: 2050-7399 (Online), 2051-3771 (Print)
simulation approach to analyzing the uncertainty involved in AHP. This efficient approached to handle the drawbacks of traditional AHP technique and allowed reducing the amount of uncertainty in AHP. In the present study, we investigate the application of this technique in SCM [35]. Despite several models available for a decision-making problem, AHP simulation is preferred because of its capability in handling the uncertainty involved in the decision-making process. As mentioned earlier, the present study was conducted to offer an AHP simulation model for choosing suppliers in SCM.
The remainder of this paper is written as follows. Section II presents the literatures review, section III presents the methodology of the AHP approach in solving the SCM problem. In Section IV, TOPSIS technique, V will present the application. Section VI discuss about a question specific to supplier selection in SCM is presented to examine the mentioned uncertainty using an AHP simulation approach. Finally, some conclusions are made in Section VII.
2.
Literatures Review
One of the management decision-making processes has been considered to be the supplier evaluation, which reflects the way of selection of the suppliers by the organizations for enhancing their competitive advantages. Notably, so far, investigations of the supplier selection have emphasized the identification of the criteria employed for selecting the suppliers. For example, [20] has been among the first researchers who studied the supplier selection. He determined 23 suppliers' criteria, which managers considered while selecting a supplier. Then, he mentioned quality, on-time delivery, as well as the performance history as the most considerable attributes. In their study, ref. [20] also showed that reliability, delivery, supplier's reputation, and price as the major features influencing the decisions of the supplier selection were. In another investigation, [33] categorized papers reported between 1966 and 1990 based on the mentioned features. Considering the multi-criteria character of the supplier selection problem, using the MCDM procedures to the problem has appeared as one of the beneficial areas of study. These methods allowed the buyers to have a systematic examination of the trade-offs amongst diverse features while choosing particular suppliers. However, with the involvement of the firms in the strategic cooperation with their suppliers, one of the newly developed sets
of the supplier selection criteria called the soft criteria should be taken into account in making the decision of the supplier selection. Such criteria have been considered to be the subjective parameters difficult to be quantified. Moreover, the fuzzy set theory has appeared as one of the efficient tools for addressing uncertainties inherent in the supplier selection procedure. Therefore, the present section concisely reviewed the studies on the supplier selection, which employed the QFD-based as well as fuzzy MCDM procedures.
It should be mentioned that multiple investigations utilized the fuzzy MCDM procedures like the fuzzy analytic network process (ANP), fuzzy analytic hierarchy process (AHP), fuzzy multi-criteria optimization and compromise solution (VIKOR), fuzzy method for the order preference using the similarities to the ideal solution (TOPSIS), and fuzzy preference ranking organization method for enrichment of evaluation (PROMETHEE). In their study, [6] devised a procedure for the supplier selection on the basis of the utilization of the fuzzy suitability index. Moreover, [7] illustrated the problem of the supplier selection in an e-procurement context so that the fuzzy AHP has been utilized for determining the most viable supplier. In addition, [12] utilized the TOPSIS to develop a method for resolving the problem of the supplier selection in the fuzzy environment. Moreover, [19] dealt with the determination of the decision criteria like the risk factors of developing an effective mechanism for the global supplier selection. It is notable that the researchers utilized the fuzzy extended AHP-based procedure in the selection process. Furthermore, [29] utilized a fuzzy modified AHP method for the selection of the most acceptable global supplier and studied the sustainability features in the evaluation procedure. Finally, [13] proposed a hierarchical MCDM model in the fuzzy context for the evaluation and selection of the suppliers [17].
In addition, researchers devised integrated MCDM techniques-based strategies for selecting the most adequate supplier. In this regard, [8] presented one of the integrated supplier selections and multi-echelon distribution inventory models, which utilized the genetic algorithm (GA) and fuzzy AHP. Moreover, [30] devised another supplier selection approach, which integrated fuzzy linear programming and AHP. Furthermore, [15] proposed a fuzzy MADM method for the problem of the supplier selection. They initially utilized the
interpretive structural modeling for determining the association amongst the sub-criteria. Consequently, the researchers utilized the fuzzy AHP for computation of the relative weights for all criteria. Ultimately, [35] applied the fuzzy integral for identifying the fuzzy synthetic function and estimated the rank order of alternative suppliers. Therefore, they provided a hierarchical supplier assessment framework, which combined the Choquet integral and ANP. As a result, [3] presented a hybrid model based on the ANP for evaluating and selecting the supplier under fuzzy environment. Notably, their method improved with a non linear programming model for eliciting the weights of comparison from the comparison matrices in the ANP structure.
Even though the last investigations presented strategies for the supplier selection procedure, future research should focus on the integration of the vague data on the significance of the bought product characteristics, the association between the bought product characteristic sand the supplier evaluation criteria, and dependency between the supplier evaluation criteria into the analyses. Therefore, a reasonable decision aid for the supplier selection must target the correction of the problem of the information loss in a case of the calculation with the linguistic variables.
3.
Methodology
To start the method of this study, let us assume a scenario in which an organization in a supply chain encounters a multidimensional problem in which it has to select the best supplier out off our suppliers. In such a problem, the AHP simulation approach is preferred because of overcoming the limitations of AHP and its technical feasibility.
In most cases, the pair wise comparisons of the decision maker may lead to some extent of uncertainty. In the present work, we comply with the original principles of AHP except that we assign a contiguous scale ranging from 1 to 9 to the paired comparison matrices [26]. In this way, we would be able to see the rank reversal probability within a wide range of inconsistency and uncertainties (from 2% to 20%). We assume the whole change in the paired comparison matrix is due to the doubts expressed by the individual decision maker about his/her judgment accuracy.
There are two sources (i.e., external and internal) for such a judgmental uncertainty in SCM [16]. A difficulty with an external source contains the
environment or procedure for gathering preference data from the suppliers. On the other hand, an internal reference indicates the ambiguity and uncertainty caused due to the insufficient amount of information available to the decision-makers and their familiarity with the problem. In any supply chain, information plays a pivotal role not only on the utilization of resources but also on the cooperation among enterprises. Nevertheless, the informational risk cannot be avoided considering the insufficient or dissymmetric information. Both resources can result in rank reversals and consequently degrade the confidence of decision-makers upon the results of the AHP. However, a primary assumption when using this type of model is the normal distribution of the quality, credibility, and effectiveness of the suppliers in SCM. After carefully considering all principles of the suppliers, the decision maker employs a pairwise comparison among the suppliers and imports his/her qualified preferences in a partiality matrix 𝐀 with dimensions of 4 × 4. Here, it is assumed that every section Aij of the matrix is related to it with a specific amount of standard deviation (𝜎), which shows the uncertainty induced by internal and external sources. We seek to calculate the change involved in the first eigenvector 𝜓 of an influenced by the possibilities in
𝐀. For this purpose; the following simulation technique is employed.
Step 1 : The decision of decision maker produces a standard matrix 𝐀: 𝐀 = [𝐴𝑖𝑗], where 𝐴𝑖𝑗 is either a uniform variable ranging from 1 and 9 or is the shared of this variable. 𝐴𝑗𝑖 is assumed to be
1 𝐴𝑖𝑗.
Step 2 : We produce a set of 𝑛 random matrices such that [𝐀1, 𝐀𝟐, … , 𝐀𝑛]. Here, each 𝐀𝑘is achieved by setting up each element of 𝐀 ≥ 1 being normally distributed random variables with standard deviation
𝜎𝑖𝑗 and mean of 𝐴𝑖𝑗. In other words, there is a normal distribution random variable 𝐀𝑘 with a standard deviation of 𝜎𝑖𝑗 and mean of 𝐴𝑗𝑖 for all 𝐴𝑖𝑗≥ 1.
Step 3 : For each 𝐀𝑘, we calculate the first eigenvector𝜓𝑘.
Step 4 : Each 𝜓𝑘is rendered as a result of the random variant 𝜓, which is the original eigenvector of A. The amount of standard deviation 𝜎𝑖 and mean 𝜓𝑖of each element 𝜓 is computed. A collective estimate of the alternative rank’s uncertainty 𝑅𝑈𝑟𝑚𝑠
in 𝜓 is achieved b applying the equation as follows
𝑅𝑈𝑟𝑚𝑠= √ 1 𝑛∑ ( 𝜎𝑗 𝜓𝑗) 𝑛 1 (Gordon, 2008).
Also, we compute the probability of a rank reversal 𝑃𝑟𝑒𝑣 via testing each 𝜓𝑘and comparing it with 𝜓, which is the original eigenvector of A. Here, we consider the ranking reversal of any two alternatives is regarded to be a rank reversal. To calculate the probability, we followed the instructions in (Mirahmadia, 2012).
Step 5 : The steps above (1 to 4) produced 𝑃𝑟𝑒𝑣 and 𝑅𝑈𝑟𝑚𝑠 for an alternative A. To generalize the obtained results to any A, these steps should be used in a higher number of random matrices. Note that
𝑅𝑈𝑟𝑚𝑠 is the mean of 𝑃𝑟𝑒𝑣 for a big example from randomly generated A matrices.
𝑅𝑈𝑟𝑚𝑠 and 𝑃𝑟𝑒𝑣 denote the uncertainty involved in the preference matrix. When the calculation outputs are quite high, one can conclude that the uncertain reliability of the principal eigenvector 𝜓𝑘. Thus, it can be stated that the confidence of the ultimate selection is uncertain and should be lowered, which leads to changing the matrix. Hence, it is necessary to examine the supplier selection problem in the uncertain context scientifically.
4.
TOPSIS Technique
The study uses the TOPSIS method. A positive ideal solution maximize the benefit and minimizes the cost criteria, whereas a negative ideal solution maximizes the cost criteria and minimizes the benefit criteria. The steps of TOPSIS is resented as follows:
Step 1 : construct the normalized decision matrix. The normalized value 𝑟𝑖𝑗is calculated as follows: 𝑟𝑖𝑗= 𝑥𝑖𝑗√∑ 𝑥𝑖𝑗2 𝑚 𝑖=1 , 𝑖 = 1,2, … , 𝑚 and 𝑗 = 1,2, … , 𝑛 (1)
Step 2 : Calculate the weighted normalized decision matrix. The weighted normalized value
𝑣𝑖𝑗is calculated as follows:
𝑣𝑖𝑗= 𝑟𝑖𝐷× 𝑤𝑗
𝑖 = 1,2, … , 𝑚 and 𝑗 = 1,2, … , 𝑛
where 𝑤𝑗is the weight of the 𝑗𝑡ℎcriterion and ∑𝑛 𝑤𝑗 = 1
𝑗=1 .
Step 3 : Calculate the positive ideal 𝐴+and negative ideal 𝐴−solutions, where
𝐴+={(max 𝑖𝑣𝑖𝑗|𝑗 ∈ 𝐶𝑏), (mini 𝑣𝑖𝑗|𝑗 ∈ 𝐶𝑐)} = {𝑣𝑗+|𝑗 = 1,2, … , 𝑚} (2) 𝐴−={(min 𝑖𝑣𝑖𝑗|𝑗 ∈ 𝐶𝑏), (maxi 𝑣𝑖𝑗|𝑗 ∈ 𝐶𝑐)} = {𝑣𝑗−|𝑗 = 1,2, … , 𝑚} (3)
Step 4 : Calculate the distance index using the M-dimensional Euclidean distance. In this step the distance index of each alternative from the positive ideal solution and the negative ideal solution, respectively should be calculated, are as follows:
𝑆𝑖+= √∑(𝑣𝑖𝑗− 𝑣𝑗+) 2 𝑚 𝑗=1 , 𝑗 = 1,2, … , 𝑚 (4) 𝑆𝑖−= √∑(𝑣𝑖𝑗− 𝑣𝑗−) 2 𝑚 𝑗=1 , 𝑗 = 1,2, … , 𝑚 (5)
Step 5 : Calculate the relative closeness to the ideal solution. The relative closeness of the alternative 𝐴𝑖 concerning 𝐴+is defined as follows:
𝑅𝐶𝑖+= 𝑆𝑖− 𝑆𝑖++ 𝑆
𝑖−
, 𝑖 = 1,1, … , 𝑚 (6)
Step 6 : Rank the alternatives bythe preference order.
5.
Application
5.1 Background
From the beginning of the 1990s, an ever-increasing IT development, globalization, severe competition, and the constant changes occurred in market demand. As a consequence, enterprises had to lower the costs, to reduce the storage size, to enhance the satisfaction of customers, to improve the quality of offered services, to shorten the delivery date, to increase the efficiency, and to improve the level of competitive advantage. The modern economy, represented by commerce and knowledge economy– has shown significant advances and changes in the trend of enterprise development. In case enterprises can plan and operate internal resources as well as integrating the external resources, they can guarantee their competitive strengths such that to survive in the competitive environment of business. Today, customers are willing to have access to products at any time, any place, the fastest speed, and the lowest price. To supply these needs, enterprises employ the logistic process driven by customers’ services as well as implementing SCM, which is a state-of-the-art management model that is incorporated regarding the economic, technological environments, and social in the modern era. SCM highlights the essential compliant association
between the core enterprise and its alliance. SCM deals with sourcing parts and raw materials, managing demand and supply, inventory transportation and ware housing, production, demand management, distribution through hall markets, and delivery of the product to the consumers. Regarding the globalized market cooperation and competition, SCM is considered as an efficient model of management and firm operation. Because of ever-increasing attention of the enterprises to their core competence, they are reluctant to expend time, money, and effort to the businesses to which they are unfamiliar and thus are not good at them. Such a change also is manifested in the supply chain that provides the services or businesses offered by the firm in the past.
In a seamlessly SCM, to achieve the different target and some benefits, organizations are willing to establish such a strategic cooperative relationship. This strategy provides many benefits to each party and is useful in reducing the total cost and storage size, elevating the level of information sharing, promoting communication, creating better competitive advantages, and preserving a consistent partnership. Accordingly, at every node of the supply chain, it would be possible to enhance and promote the financial situation, qualify, and production, as well as performance and customer satisfaction. It is noteworthy that strategic cooperation needs to pay attention to the cooperation and confidence of the customers. Some operational and managerial failures in enterprises are due to either in stability of suppliers or inner instability of core enterprise. To decline the risk of SCM and the involved costs, decent decisions on supplier selection have to be taken by the enterprises followed by sharing the benefits with the suppliers. Management of supplier might incorporate the credit and reputation of suppliers as well as quality, price, and delivery date of the products. As the target of the enterprise process such as purchasing, marketing, suppliers directly determine the final products quality and raw material bought by the central firm. Moreover, they profoundly affect the competitive advantage of the final produced by the producer or core firm. Hence, using a correct decision-making tool for supplier examination is of great necessity. One primary strategy to reach this goal is the simulation by AHP.
5.2 Supplier’s evaluation criteria
The initial step of the assessment is the recognition of assessment criteria which potential supplier will
be assessed upon. The recognition and examination of criteria for determination and assessment of suppliers has been the focal point of consideration for some academicians and experts. In his major work, Haq et al. (2006) directed a questionnaire survey sent to around 300 business firms, mostly producing firms. The purchasing managers of these organizations were approached to distinguish indexes that were critical for choosing suppliers. His discoveries were partitioned into two classes: supplier choice practices by firms and individuals. Likewise, dependent on the literature, supplier selection criteria shown in table 1:
Table 1. Criteria’s of supplier selection
Criteria References Quality [32], [22], [18] Delivery [32], [19], [2] Service [4], [10], [11] Technical/Engineering Capability [16], [10], [11] Rejection rate [18] Lead-time [21], [10], [11] Reaction to demand change [2], [4], [10], [21] Production capability [4], [10], [11] Price [16], [2], [10] Willingness and Attitude [16], [22], [2], [10] Reputation [16], [2], [10]
Based on the supplier selection literature and interviews with company managers, the evaluation criteria of this research are; Price, Delivery, Quality, Service and Technical Capability, also four suppliers of the case study have analyzed for selection. In this section, an obvious problem is applied to present the method proposed in this study. The case study employed for this purpose is the ABC Mechanical Manufacturing firm; i.e., a core firm in the supply chain. The main shortcoming of this firm is that it suffers from the supplier selection problem. In this regard, the firm has four suppliers which analyzed.
By using AHP, the weight of criteria was calculated to assess the suppliers according to the research criteria. First, built the analytic hierarchy model of the supplier’s selection as figure1:
Figure 1. The hierarchy structure of the supplier’s selection problem
In the next step, the pair-wise matrix calculated for selecting the best supplier. In this step, based on five expert’s opinion, the pair comparison matrix was completed. Consistency check and the weight of criteria was calculated as table2. In this research, the calculation of AHP was done with EXCEL software. The consistency ratio calculated 0.066 that is in the normal domain.
Table 2. Priority vector of criteria
Criteria C1 C2 C3 C4 C5 Priority vector C1 1 3 3 1 1 0.29227 C2 0.33 1 3 1 1 0.18796 C3 0.33 0.33 1 0.33 1 0.09684 C4 1 1 3 1 1 0.23461 C5 1 1 1 1 1 0.18883 𝜆𝑚𝑎𝑥= 5.2931, C.I=0.0733, C.R=0.066
6.
Ranking suppliers with Topsis
Researchers by using the Topsis method, select the best supplier. Each of the expert team evaluated the supplier which the Topsis result showed in Table 3-5.Table 3. Normalized Decision Matrix
S1 S2 S3 S4 C1 0.408379 0.490948 0.540043 0.548225 C2 0.319486 0.465387 0.629245 0.534223 C3 0.412271 0.356479 0.444464 0.710982 C4 0.351024 0.518078 0.513849 0.586802 C5 0.286950 0.471874 0.408107 0.726941
Table 4. Weighted Decision Matrix
S1 S2 S3 S4 C1 0.119247 0.143357 0.157692 0.160082 C2 0.059744 0.087027 0.117669 0.099900 C3 0.040403 0.034935 0.043548 0.069676 C4 0.082140 0.043548 0.120241 0.137312 C5 0.054234 0.069676 0.077132 0.137392
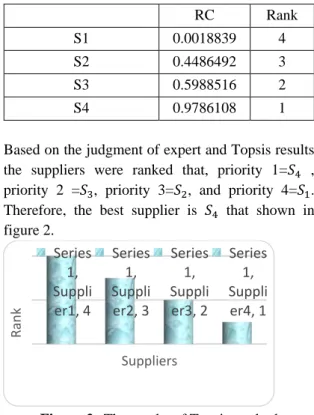
Table 5. Relative Closeness and Ranking of Alternatives RC Rank S1 0.0018839 4 S2 0.4486492 3 S3 0.5988516 2 S4 0.9786108 1
Based on the judgment of expert and Topsis results the suppliers were ranked that, priority 1=𝑆4 , priority 2 =𝑆3, priority 3=𝑆2, and priority 4=𝑆1. Therefore, the best supplier is 𝑆4 that shown in figure 2.
Figure 2. The results of Topsis method
7.
Ranking suppliers with
simulation based AHP
To our knowledge, “the AHP approach models a decision process in a hierarchical manner. At each hierarchy level, the expert has to compare decision criteria and alternatives by the ratio scale. Afterward, we use AHP to determine the relative ranking of alternatives. The ranks of the alternatives are determined using the elements of a preference matrix. Finally, the matrix, which consists of the normalized eigenvector of criteria, compares these alternatives” [10]. The traditional AHP methodology includes three steps:
1) the hierarchy structure; 2) constructing the pairwise judgmental matrices, and 3) inspecting the final rank and consistency ratio.
Hence, we built the Catholic hierarchy mentioned in the present research. As shown in Fig. 1, all preference matrices were 4 × 4, with four matrices at each level. The ratio scale applied in this article is shown in Fig. 2. Here, a normal distribution is assumed for all elements of the preference matrices.
Selecting the best suppliers Technical Capability C5 Quality C1 Price C2 Delivery C3 Service C4
Supplier1 Supplier2 Supplier 3 Supplier4
Series 1, Suppli er1, 4 Series 1, Suppli er2, 3 Series 1, Suppli er3, 2 Series 1, Suppli er4, 1 Ran k Suppliers
1--equally important 1--equally important 3--a little important 1/3--a little unimportant
5-- important 1/5-- unimportant 7--equally important 1/7--very unimportant 9- extremely important 1/9- extremely
unimportant Figure 3. The linguistic variable applied in
building the judgmental matrix
To incorporate four criteria of the four candidate’s supplier, we generated a reciprocal matrix 𝐀, where
𝐀 = [𝐴𝑖𝑗] [ 1 6.414 6.464 1.118 0.156 1 3.990 1.116 0.155 0.251 1 3.763 0.894 0.896 0.266 1 ]
[𝐴𝑖𝑗] denotes the reciprocal matrix used by the experts. Computing the weight of each supplier revealed the following weights 𝑤1= 0.541, 𝑤2= 0.189, 𝑤3= 0.129, 𝑎𝑛𝑑 𝑤4= 0.141. Based on these results, the list of optimum candidate should be chosen by supplier. Nevertheless, some degrees of uncertainty might exist in the experts’ judgment. Hence, to explore the uncertainty involved in the judgmental matrix, we used a set of 𝑛 random matrices { 𝐀1, 𝐀2, … , 𝐀𝑛 }. Here, we assumed that each element of 𝐀 ≥ 1 is a random variable under condition normal distribution. The uncertainty reported by experts and previous study vary within the range of 2% to 20%. As can be seen after calculating Prev and RUums the judgmental uncertainty and probability of rank reversal proportionally correspondent with 𝜎.
Generally, in this specific case, the uncertainty level is low due to the presence of small numerical values. In this connection, one might assume that the judgmental matrix is correct and does not need to be changed. As a result, reinforced confidence is achieved in selecting Supplier 1.
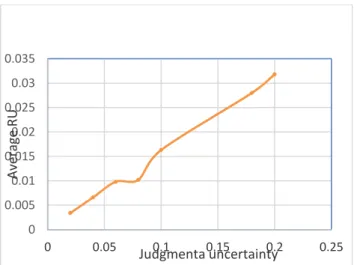
Table 6. The result of AHP-simulation in different uncertainty ratio(σ)using a 4×4 pair-wise Judgmental uncertainty ó Average Prev Average RUums 0.02 0.0027 0.0034 0.04 0.01067 0.0066 0.06 0.018 0.0098 0.08 0.021 0.0102 0.1 0.0279 0.0163 0.18 0.041 0.028 0.2 0.043 0.0318
Figure 4. The behavior of average RUrms in terms of judgmental uncertainty (σ), whichrises in
a 4 × 4 preference matrix
Figure 5. The probability of a rank reversal Prev in terms of judgmental uncertainty (σ), which rises in
a 4 × 4 preference matrix
8.
Conclusion
Among various decision-making methods, AHP approach has emerged as a powerful, simple method for solving many decision-making problems. AHP is implemented in several areas as a practical and efficient tool for multi-criteria decision analysis. In this study, we performed the AHP technique in the field of Supply Chain Management (SCM). SCM is built upon a decision-making problem. As the integral components of the supply chain, the suppliers’ performance affects the core firm in the supply network as well as determining whether a mutually beneficial result can be achieved. Hence, supplier selection is a central problem and severe problem, at the same time. Implementing this technique enables solving the key (and per se tough)
0 0.005 0.01 0.015 0.02 0.025 0.03 0.035 0 0.05 0.1 0.15 0.2 0.25 A ver age RU Judgmenta uncertainty Aver age Pr cv Judgmenta uncertainty
problems involved in selecting supplier in SCM is the main contribution of this paper. Accordingly, in the present work, we developed an AHP simulation methodology to handle SCM problems. The results demonstrate that the important criterion is quality and the best supplier is supplier 4. Hence proposed suggestion as follow:
• This proposed methodology can be used in other fields in any supply chain such as partner selection, location selection problem, and technology selection.
• Classification the criteria was introduced for supplier evaluation and present a comprehensive criterion for selecting the best supplier.
References
[1]. Abramowitz, M., & Stegun, I. A. (Eds.). (1948). Handbook of mathematical functions with formulas, graphs, and mathematical tables (Vol. 55). US Government printing office.
[2]. Ağırgün, B. (2012). Supplier selection based on Fuzzy Rough-AHP and VIKOR. Nevşehir Üniversitesi Fen Bilimleri Enstitüsü Dergisi, 1(2).
[3]. Alimohammadlou, M., & Bonyani, A. (2018). An Integrated Fuzzy Model for Resilient Supplier Selection. Int. J Sup. Chain. Mgt Vol, 7(5), 35.
[4]. Araz, C., & Ozkarahan, I. (2007). Supplier evaluation and management system for strategic sourcing based on a new multicriteria sorting procedure. International journal of production economics, 106(2), 585-606. [5]. Arbel, A., & Vargas, L. G. (1993). Preference
simulation and preference programming: robustness issues in priority derivation. European Journal of Operational Research, 69(2), 200-209.
[6]. Bevilacqua, M., & Petroni, A. (2002). From traditional purchasing to supplier management: a fuzzy logic-based approach to supplier selection. International Journal of Logistics, 5(3), 235-255.
[7]. Bottani, E., & Rizzi, A. (2005). A fuzzy multi-attribute framework for supplier selection in an e-procurement environment. International Journal of Logistics Research and Applications, 8(3), 249-266.
[8]. Bouzon, M., Govindan, K., Rodriguez, C. M. T., & Campos, L. M. (2016). Identification and analysis of reverse logistics barriers using fuzzy Delphi method and AHP. Resources, Conservation and Recycling, 108, 182-197.
[9]. Box, G. E. P., & Muller, M. E. A note on the generation of random normal deviates, 1958. Annals of Mathematical Statistics, 29(610), 3-1.
[10].Bronja, H. (2011). Multi-criteria approach to ranking suppliers in the supply chains concept.
Tehnički vjesnik, 18(3), 393-401.
[11].Chaghooshi, A., Fathi, M. R., Avazpour, R., & Ebrahimi, E. (2014). A Combined Approach for Supplier Selection: Fuzzy AHP and Fuzzy VIKOR. International Journal of Engineering Sciences, 3(8), 67-74. [12].Chen, C. T., Lin, C. T., & Huang, S. F. (2006).
A fuzzy approach for supplier evaluation and selection in supply chain management. International journal of production economics, 102(2), 289-301.
[13].Chu, T. C., & Varma, R. (2012). Evaluating suppliers via a multiple levelmultiple criterion decision making method under fuzzy environment. Computers & Industrial Engineering, 62, 653-660.
[14].Computer Modelling, 17(4-5), 93-100.Wu, L., & Chuang, C. H. (2010). Examining the diffusion of electronic supply chain management with external antecedents and firm performance: A multi-stage analysis. Decision support systems, 50(1), 103-115. [15].Eshkiki, M. F., Saberifard, N., & Ajalli, M. (2018). A Fuzzy Economic Order Quantity (EOQ) Model with Consideration of Quality Items, Inspection Errors and Sales Return. Int. J Sup. Chain. Mgt Vol, 7(6), 61.
[16].Gordon, S. R. (2008). Supplier evaluation and performance excellence: a guide to meaningful metrics and successful results. J. Ross Publishing.
[17].Govindan, K., Khodaverdi, R., & Vafadarnikjoo, A. (2015). Intuitionistic fuzzy based DEMATEL method for developing green practices and performances in a green supply chain. Expert Systems with Applications, 42(20), 7207-7220.
[18].Ho, W., Xu, X., & Dey, P. K. (2010). Multi-criteria decision making approaches for
supplier evaluation and selection: A literature review. European Journal of operational research, 202(1), 16-24.
[19].Kilincci, O., & Onal, S. A. (2011). Fuzzy AHP approach for supplier selection in a washing machine company. Expert systems with Applications, 38(8), 9656-9664.
[20].Lehmann, D. R., & O'shaughnessy, J. (1974). Difference in Attribute Importance for Different Industrial Products: A bi-national study analyzes how industrial buyers evaluate different product categories. Journal of Marketing, 38(2), 36-42.
[21].Mirahmadi, N., &Teimoury, E. (2012). A Fuzzy VIKOR Model for Supplier Selection and Evaluation: Case of EMERSON Company. Journal of Basic and Applied Scientific Research, 2(5), 5272– 5287.
[22].Noorul Haq, A., & Kannan, G. (2006). Design of an integrated supplier selection and
multi-echelon distribution inventory model in a built-to-order supply chain environment. International Journal of Production Research, 44(10), 1963-1985.
[23].Paulson, D., & Zahir, S. (2015). Consequences of uncertainty in the analytic hierarchy process: A simulation approach. European Journal of Operational Research, 87(1), 45-56.
[24].Pi, W. N., & Low, C. (2006). Supplier evaluation and selection via Taguchi loss functions and an AHP. The International Journal of Advanced Manufacturing Technology, 27(5-6), 625-630.
[25].Saaty, T. L. (1978). Modeling unstructured decision problems—the theory of analytical hierarchies. Mathematics and computers in simulation, 20(3), 147-158.
[26].Saaty, T. L. (1980). The analytic hierarchy process McGraw-Hill. New York, 324. [27].Saaty, T. L. (1986). Axiomatic foundation
of the analytic hierarchy process. Management science, 32(7), 841-855. [28].Saaty, T. L., & Vargas, L. G. (1987).
Uncertainty and rank order in the analytic hierarchy process. European Journal of Operational Research, 32(1), 107-117.
[29].Samvedi, A., Jain, V., & Chan, F. T. (2013). Quantifying risks in a supply chain through integration of fuzzy AHP and fuzzy TOPSIS.
International Journal of Production Research, 51(8), 2433-2442.
[30].Sevkli, M., Oztekin, A., Uysal, O., Torlak, G., Turkyilmaz, A., & Delen, D. (2012). Development of a fuzzy ANP based SWOT analysis for the airline industry in Turkey. Expert systems with Applications, 39(1), 14-24.
[31].Vargas, L. G. (1982). Reciprocal matrices with random coefficients. Mathematical modelling, 3(1), 69-81.
[32].Wang, S. J. (2005). Application of rough set on supplier's determination. In The Third Annual
Conference on Uncertainty, Aug 2005. [33].Weber, C. A., Current, J. R., & Benton, W. C.
(1991). Vendor selection criteria and methods. European journal of operational research, 50(1), 2-18.
[34].Wu, M. (2007). Topsis-AHP simulation model and its application to supply chain management. World Journal of Modelling and Simulation, 3(3), 196-201.
[35].Yang, Y. N., Wu, J., & Zheng, W. (2012). Trajectory tracking for an autonomous airship using fuzzy adaptive sliding mode control. Journal of Zhejiang University SCIENCE C,