Number Twenty Eight, Volume XV I, No, I,1989
TRANSACTION COST AND THE VIABILITY
OF RURAL FINANCIAL INTERMEDIARIES*
Teodoro S. Unta/an and Carlos E. Cuevas**Introduction
Rationaleand Objectivesof the Study
The definition of transaction cost asused here departs from its usual meaning which is the measure of ffriction" in any intermediation process. Transaction cost in this study is the cost incurred as banks perform the role
of intermediator among savers and user of funds. This results from bank
operations in lendingand mobilizingfunds, as well as from other operations, e.g., investments. Transaction cost includes administrative costs, i,e., personnel and fixed costs as well as risk-related costs, that are normally encounteredin dispensing and keeping thesefunds. It isa vital aspect ofthe bank's operational capability and largely determines the bank's viability as an intermediary.
The process of intermediation is the result of banks' comparative ad-vantage in bringing about a market mechanism for the efficient transfer of claims on resources from surplus units to deficit units. High transaction cost runs against this rationale and impedes the intermediary's efficiency in resource allocation and distribution.
Against the backdrop of the increasing need to provide credit to the agricultural sector, the continued existence of intermediaries in the rural sector is necessary. The present thrust of Philippine economic develop-ment of uplifting the income of rural families through the growth of the
*Paper presented during the ACPC-PIDS-OSU sponsored seminar-workshop on "Financial Intermediation in the Rural Sector: Research Results and Policy Issues"held on 26-27 September 1988at the Cuaderno Hall, Central Bank of the Philippines. This is part of a larger study on comparative bank analysis jointly conducted by the Agricultural Credit PolicyCouncil (ACPC), PhilippineInstitutefor DevelopmentStudies(PIDS), and Ohio State University (OSU). The project was coordinated by Dr. Mario B. Lamberte (PIDS) and Dr. V. Bruce J. Tolentino (ACPC).
**Respectively, Research Associate, PIDS and Professor,OSU. The views expressed in this study are those of the authors and do not necessarily reflect those of the Institute,
38 JOURNAL OF PHILIPPINE DEVELOPMENT
agricultural sector only serves to highlight the need for a continuous
supply of credit to rural households. Over the years, the share of agricul-tural credit to total credit has substantially declined and yet agriculture has remained to be a very important source of livelihood for most Filipinos considering that about 81 percent of Filipino families in the lowest 30 per(_ent income class derive their income from agriculture (Tolentino 1987).
In the past, attempts were made to infuse cheap funds into the rural sector through the formal financial system with the hope that the availability of credit could stimulate the development of the agricultural sector. While the intention of providing cheap credit is noble, it overlooks its adverse effects on the transaction cost of banks. Banks' cost of ad-ministering donor-sourced funds could be high, thus affecting their opera-tions and compromising their viability (Cuevas 1984). The recognition of this problem has recently led to some policy changes. Apart from ensur-ing the continuous flow of credit to the rural sector, the new set of policies also seeks to protect banks from incurring unnecessarily high intermedia-tion costs.
This paper attempts to examine the transaction cost of banks. Its specific objectives are:
1) to develop a method of estimating transaction cost for each bank
activity, i.e., lending cost, funds mobilization and general
admi-nistration;
2) to explain the differences and the composition of transaction cost among commercial banks (KBs), private development banks (PDBs), and rural banks (RBs).
Recognizing the need to continually introduce improvements for the efficient functioning of the formal financial system as a sector vital to economic growth, knowledge of banks' transaction cost is important. It
can serve as a policy benchmark onwhich future changes and
improve-ments in the financial system can be based. These may in turn induce banks to assume a wider role in the whole financial process ensuring a stable flow of credit to the rural sector.
Organization of the Study
section II discusses the components of bank cost. A detailed presen-tation of the methods and procedures of estimating the transaction cost of banks and a description of the sources and limitations of data are given in Section II1. Section IV presents the empirical findings of the study. Finally, Section V summarizes the results and discusses some policy implications.
UNTALANandCUEVAS: TRANSACTION COST 39
Conceptual Issues
A bank incurs costs in the process of mobilizingand lendingfunds. These costs may be grouped into three categories. First, the interest cost paid to its depositors or its interest cost. Second, the incidental expensesincurred such as insurance for its deposits, insurance premia for its loans, as well as fines and penalties. Finally, the administrative costs such as the salaries and depreciation cost to bank premises, furniture, fixtures, equipments and others.
These costs, together with the interest cost of funds, determine the overall costs or total cost of intermediation for a bank:
The bank's transaction cost can be summarized as: TCost = LCost + FCost + GCost + OCost where
TCost = transaction cost of the bank Lcost = lendingcost
FCost = funds-mobilizationcost GCost = general administrationcost
OCost = other operationalcosts,e.g. investments
Cost of Funds
The bank incurs financial expenses in the form of interest payments paid to depositors. Similarly, the bank pays interest on funds obtained from the Central Bank rediscounting window, borrowings from other banks, and/or special lending programs. These are the bank's pure costs of funds or interest costs.
Incidental Expenses
In its lendingoperations,the bank incursrisk-relatedcosts forits loan deliveryand recovery. These may come in the formof guaranteefees or insurancepremia applicable to particular loans in the bank's portfolio when it participateswith the special lendingprograms. These are neces-sarycosts for banks as additionalsecurityagainstdefaultsor bad debts. In addition,banks also incurcostsin the provisionsfor bad debts,or loan defaultas well a litigationexpensesassociatedwith the foreclosures.
40 JOURNAL OF PHILIPPINE DEVELOPMENT
such as deposit insurance, and the fines and penalties paid by the bank when it cannot meet the reserve requirements.
Administrative Costs
In performing its funds-mobilization and lending operations, banks incur variable and fixed expenses. On the funds- mobilization side, vari-able expenses correspond to the salaries paid to personnel involved in the bank's deposit-taking and borrowing operations. Fixed costs as-sociated with funds mobilization are its share of depreciation costs on building, fixtures and equipment used in the bank's operation and other overhead expenses.
Similarly, administrative expenses such as salaries for personnel in-volved in loan processing, supervision, monitoring, and collection ac-tivities are incurred in the bank's lending operations. These also have their counterpart in the depreciation costs of the building, fixtures and equipment as well as overhead expenses.
There are administrative costs of the bank which are clearly identifi-able in terms of lending operations and deposit-mobilization activities. Where other costs cannot be directly or specifically associated with any of the bank's major activities, then these are considered as general adminis-tration costs which are incurred in other operations of the bank. Inthe same manner as funds-mobilization and lending costs, these include salaries for personnel involved in general administrative work and depreciation cost for the building, fixtures and equipment and other expenses related to such operations.
Opportunity Cost of Funds
Imputed costs of funds result from the opportunity cost of funds lock-ed in loans overdue. Similarly, opportunity costs may be imputlock-ed by some banks due to the differences in the required reserves for these banks. Computation may be based on the market cost of funds applied to the total volume of funds under consideration. However, this cost is
not considered in this study.
Methods and Procedures
This sectionpresentsthe methodsand proceduresused in estimating the transactioncostof banksfromthe set of primarydata.
UNTALAN and CUEVAS: TRANSACTION COST 41
Time Allocation and Transaction Cost
A table of time-allocation for the different functions in a bank was completed by each bank staff (Table l-A). Each staff was asked to give, in percentages, the time allocated to each of the pre-identified bank activities (Appendix 1). A corresponding personnel compensation table was com-pleted with the monthly salary for each bank staff (Table l-B).
From these initial data, estimation of the values of transaction cost for each bank is done by first, giving weights to the percentage of time al-located by each personnel by using the salary of that personnel from the personnel compensation table. This is done by multiplying the time allocationof one personnel for the different bank activities (Table 1-A) by his corresponding salary (Table l-B).
In order to reduce the number of variables needed in processing the data, bank personnel or positions were grouped into classes having the same or similar functions and were assigned one variable (Appendix 2). The guidelines followed are given in Appendix 3.
From the weighted percentages of time-allocation provided by each bank personnel for the different bank functions, a horizontal summation for each function across all bank personnel was made. Using this weighted time-allocation for each bank activity, the percent share of each function was taken from the total (Table 2-A).
Columns (1), (2), and (3) show the weighted time allocation in pesos for the different positions.
The weighted time allocation for each bank activity across all bank personnel is summed up in column (4). The percentages in column (5) are then derived by taking the share of each bank activity to the total as given in column (4).
The resulting shares in percentages were used to allocate personnel costs i.e., salaries, and non-personnel costs, i.e., depreciation trom the bank's income and expense statements (1 able2-B). i-or other expense items appearing in the income and expense statements which are clearly identifiable with specific bank activities, e.g., deposit insurance or guaran-tee fees, these are immediately allocated to that particular bank activity (Table 3). Column (1) gives the share of each bank activity in the total
expenses on personnel, i.e., salaries, benefits, bonuses for each bank
activity. In this case, column 1, item A is the share of the bank's lending operations in the total expenses on bank personnel. In the same man-ner, the share of each bank activity in the bank's non-personnel expen-ses, i.e., depreciation, taxes are given in column (3). Column (2) is the direct allocation of costs specific of a bank activity. For example, in-surance premia is directly attributed to lending cost since these are costs related to lending. The sum of both personnel and non-personnel costs
42 JOURNAL OF PHILIPPINE DEVELOPMENT
Table 1 A, TIME-ALLOCATION TABLE
Bank Activity/ Bank Personnel
Function • Manager Accountant Teller
A. Lending(1-10) 50% 70% B. Investments C. Trust D. Funds-Mobilization(1 - 5) 50% 30% 100% E. Gen. Administration TOTAL 100% 100% 100%
B. PERSONNEL COMPENSATION TABLE
1. Manager P1,000
2. Accountant P 700
3. Teller P 500
* See Appendix 1 for breakdown
for each bank activityis given in column (4). The correspondingshares of each bankactivityfromthe totalis givenin column(5).
The allocationor breakdownof the transactioncost for each major bank activitycan then be derived by takingthe shares of these activities in totalcosts.
Sources and Description of Data
This study used a sample of 64 out of a total of 66 banks classified accordingto type, location,and class. Two of the totalnumberof banks did notgive any informationrelatedto the aspectswhichwere considered in this study. Of this sample,22 are ruralbanks, 17 are privatedevelop-mentbanks, and 25 are commercialbanks.All of the bankssampled are locatedoutsideMetro-Manilaor are consideredas operatingin a rural or
UNTALAN and CUEVAS: TRANSACTION COST 43
Table 2
A. WEIGHTED TIME-ALLOCATION TABLE
Bank Personnel Total
Bank Activity/ Manager Accountant Teller Function
(1)
(2)
(3)
(4)
(5)
a. Lending "P500 t=490 P990 45% b. Investment c. Trust d. Funds-Mobilization =1=500 =P210 1='500 'P1210 55% e. Gen. Administration TOTAL "P1000 1_'/00 =PS00 "P2200 100%B. BANK'S INCOME AND EXPENSE STATEMENTS
a. Salariesand Wages (Personnel)
b, Depreciation/ Other OperatingExpenses (Non-Personnel)
sub-urbansetting.
The data gatheredwere qualitativeand quantitativeresponsesto the survey questionnaireaugmentedby supportingdocumentssuch as in-come statements, balance sheets, and job descriptions.The data was from a singleyear fromJanuaryto December 1986.
Raw data were obtainedon the time-allocationof each personnelfor the different functionsof a bank. Each bank personnelwas represented as everyone is madeto respondto the time-allocationtable.The basicin-formationobtainedwas the percentageof the time of each
44 JOURNAL OF PHILIPPINE DEVELOPMENT
Table 3
TRANSACTION COST
Bank Personnel Cost Non-Personnel Cost Total
Activity/
Function Exclusive Non-exclusive P %
(1) (2) (3) (4) (5) A. Lending _ insurance =ls= A % premia B. Investment :P= =1== B % C. Trust =t= =1== C % D. Funds =1= deposit =P= D % Mobilization insurance E. Gen. Admin. t== =P' E % r Transaction Cost = 100%
Thus, from the foregoing:
Transaction Cost (TCost) = A ,+B + C + D + E,
where
A is the total cost of lending by the bank; B is the total cost for investment operations; C is the total cost for trust operations; D is the total cost for funds-mobilization; and E is the total cost for general administration.
Limitations of the Data
Quantitativeresponsesfrom the set of primary data collected maybe partly qualitative in nature as these may depend on the respondent's in-terpretation of the question at hand and the time-frame. This maybe par-ticularly true where the respondents were asked about the allocation of
UNTALANandCUEVAS: TRANSACTION COST 45
their time to the different bank activities. Nevertheless, their responses maybe considered as best estimates.
In addition, answer to such questions as loan as a percentage of col-lateral, and number of repeat borrowers serviced were based on best es-timates by the respondent in cases where bank records were not readily
available.
Lastly, data on bank expenses although lifted straight from the banks' income and expense statements, may not exactly reflect actual costs
in-curred for some bank activities. This is particularly true for KBs and PDBs
where loan processing costs may be undervalued since part of activities of processing a loan are done at the head office but these costs may not be properly accounted for by the branch. These might have produced biased estimates.
Empirical Results
This section discusses several sets of results. The first sub-section provides an overview of the transactions costs and the different composi-tion of these costs among KBs, PDBs, and RBs. The next sub-seccomposi-tions, pp. 55 and 64, focus on the lending costs and funds-mobilization costs, respectively, among the different bank types. These sub-sections present the composition of the costs of lending and funds-mobilization, two of the banks major operations, and attempt to explain the differences
in this composition across the three bank types.
Sub-sections on pp. 66 and 73 relate the costs of lending and funds mobilization to the respective number and value of loans and deposits, in order to determine the per unit cost of providing these services. The
costs per loan and per deposit provide indication of the comparative
ad-vantage of different bank types in providing these services to their cus-tomers.
Total Transaction Cost: A Comparative Analysis
Forty-nineof the 66 banks and bank branches in the sample reported time-allocation tables and income statements. Of these 49 banks, 16 are rural banks, 14 are private development banks and 19 are commer-cial banks.
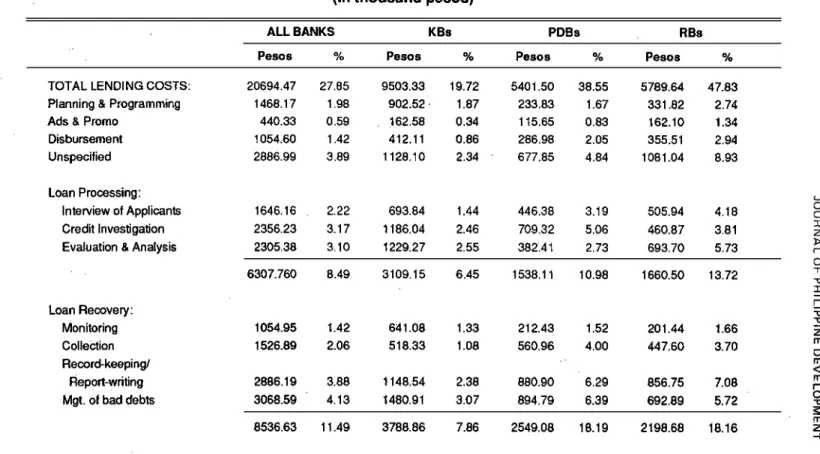
Total transaction cost for the overall sample of forty nine banks combined are due primarily to funds-mobilization activities, 49.8% (see Table 4). Transaction cost associated with lending operations account only for 27.9 percent of the total. Bank activities related to administrative and general services account for 20.9 percent of the total transaction
Table 4
TRANSACTION COST
(in thousand pesos)
ALL BANKS KBs PDBs RBs
Pesos % Pesos % Pesos % Pesos %
TOTAL LENDI NG COSTS: 20694,47 27.85 9503.33 19.72 5401.50 38.55 5789,64 47.83
Planning & Programming 1488.17 1.98 902.52, 1,87 233,83 1.67 331.82 2,74
Ads & Promo 440.33 0.59 !62.58 0.34 115,65 0.83 162.10 1,34
Disbursement 1054,60 1.42 412.11 0.86 288,98 2.05 355.51 2.94 Unspecified 2886,99 3.89 1128.10 2.34 677,85 4.84 1081.04 8.93 Loan Processing: Interview of Applicants 1646,16 2,22 693.64 1.44 446.38 3.19 505.94 4.18 c _0 Credit Investigation 2356,23 3,17 1186.04 2.46 709.32 5.06 460.87 3,81 z
Evaluation & Analysis 2305,38 3,10 1229.27 2.55 382.41 2.73 693.70 5.73
o 6307.760 8.49 3109,15 6.45 1538.11 10.98 1660.50 13,72 -n I r-Loan Recovery: -_ "o Monitoring f 054.95 1,42 641,08 1.33 212.43 1.52 201.44 1.66 Collection 1526.89 2.06 518.33 1.08 560.96 4.00 447.60 3.70 rn o Record-keeping/ m< Report-writing• 2886.19 3,88 1148.54 2.38 880.90 6.29 856.75 7.08 m f-Mgt. of bad debts 3068.59 4.13 1480.91 3.07 894.79 6.39 692.89 5.72 o £rl 8536.63 11.49 3788.86 7.86 2549.08 16.19 2198.68 18.16 z -I
c z .H 3> i-Table 4, continuation >z ALL BANKS KBs PDBs RBs cL
t-Pesos % Pesos % Pesos % Pesos % m
< _> Cq INVESTMENTS 569.19 0.77 83.71 0,17 272,89 1.95 212,59 1.76 TRUST OPERATIONS 522.72 0.70 402.09 0.83 112.18 0.80 8.46 0.07 :0 _> z Gq TOTAL FUNDS- > MOBILIZATION COSTS: 37010.21 49.81 27241.05 56.53 5146.21 36.73 4622.95 38.19 -I6
Transactions with CB, other banks 2335.82 3.14 1250.52 2.60 274.40 1.96 810.90 6.70 z
L-3
Transactions with Depositors 17636.44 23.74 14223.77 29.52 2250.75 16.07 1161.92 9.60 O
tJ3
Record-keeping 8589.63 11.56 6443.39 13.37 1293.56 9.23 852.68 7.04 -.I
Funds-Transfer 1529.69 2.06 1098.31 2.28 355,90 2.54 75.48 0.62
Ads & Promo 2250.03 3.03 1552.76 3.22 380.58 2.72 316.70 2.62
Unspecified 4663.80 6.28 2671.77 5.54 586,75 4.19 1405.27 11.61
GEN ERAL ADMIN ISTRATiON/
SERVICES 15502.65 20.87 10954.44 22.73 3077.32 21.97 1470.88 t 2.15
TRANSACTIONS COSTS: 74299.23 100.00 48184.61 100.00 14010.1 100.00 12104.51 100.00
Source: Comparative Bank Study, 1987
.1=, ,,,.,i
48 JOURNAL OF PHILIPPINE DEVELOPMENT
cost, while the rest corresponds to other bank operations such as invest-ment, o.77 percent, and trust, 0.70 percent.
Transactions with bank depositors and clients represent almost one-half of the costs of funds-mobilization activities for these banks. This
indi-cates that an important proportion of bank resources is allocated to
rais-ing funds from the public for their operations. Activities related to trans-actions between these banks and the Central Bank (CB) and other banks account for only 3.1 percent of total transaction cost. The disparity, in these shares in costs underlines the preference by these banks to source their funds from the public rather than from other sources. However, the cost of mobilizing funds from the Central Bank is not negligible, as is usually assumed.
In their lending operations, activities related to ioan processing ac-count for 8.5 percent of total transaction cost. A larger proportion (11.5%) of their costs is attributed to loan recovery efforts. The latter suggests a cautious attitude towards lending and the banks' greater ef-fort to recover funds. It is noteworthy that banks incur minimal costs in promoting its lending activities. This suggests that banks do not really exert effort to attract prospective borrowers. Banks, on the other hand, incur higher costs relative to their total transaction cost in their deposit mobilization activities, indicating that banks make a more serious effort in attracting depositors than borrowers. This is shown by the relative shares in total transaction cost of advertising and promotions cost specific to loans (0.6%) against advertising and promotions cost specific to deposits (3.0%).
Among types of banks, transaction cost on the average are highest among KBs, P2.5M, followed by.PDBs, P1M, with RBs having the lowest transaction cost, P.79M, (see Table 5). There is a greater dispersion in transaction cost among KBs, followed by PDBs then RBs. About 36.8 percent of the commercial banks surveyed have transaction cost above P2.5M. Most PDBs and RBs have transaction cost of P1M or less, respectively. This is to be expected since KBs have bigger operations than PDBs and RBs. They have more personnel allocated to provide various services to their clientele. A typical KB has on the average a staff of 22 with PDBs having 16 and RBs 16 including officers and manage-ment personnel (Table 6). KBs also have higher fixed costs, i.e., depreciation for their building and equipments. Another important con-tributing factor is the relatively higher salary scale of KB personnel than either PDBs and RBs. This only serves to underscore the fact that the size of the bank has a bearing on the magnitude of its transaction cost.
When the composition of transaction cost is compared among bank types (Table 4), more than half (56.5%) of overall transaction cost of KBs come from funds-mobilization. Only 19.7 percent of their transaction cost
Table 5 c
• ;_
COMPARATIVETRANSACTION COST _>
(in thousand pesos) r>
z
KBs PDBs RBs KBs PDBs RBs
"F_NSACTIONS ROW c
m
COST Number % Number % Number % TOTAL % % % , <
_> 500 & Jess 0 0.00 3 21,43 3 18.76 6 0.00 50.00 50.00 -_ -n 1000 & less 1 5.26 6 42,86 8 50.00 15 6.67 40,00 53.33 _> z 1500 & less 1 5.26 2 14.29 5 31.25 8 12.50 25.00 62,50 _, c_ 2000 & less 4 21.05 2 14,29 0 0,00 6 66.67 33,33 0.00 "_ 2500 & less 6 31.58 0 0,00 0 0,00 6 100.00 0.00 0,00 z C) 2500 + 7 36.84 1 7,14 0 0.00 8 87.50 12,50 0.00 O TOTAL 19 100 14 100 16 100 AVG: 2536.032 1000.721 798,582 SD: 1020,332 640,038 345.788 VAR: 1041078 409649 119569
Source: Comparative Bank Study. 1987
4_ t,D
ol
Table 6
PERSONNEL DISTRIBUTION
KBs PDBs RBs KBs PDBs RBs
Row
PCode* index Number % Humber % Humber % Total % Total % % %r
1 0 0,00 5 '1,98 12 4,38 17 1,57 0.00 29.41 70.59 2 0 0.00 5 1.98 10 3,65 15 1.38 0.00 33,33 66.67 3 0 0.00 20 7,91 50 18.25 70 6.45 0.00 28.57 71.43 4 0 0.00 5 1,98 12 4.38 17 1,57 0.00 29.41 70,59 5 24 4.30 16 6.32 16 5.84 56 5. I 6 42.86 28.57 28.57 6 17 3,05 5 1.98 4 1.46 26 2.40 65.38 19,23 15.38 7 27 4.84 15 5, 93 30 10.95 72 6.64 37.50 20.83 41.67 8 17 3.05 18 7.11 20 7.30 55 5.07 30,91 32.73 36,36 9 L 5 0.90 6 2.37 6 2.19 17 1.57 29.41 35.29 35.29 10 F 12t 21,68 33 13.04 12 4.38 166 15.30 72.89 19.88 7.23 c::0 11 F 28 5.02 1 0,40 2 0.73 31 2.86 90.32 3.23 6.45 12 F 63 11.29 21 8.30 16 5.84 1O0 9.22 63.00 2t .00 16,00 r-_> 13 F 24 4,30 9 3.56 0 0.00 33 3,04 72.73 27.27 0,00 0 14 L 20 3.58 16 6.32 21 7.66 57 5.25 35.09 28.07 36.84 -n..o 15 L 12 2.15 13 5,14 14 5.11 39 3.59 - 30.77 33.33 35.90 'r-16 L 0 0.00 I 0.40 14 5.11 15 1.38 0.00 6.67 93.33 .'O._ 17 F 11 1,97 3 1.19 0 0.00 14 1,29 78.57 21,43 0.00 18 2 0.36 1 0.40 5 1.82 8 0.74 25,00 12.50 62.50 m 19 178 31 .gO 48 18.97 19 6.93 245 22.56 72.65 19.59 7.76 om < m r-0 '1o m z .-I
c z Table 6, contlnuatlon -_3>
g
z KBs PDBs RRs KBs PDBs RBs RowPCode* index Number % Number % Number % Total % Total % % %
c m < 20 L 2 0,36 4 1.58 5 1.82 11 1.01 18.18 36.36 45.45 3> O'3 21 L 0 0.00 5 1.98 4 1.46 9 0.83 0.00 55.56 44.44 "" 22 0 0.00 0 0.00 1 0.36 1 0.09 0.00 0.00 100.00 23 L 0 0,00 1 0,40 0 0,00 1 0.09 0,00 100.0 0,00 Z 24 1 0.18 2 0,79 1 0.36 4 0.37 25.00 50.00 25.00 _, 25 6 1.08 0 0.00 0 0.00 6 0.55 10000 0.00 0.00 26 0 0.00 0 0.00 0 0.00 0 0.00 0.00 0.00 0.00 Z TOTAL 558 100.00 253 100.00 274 100,00 1085 100.00 8 Gq AVG: 22 16 t6
Note: F - strictty funds-related activities L - strictly loans-related activities
PC,ode* - see personnel classification code for description (Appenix 2). Source: _mpara_ve Bank Study, 1987,
52 JOURNAL OF PHILIPPINE DEVELOPMENT
comesfrom lending operations. RBs, on the other hand, have a greater bulk of their transaction cost in lending, 47.8 percent, against only 38.2 percent for their funds-mobilization activities. PDBs have almost the same transaction cost for their lending operations, 38.6 percent, and deposit mobilization activities, 36.8 percent. KBs being only a part of a nationwide bank network act as collecting stations by mobilizing and rais-ing funds for their head offices (see Relampagos [1988]). Obviously, the emphasis is to generate as much funds from the public for their head of-fices. In contrast, RBs,being unit banks perform a fully dual operation of funds mobilization and lending operations with emphasis on the latter. Furthermore, RBs,more than KBs or PDBs rely more heavily on funds from the Central Bank's rediscounting window and from special lending programs. This is shown by a bigger percentage of KBs transaction cost coming from activities related to dealings with bank depositors and clients, 29.5 percent, against RBs 9.6 percent only. On the other hand, RBs have a higher percentage of their transaction cost in activities deal-ing with the CB, 6.7 percent, compared to KBs only 2.6 percent. PDBs like KBs, incur substantially more costs on deposit-mobilization from the public than on obtaining rediscounted funds from the Central Bank.
The above findings is further supported by the percentage of time-al-location of personnel of the different bank types between funds-mobiliza-tion and lending activities (Table 7). About 60 percent of total personnel time by KBs are devoted to funds- mobilization against only 15.6 percent for lending operations. In contrast, RBs have only 33.0 percent of total personnel time infunds-mobilization but 51.7 percent oftotal personnel time in lending operations. PDBs also have a greater portion of their personnel time allocated to funds-mobilization (40.5%) than to lending operations
(33.8%).
In terms of personnel distribution (see Table 6), KBs have more of their total personnel in funds-mobilization activities, 44.2 percent, and only 7.0 percent in lending activities. But RBs have only 11.0 percent of their personnel involved in funds-mobilization activities against 23.4 per-cent of their personnel in lending operations.
In summary, RBs concentrate more on their lending activities com-pared to KBs. This is supported by RBs' personnel time allocation and distribution in favor of their lending operations. PDBs have a more balanced operations between funds-mobilization and lending operations as evidenced by their equal share in costs between these two operations. For KBs and PDBs, their lending operations and activities are shared with the head offices to the extent that they are given only a certain level of amount of authority in lending beyond which only their regional or head offices already assume the decision. RBs are unit banks performing both funds-mobilization and lending perhaps with a strong emphasis on
c-Table 7 z--4
PERSONNEL TIME-ALLOCATION >
(percentage) z
ALL BANKS KBs PDBs RBs c_cL
weighted weighted weig hted weighted Cm
shares %gt %,st shares %gt %st shares %gt %st shares %gt %st <
Cq
TOTAL LENDING: 721782.4 23.97 100 319797.8 15.57 100 t75612.0 33.77 100 226372.5 51.74 100 -1
Planning & Programming 58014.60 1.93 8,04 35884.83 1.75 11,22 9039.119 1.74 5,15 13090165 2,99 5,78 >_°z
Ads & Promo 19338.42 0,64 2,68 7661,925 0.37 2.40 5109.275 0,98 2.91 6567,229 1.50 2,90 _,
Interview of Applicants 63890.10 2,12 8.85 28031.90 1.36 8,77 1609g,04 3,10 9.17 19759.16 4,52 8.73
Credit Investigation 77240.63 2.56 t0,70 29664.30 1,93 12.40 17723.77 3,41 10.09 19852.55 4.54 8.77
Evaluation & Analysis 82447,5"t 2.74 _,1,42 42042.92 2.05 13,15 11630.92 2,24 6.62 28773.67 6.58 12.71 oz
Disbursement 43556.87 1.45 6,03 16341,57 0,80 5,1 t 12734,60 2.45 7,25 14480.68 3.31 6.40 0 Monitoring . 39458,63 1.31 5.47 24621.50 1,20 7,70 7699,025 1.48 4,38 7138.100 1.63 3.15 -1 Collection 61279,38 2,03 8,49 21683,13 1.06 6.78 21774,17 4. _,9 12,40 17822.07 4.07 7,87 Record-keeping/Report-writing 111525.2 3,70 15.45 44352.52 2.16 13,87 32107,63 6,17 18.28 35065.04 8,01 15.49 Mgt, of bad debts 50836183 1,69 7.04 14132.47 0,69 4,42 16372,38 3, 15 9,32 20331.97 4.65 8.98 Unspecified 114018,9 3.79 15,80 45379,00 2,21 14,19 25322,10 4.87 14,42 43317,86 9.90 19.14 INVEST M ENTS 18661.81 0,62 330,115 0,16 7678.65 1,48 7644.049 1,75 TRUST OPERATIONS 18372.64 0,61 1331 t,54 0.65 4787.55 0,92 273,5495 0,06 w
o1 4:=
Table 7, continuation
ALL BANKS KBs PDBs RSs
weighted weighted weighted weighted
sh ar es %gt %st s ha res %g t %s t sh a r es %g t %st sh a res %gt %st TOTAL FUNDS-MOBILfZ.ATION 1577807.0 52.39 100 1222778.0 59.53 100 210675.1 40.51 100 144353.9 32.99 100 Transactions with CB, other banks 108687.6 3.61 6.89 70743.54 3,44 5.79 13858.79 2,66 6.58 24085.31 5.50 16,68 Transactions With Depositors 737788.3 24,50 46.76 607134.7 29.56 49.65 95340.32 18.33 45,25 35313.21 8,07 24.46 Record-keeping 371284.6 12.33 23.53 290563.4 14.15 23.76 53091.58 10.21 25.2() 27629,61 6.31 19.14 850.43 c Funds-Transfer 79859.79 2.65 5.06 6537g.52 3.18 5.35 11 2.28 5.62 2629.835 0.60 1m 82 z
Ads & Promo _01347,4 3.37 6.42 75365.4g 3.67 6.16 16769.72 3.22 7.96 9212.212 2.11 6.38 _>
Unspecified 178568.3 5,93 11.32 113565 5.53 9,29 195119.62 3,75 9.27 45483,71 10.39 3t,51 r-o "1o GENERAL ADMINISTRATION/ -r F SERVtCES 675014.1 22,41 494773.0 24.09 121330.5 23.33 58910.52 13.44 "_ Grand TOTAL 3011638 t00 2053991. 100 520093,0 100 437554.5 100 m
Note: gt - grand total m<
st -- sub-total i--m
Source: Comparative Bank Study, 1987. 0
rn z
UNTALAN and CUEVAS: TRANSACTION COST 55
the latter. This is explained by the role of RBs as conduits,and to some ; extent,PDBs,forthe variousspecial-lendingprogramsof the CentralBank.
Transaction Cost of Lending
The transaction cost of lending for banksmay be broken-downinto two majorcomponents:loanprocessingcost and loanrecoverycost.Con-sideringthe compositionof the totallendingcosts (see Table 8) of the 49 banks in the sample about 41.3 percent of lendingcosts come mainly from loanrecoveryeffortssuchas monitoringof loans,collection,record-keepingand managementof bad debts. Loan processingactivitieswhich includesinterviewsof credit applicants,credit investigation,evaluation and analysis and loan disbursementaccount for 30.5 percent of total lendingcosts.
By bank types, the contributionof loan processingactivitiesto total lendingcost is 28.5 percentfor PDBs and 28.7 percent for RBs, noting almostnodifference in their loanprocessingcosts in relationto their total lendingcosts. On the otherhand,about32.7 percento! KBs'lendingcosts are accountedfor by loanprocessingactivities.Thiscontrastindicatesthat KBs devote more resourcesto loan processingbefore approval and dis-bursement.
It is importantto note, however,that despite RBs and PDBs having the same loanprocessingcosts relativeto theirtotal lendingcost,there is a differencein their costs arisingfrom credit investigationand evalua-tion/analysisof loans. Comparedto RBs, KBs and PDBs have their loan processingcostsaccountedmoreby creditinvestigation,12.5 percentfor KBs and 13.1 percentfrom PDBs, againstonly 8.0 percentfor RBs (see Table8). On the other hand, RBs give more emphasisto the evaluation/ analysisof loansthanPDBs.
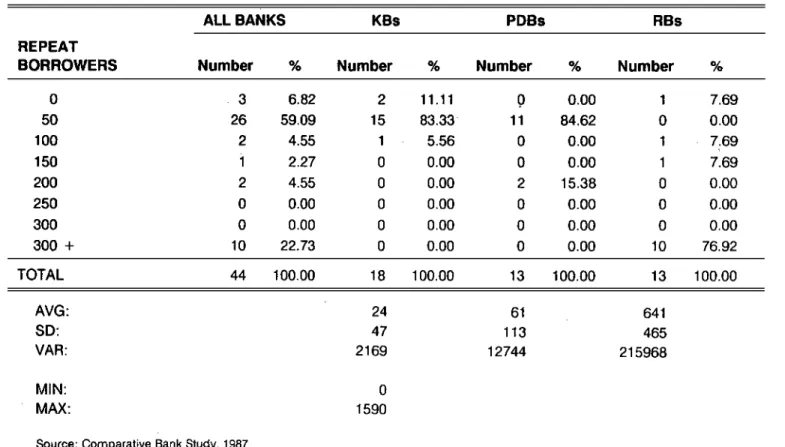
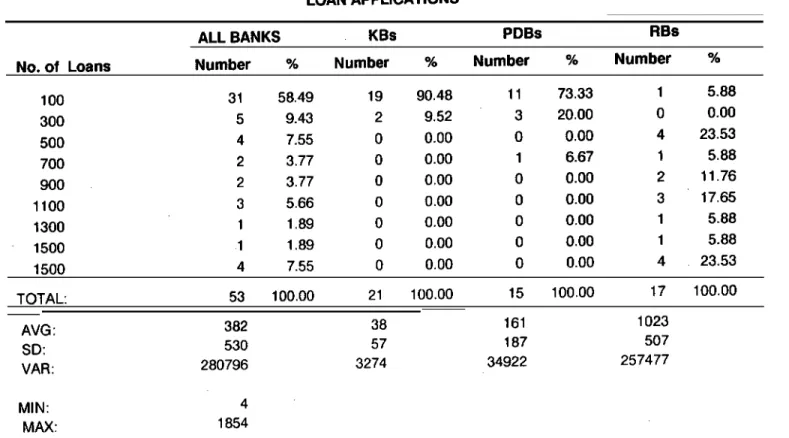
Assumingthat the characteristicof their borrowers may serve to ex-plain the difference in credit investigation cost, a comparison of the num-ber of loans granted to repeat borrowers was made. It is expected that a bank with more repeat borrowers would spend less on credit investigation cost since it is likely that the same borrowers would offer the same security. There is also the fact that the bank already knew other important charac _ teristics of these borrowers.
Table 9 showsthat onthe average, KBs have 24repeat borrowers per year, PDBs have 61, while RBs have a far greater average of 641. Of the 38 loan applications received by a KB,24 or 63.1% were repeat borrowers. One notes that the RBs averaged 641 repeat borrowers, this number is 62 percent of 1,023 loan applications. Given the almost similar ratio of repeat borrowers to total applications, it can be said that the difference in credit
Table 8 O_
LENDING COSTS
(in thousand pesos)
ALL BANKS KBs PDBs RBs
Pesos % Pesos % Pesos % Pesos %
TOTAL LENDING
COSTS: 20694.47 100.00 9503.33 100.00 5401.50 100.00 5789.64 100.00
Planning & Programming 1468.17 7.09 902.52 9.50 233.83 4.33 331.82 5.73
Ads & Promo 440.33 2.13 162.58 1.71 115.65 2.14 162.10 2.80
Disbursement 1054_60 5.10 412.1 i 4.34 286.98 5.31 355.51 6.14 Unspecified 2886.99 13.95 1128.10 11.87 677.85 12.55 I081.04 18.67 C Loan Processing: z Interview of r-o Applicants 1646.16 7.95 693.84 7.30 446.38 8.26 505.94 8.74 -n"13 Credit Investigation 2356.23 11.39 1186.04 12.48 709.32 13.13 460 87 7.96 !
r-Evaluation & Analysis 2305.38 11.14 1229.27 12.94 382.41 7.08 693.70 11.98 "o
Ill 6307.76 30.48 3109.15 32.72 1538.11 28.48 1660.50 28.68 r'13 < 1"13 r © "13 m Z
C Z -H Table 8, continuation r Z ALL BANKS KBs PDBs RBs C
Pesos % Pesos % Pesos % Pesos % m
< Loan Recovery: __ Monitoring t 054.95 5.10 641.08 6.75 212.43 3.93 201.44 3.48 >:° CoLlection 1526.89 7.38 518.33 5.45 560.96 10.39 447.60 7.73 _z> Record-keeping/ Report-writing 2886.19 13.95 1148.54 12.09 880.90 16.31 856.75 14.80 Z
Mgt. of bad debts 3068.59 14.83 1480.91 15.58 894.79 16.57 692.89 11.97 oC_
_o
8536.63 41.25 3788.86 39.87 2549.08 47.19 2198.68 37.98 -_
Source: Comparative Bank Study, 1987.
Table 9 _o
NUMBER OF REPEAT BORROWERS
ALL BANKS KBs PDBs RBs
REPEAT
BORROWERS Number % Number % Number % Number %
0 3 6.82 2 11.11 0 0.00 1 7.69 50 26 59.09 15 83.33 11 84.62 0 0.00 100 2 4.55 1 5.56 0 0.00 1 7.69 150 i 2.27 0 0.00 0 0.00 1 7.69 200 2 4.55 0 0.00 2 15.38 0 0.00 250 0 0.00 0 0.00 0 0.00 0 0.00 C 300 0 0.00 0 0.00 0 0.00 0 0.00 m Z 300 + 10 22.73 0 0.00 0 0.00 10 76.92 > 1-" O _ TOTAL 44 t00.00 18 100.00 13 100.00 13 100.00 -n "o "7 AVG: 24 61 641 r-"o -o SD: 47 1t 3 465 tl1 VAR." 2169 12744 215968 o ITF < Ill MIN: 0 r-0 MAX: 1590 rn Z
C Table 10 z LOAN APPLICATIONS > r" _> ALL BANKS KBs PDBs RBs z CL
No, of Loans Number % Number % Number % Number %
m < 100 31 58.49 19 90.48 11 73.33 1 5.88 300 5 9.43 2 9.52 3 20.00 0 0.00 500 4 7.55 0 0.00 0 0.00 4 23.53 >:0Z 700 2 3.77 0 0.00 1 6.67 1 5.88 900 2 3.77 0 0.00 0 0.00 2 11.76 6 1100 3 5.66 0 0.00 0 0.00 3 17.65 z 1300 1 1.89 0 0.00 0 0.00 1 5.88 ,_O 1500 1 1._ 0 0.00 0 0.00 1 5.88 1500 4 7.55 0 0.00 0 0.00 4 23.53 TOTAL: 53 100.00 21 100.00 15 100.00 17 100.00 AVG: 382 38 161 1023 SD: 530 57 187 507 VAR: 280796 3274 34922 257477 G MIN: 4 MAX: 1854 O1
60 JOURNAL OF PHILIPPINE DEVELOPMENT
investigation cost between KBs and PDBs on one hand, and RBs on the other is not due to the frequency of repeat borrowers in the banks' portfolios. Table 11 indicates that KBs and PDBs require higher loan- to-lateral ratios than RBs. The average loan amount is 61 percent of the col-lateral for KBs and 58 percent of the colcol-lateral for PDBs. RBs, on the other hand, give loan values of 57 percent, on average, of the collateral offered. The fact that KBs and PDBs have more commercial loans in their portfolio, usually of larger amounts than agricultural loans probably explain the importance of credit investigation, i.e., inspection and ap-praisal to ascertain the true value and authenticity of the collateral of-fered in these banks. As shown in Table 7, KBs and PDBs allocated a higher percentage of personnel time to credit investigation activities, 12.4 percent and 10.1 percent for KBs and PDBs, respectively, against only 8.8 percent for RBs.
Part of the credit investigation cost of loan processing is also ac-counted for by insurance premia paid by these banks to the special lend-ing programs.1 Table 12 shows that not a slend-ingle RB has paid guarantee fees to these programs indicating that they have not participated in these
programs or that they are not accredited at all. On the other hand, KBs and PDBs have paid guarantee fees from P20,000 to as high as P160,000. On average, PDBs pay P21,707of guarantee fees while KBs pay P11,608. ThJsguarantee fees contribute further to their credit inves-tigation cost. Likewise, participation in these programs may require addi-tional credit investigation work which would again partially contribute to the higher personnel cost in loan processing among KBs and PDBs compared to RBs.
Table 8 showed that the incidence of loan recovery costs in total lending costs is slightly higher for KBs (39.9%) and much higher for PDBs (47.2%) than for RBs (38.0%). Although rural banks service more loan accounts, yet smaller in loan value, than either PDBs or KBs, the higher loan recovery costs incurred by KBs and PDBs is due to the importance of loan recovery operations of these banks due to the larger exposure by KBs and PDBs to commercial loans than agricultural loans, the former loans being larger in amount. Among bank types, KBs and PDBs incur higher risk-related costs in managing their bad debts such as default expenses, litigation and provisions for bad debts. On the average, a KB incurs P46,665 in risk_relatedcosts whereas a PDB and an RB incur about P18,682 and P12,759, respectively (see Table 13). The difference in cost may be due to the higher loan values for KBs and PDBs compared to RBs.
c-Table 11 z
LOAN TO COLLATERAL RATIO >
I-Z
ALL BANKS KBs PDBs RBs
CL O
Loan as % of c
Collateral Number % Number % Number % Number % <m
0 1 2.33 0 0.00 1 7.14 0 0.00 -4 :;O 25% or less 1 2.33 0 0.00 1 7.14 0 0.00 >Z 50°/0or tess 14 32.56 6 37.50 3 21.43 5 38.46 >_ 75% or less 22 51.16 8 50.00 6 42.86 8 61.54 o5 t00% or less 5 11.63 2 12.50 3 2t.43 0 0.00 z 100 + 0 0.00 0 0.00 0 0.00 0 0.00 o -4 TOTAL: 43 100.00 16 100.00 14 100.00 13 100.00 AVG: 59 61 58 57 S D: 20 16 26 15
Table 12 GUARANTEE FEES (in thousand pesos)
ALL BANKS KBs PDBs RBs
Guarantee
Fees Number % Number % Number % Number %
0 43 81,13 11 64.71 10 71.43 22 100.00 20 & less 1 1.89 0 0.00 1 7.14 0 0.00 40 & less 5 9.43 4 23.53 1 7.14 0 0,00 60 & less 2 3.77 2 11.76 0 0.00 0 0,00 80 & less 0 0.00 0 0.00 0 0.00 0 0.00 100 & less 0 0.00 0 0.00 0 0.00 0 0.00 r 120 & less 0 0.00 0 0.00 0 0.00 0 0.00 • t--140 & less 1 1.89 0 0.00 1 7.14 0 0.00 o 160 & less 1 1.89 0 0.00 1 7.14 0 0.00 I TOTAL: 53 100.00 17 100.00 14 100.00 22 100.00 r m AVG: 9.457 11.608 21.707 0.000 o m SO: 27.057 0.276 46.384 0.000 <m r VAR: 732.072 266.6t5 2151.444 0.000 o m
Table 13 cZ
RISK-RELATED EXPENSES _>
(in thousand pesos)
Z
Provisions for ALL BANKS KBs PDBs RBs o.
¢3 C
Litigation & m<
Bad Debts Expenses Number ' % Number % Number % Number % >t._
0 25 39.06 11 42.31 8 50,00 6 27.27 :o _> Z 25 or less 23 35,94 7 26.92 4 25.00 12 54.55 _> 50 or less 6 9.38 2 7,69 1 6.25 3 13.64 o -1 75 or less 3 4.69 1 3.85 1 6,25 1 4.55 Z 100 or less 3 4.69 1 3.85 2 12.50 0 0,00 n O t,n 125 or less 0 0.00 0 0,00 0 0.00 0 0,00 150 or less 0 0.00 0 0,00 0 0.00 0 0,00 200 or less 0 0.00 0 0.00 0 0.00 0 0.00 225 or less 1 1.56 1 3.85 0 0.00 0 0.00 250 or tess 2 3.13 2 7.69 0 0.00 0 0.(30 TOTAL: 64 100.00 26 100.00 16 100.00 22 100.00 AVG: 27.577 46.665 18.682 12.759 SD: 55.818 80.511 31.378 15.568 VAR: 3115.663 6481,950 984.549 242.369 O_
64 JOURNAL OF PHILIPPINE DEVELOPMENT
Another possibleexplanationisthatthe higherloan recovery costespecially for PDBsmay be dictated by the requirements of the guarantee programs for monitoring and report-writing. A higher percentage of loan recovery cost i_ attributed to record-keeping and report writing, and management of bad debts for both KBs and PDBs. PDBs incur the highest loan recovery costs relative to the total lending costs as they have more exposure to the guarantee programs among the three bank types. Further, the higher loan recovery cost among KBs and PDBs may be due to the dependence of the head offices on their branches for collection and management of loan accounts.
Transaction Cost of Funds-Mobilization
As shown in Table 14, a greater portion of funds-mobilization cost by all the banks comes from deposit-mobilization (47.7%) and from record-keeping and withdrawal (23.2%). Costs accounted by activities related to transactions with CB rediscounting are only 6.4 percent of funds-mobilization cost.
By bank types, KBs' and PDBs' funds-mobilization costs are ac-counted mainly by deposit-mobilization activities as transactions with bank depositors. KBs' deposit-mobilization cost accounts for 52.2 percent of funds-mobilization cost compared to 43.7 percent for PDBs. RBs, on the other hand, have only 25.1 percent of funds-mobilization cost coming from deposit-mobilization. A higher percentage of KBs' and PDBs' funds-mobilization cost is also due to record-keeping and withdrawal. This is to be expected since this cost is related to the servicing of deposits by clients.
RBs, on the other hand, have a higher percentage of their funds-mobilization cost from activities related to transactions with CB redis-counting window, 17.5 percent, against KBs' 4.6 percent and PDBs' 5.3 percent. This reflects the RBs' reliance on funds from CB, and highlights the fact that this reliance is far from costless. In fact, dependence from CB rediscounting window may represent an important costfor the banks.
It has been shown above that a greater percentage of personnel time is allocated to deposit-mobilization activities, 49.6 percent for KBs and 45.2 percent for PDBs compared to only 24.4 percent for RBs (Table 7). A greater proportion of personnel is also assigned to deposit-mobilization activities by KBs and PDBs compared to RBs (Table 6). This is explained by the greater volume of deposits serviced by both KBs and PDBs compared to RBs. Another factor is that KBs and PDBs have other accounts, such as time-deposits, to service unlike RBs. Overall, the concentration of personnel on deposit-mobilization activities by KBs and
C
Table 14 z
FUNDS-MOBILIZATION COSTS >
i-(in thousand pesos) >Z
ALL BANKS KBs PDBs RBs =C)
C
Pesos % Pesos % Pesos % Pesos %
> ul
Total 37010.20 100.00 27241.04 100.00 5146.205 100.00 4622.951 100.00 ._
Transactions with CB, >
Z.
other banks 2335.823 6.31 1250.522 4.59 274.3954 5.33 810.9047 17.54 ¢o_>
¢3 Transactions with Depositors 17636.44 47.65 14223.77 52.21 2250.752 43.74 1161.915 25.13 z Record-keeping 8589.628 23.21 6443.389 23.65 1293.558 25.14 852.6812 18.44 oo¢n Fund§-Transfer 1529.688 4.13 1098.311 4.03 355.8993 6.92 75.47827 1.63 Ads&Promo 2250.033 6.08 1552.757 5.70 380.576,3 7.40 316.6992 6.85 Unspecified 4663.796 12.60 2671.773 9.81 586.7502 11.40 1405.272 30.40
Source: Comparative Bank Study, 1987.
o1
66 JOURNAL OF PHILIPPINE DEVELOPMENT
PDBs contributeto their higher deposit-mobilizationcosts. On the other hand, a greater percentage of personnel time is allocated by RBs to transaction cost with the CB, 16.7 percent against KBs and PDBs 3.44 and 2.44 percent respectively.
Fines and penalties related to reporting requirements with the CB and in meeting the reserve requirement contributed a greater percentage of RBs' funds-mobilization cost. On the average, this cost is P40,071 for RBs compared to KBs' P4,504 and PDBs' P6,757 (see Table 15). On the other hand, a considerable percentage of KBs and PDBs funds-mobiliza-tion cost comes trom insurance for their deposits. This is expected since KBs and PDBs have a greater volume of deposits compared to RBs. The average is P66,468for KBs, P15,514for PDBs and P12,709 for RBs (see Table 16).
Per Unit Cost ot Lending
Cost Per Loan Account Outstandina
Given the overall cost incurred Dy banks in their lending operations and considering the total number of outstanding loans in their portfolio, the cost per outstanding loan is about P1,380 per account (see Table 17). This amount represents the cost per loan by all the banks combined. Part of this cost per account comes from processing the new loans granted for the period considered and a bigger par{ comes from servicing these new loans in addition to other loans that are already outstanding.
By type of bank, RBs have the lowest cost per loan account, (P473) than PDBs (P1,839) and KBs (P14,500) (see Table 17). The big dif-ference in cost per loan between KBs and RBs is that not only do KBs incur higher cost in their lending operations but that they have less
ac-counts to service. In contrast, not only do RBs incur less total costs in
the lending operations but they also service more accounts. This is typical among rural banks where most loans in their port-folioare small, but numerous. PDBs also have less number of accounts in their portfolio than RBs although greater than KBs. Most of the loans by RBs are agricultural loans compared to KBs which have predominantly commer-cial loans.
Recovery cost associated with all outstanding loans,2 is P 564 per account for all of the banks. For RBs the loan recovery cost per account is P 166 against PDBs' P 772 and KBs' P 6,305. In all aspects of loan
c
Table 15 z
--t
DEPOSIT-RELATED EXPENSES _>
(in thousand pesos) _,z
ALL BANKS KBs PDBs RBs c_
c
Fines & m<
Penalties Number % Number % Number % Number % >_
0 24 43.64 10 52.63 11 78.57 3 13.64 :o_> 20 & less 20 36.36 7 36.84 3 21.43 10 45.45 _z 40 & less 2 3.64 1 5.26 0 0.00 1 4.55 60 & tess 5 9.09 1 5.26 0 0.00 4 18.18 5z 80 & less 1 1.82 0 0.00 0 0.00 1 4.55 100 & less 0 0.00 0 0.00 0 0.00 0 0.00 100 + 3 5.45 0 0.00 0 0.00 3 13.64 TOTAL 55 100.00 19 100.00 14 100.00 22 100.00 AVG: 17.849 4.504 6.757 40.071 SD: 40.676 11.554 16.767 59.125 VAR' 1654.575 133.500 281.117 3495.821 M1N: 0 MAX: 188.6 ol
Table 16
DEPOSIT-RELATED EXPENSES
(in thousand pesos)
ALL BANKS KBs PDBs RBs
Deposit
Insurance Number % Number % Number % Number %
0 1 1.85 0 0.00 1 7.14 0 0.00 20 & less 32 59.26 3 16.67 9 64.29 20 90.91 40 & less 10 18.52 4 22.22 4 28.57 2 9.09 60 & less 2 3.70 2 11.11 0 0.00 0 0.00 80 & less 4 7.41 4 22.22 0 0.00 0 0.00 100 & less 2 3.70 2 1 i .11 0 0.00 0 0.00 c 100 + 3 5.56 3 16.67 0 0.00 0 0.00 r'-TOTAL 54 100.00 18 100.00 14 100.00 22 100.00 o-I1 "1o "l-r" "o AVG: 31.356 66.468 15.514 12.709 -o SD: 36.826 45.490 11.216 6.277 m o VAR: 1356.141 2069.378 125.803 39.399 m < ITI r-Source:income andExpenseStatements,Dec.1986 O m z .-I
UNTALAN and (3UEVAS: TRANSACTION COST 69
Table 17
COST PER OUTSTANDING LOAN ACCOUNT
(in pesos) ALL
BANKS KBs PDBs RBs
TOTAL LENDING COST: 1379.92 14500.28 1839.24 473.04
Planning & Programming 93.96 1136,09 99.79 29.02
Ads & Promo 30.54 201.34 58.71 13.59
Interview of Applicants 94.76 777.69 153.48 39,50 Credit Investigation 172.27 1894.99 291.96 39.45 Evaluation & Analysis 152.76 1821.55 81,36 67.47
Disbursement 72.78 681.54 123.60 23.88 Unspecified 198.56 1681.87 258.66 94.14 Loan Recovery: Monitoring 67.92 986.29 78.41 9.,46 Collection 107,42 937.21 197.00 36.04 Record-keeping/ Report-writing 185.73 1724.72 328.37 58,80 Mgt. of bad debts 203.23 2656.98 167,91 61.69 564.29 6305.20 771.69 165.99
70 JOURNAL OF PHILIPPINE DEVELOPMENT
recovery operations, i.e., monitoring, collection, record-keeping and management of bad debts, PDBs and KBs incur more costs than RBs (see Table 17). For example, the cost of monitoring each account is P78 for PDBs and P986for KBs against P9.41 for RBs. It must be recalled that KBs and PDBs put more emphasis on their loan recovery operations due to greater exposure as a result of the larger commercial loans they make. Further, PDBs and KBs participate in the guarantee programswhereas RBs do not. The difference in their loan servicing cost per account may be due to the importance of 10anrecovery and the requirements of these guarantee programs for supervision and stricter management of these accounts compared to regular accounts.
Table 18 reports the average cost per loan granted during the year.3 It is shown that PDBs and KBs have higher processing cost per loan at P1,023 and P6,745 respectively, against RBs' P120. As in the banks' loan recovery cost, all aspects of loan processing cost from screening to
credit investigation and loan evaluation is higher among PDBs and KBs compared to RBs. An example would be the credit investigation cost per account for loan processing activities than RBs. This may be partly due
to the need for extensive credit investigation and partly due to the par-ticipation of PDBs and KBs in guarantee programs.
Cost Per Peso Lent
As regards the cost per peso of loan granted and loans outstanding for these banks, a totally different picture emerges. Considering all the banks, the cost per peso loan outstanding is P0.03 (see Table 19). This means that the cost of maintaining each peso of loan outstanding is about three centavos. For each bank type, this cost is P0.06 for RBs, P0.03 for PDBs and P0.02 for KBs. Overall, KBs and PDBs have the comparative advantage in lending compared to RBs as they are able to keep a lower cost per peso of loan they keep in their portfolios. This is a direct effect of the larger amounts of outstanding loans, in KBs' and PDBs' portfolio than in RBs. What PDBs and KBs lack in the number of loan accounts, they make it up by a higher loan amount pe.raccount.
The cost of recovering each peso of loan outstanding4 for each bank is P0.023 for RBs, P0.014 for PDBs and very negligible for KBs, P0.008 (see Table 19). Again, the slightly lower loan recovery cost per peso for
3. Total loan processingcost divided by total number of loans granted. 4, Total loan recovery cost divided by the total value of loans outstanding.
UNTALANand CUEVAS: TRANSACTION COST 71
Table 18 COST PER LOAN
(in pesos) ALL
BANKS KBs PDBs RBs
TOTAL LENDING COST: 1237.30 20176.99 3593.81 391.02 Planning & Programming 71.87 1355.49 155.57 23.19
Ads & Promo 25.62 283.70 76.95 11.90
Disbursement 68.88 998.83 190.94 26.60 Monitoring 64.87 1526.13 141.34 11.59 Collection 95.79 1238.90 373.23 29.30 Record-keeping/ Report-writing 178,41. 2540.00 586.09 59.90 Mgt. of bad debts 192.35 3440_20 595.34 47.36 Unspecified 152.75 2049.01 451.00 60.92 Loan Processing: Interview of Applicants 103.83 1583.50 296.99 36.68 Credit Investigation 142,88 2543.67 471.93 32.15 Evaluation & Analysis 140.04 2617_58 254.43 51.44 386.75 6744.74 1023.36 120.27 Source: Comparative Bank Study, 1987.
72 JOURNAL OF PHILIPPINE DEVELOPMENT
Table 19
COST PER PESOS LOAN OUTSTANDING (in pesos)
i.i I
ALL
BANKS KBs PDBs RBs
TOTAL LENDING COST: 0,026 0.018 0.030 0.060
Planning & Programming 0.002 0.001 0.001 0,003
Ads & Promo 0,001 0.000 0.001 0.002
Interview of Applicants ' 0.002 0.001 0.002 •0.005 Credit Investigation 0,003 0,002 0.004 0.005 Evaluation & Analysis 0,003 0,002 0.002 0.007
Disbursement 0,001 0,001 0,002 0,004 Unspecified 0.004 0.002 0.004 0.011 Loan Recovery: Monitoring 0,001 0.001 0.001 0.002 Collection 0,002 0,001 0,003 0.005 Record-keeping/ Report-writing 0,004 0.002 0,005 0.009 Mgt. of bad debts 0.004 0.003 0.005 0.007 0,011 0.008 0,014 0,023 Source: Comparative Bank Study, 1987,