Trade Policies in
Sub-Saharan Africa
Johanes Agbahey, Harald Grethe, Harvey Bradford, Sisay Lelissa Negeri
Consistency with Domestic Policies and Implications for Sustainable and
Inclusive Agricultural Development
SLE Discussion Paper 06/2017
Trade Policies in Sub-Saharan Africa:
Consistency with Domestic Policies and
Implications for Sustainable and
Inclusive Agricultural Development
Johanes Agbahey, Harald Grethe, Harvey Bradford, Sisay Lelissa Negeri
SLE Discussion Paper 06/2017
Published by: Centre for Rural Development (SLE)
Humboldt-Universität zu Berlin Lebenswissenschaftliche Fakultät
Albrecht Daniel Thaer-Institut für Agrar- und Gartenbauwissenschaften Seminar für Ländliche Entwicklung (SLE)
Hessische Str. 1-2 10115 Berlin Telephone: 030-2093-6900 Fax: 030-2093-6904 E-mail: sle@agrar.hu-berlin.de Website: www.sle-berlin.de Printing
Zerbe Druck & Werbung Plankstr. 11
15537 Grünheide
Distribution
Seminar für Ländliche Entwicklung (SLE) Hessische Str. 1-2 10115 Berlin Copyright SLE 2017 ISSN: 1433-4585 ISBN: 3-936602-92-1
The SLE Discussion Paper Series facilitates the rapid dissemination of preliminary results drawn from current SLE projects. The idea is to stimulate discussions in the scientific community and among those in the field, and to inform policy-makers and the interested public about SLE and its work.
The Centre for Rural Development (SLE) is affiliated to the Albrecht Daniel Thaer Institute for Agricultural and Horticultural Sciences in the Faculty of Life Sciences at the Humboldt-Universität zu Berlin. Its work focuses on four strands: international cooperation for sustainable development as a post-master degree course, training courses for international specialists in the field of international cooperation, applied research, and consultancy services for universities and organisations.
The objective of the research project “Towards a Socially Inclusive and Environmentally Sustain-able Rural Transformation in Africa” is to identify strategies, instruments and measures that will help to forge a more socially inclusive and sustainable rural transformation in sub-Saharan Africa. The project itself is a constitutive component of the Special Initiative ONE WORLD, NO HUNGER financed by the Federal Ministry for Economic Cooperation and Development (BMZ).
The views and opinions expressed in this Discussion Paper are those of the authors and do not necessarily reflect the official position of the BMZ and views of the SLE.
Johanes Agbahey, External Research Consultant
E-mail: johanes.agbahey@hu-berlin.de
Prof. Dr. Harald Grethe, External Research Consultant
E-mail: grethe@hu-berlin.de
Harvey Bradford, External Research Consultant
E-mail: harvey.bradford@outlook.com
Sisay Lelissa Negeri, External Research Consultant
Abstract
Development of the agricultural sector in sub-Saharan Africa is driven by, among other factors, policy frameworks in place. Trade policy, in particular, can play a role in achieving the overarch-ing objectives of an ecologically sustainable, socially inclusive, and competitive agricultural sec-tor. This paper reviews the trade policies of Benin, Ethiopia and Zambia, assessing their effects on agricultural-sector development. The consistency between trade policies and other policy fields, especially domestic agricultural policies, is analysed in order to determine the extent to which policies from different fields complement each other to achieve overarching objectives. The paper also reviews the regional and international commitments of the three selected coun-tries to assess whether these commitments restrict domestic space for policies aimed at sustain-able and socially inclusive agricultural development. The social inclusion of agricultural develop-ment is found to be substantially higher in Ethiopia compared to the two other countries, due to its strong and pro-poor public agricultural budget and relatively equal distribution of land use rights in the highlands. Meanwhile, international policy commitments are found to only margin-ally restrict domestic policy space for all three countries.
Key Words
Trade policy, agriculture, development, sub-Saharan Africa, Benin, Ethiopia, Zambia, social in-clusion, sustainability, productivity, trade agreements, agro-food-sector, industry, policy coher-ence
ii
Executive Summary
Executive Summary
Background
Assessment of the agricultural sectors in Benin, Ethiopia and Zambia shows that agriculture, measured by its contribution to national GDP, is a predominant sector in Ethiopia, an important one in Benin and a rather small one in Zambia. In all three countries, however, it is the main source of livelihoods, as it employs a large share of the labour force, even in Zambia. The agro-food sector also plays a major role in trade, especially for Benin and Ethiopia, where agricultural and food products make up a large share of national exports as well as imports. This suggests that agricultural policies and trade policies related to the agricultural sector in all three countries have the potential to influence the livelihoods and welfare of a large proportion of the popula-tion. They can also contribute towards setting up favourable frameworks for achieving a sustain-able, socially inclusive and competitive agricultural sector within each country.
Agricultural and trade policies
Over time, these three countries have implemented various policies affecting their agricultural sectors. As a result of these policies, overall political support for agriculture as measured by the Nominal Rate of Assistance has been negative for Zambia and Ethiopia for most years between 1965 and 2004, positive in some years from 2005 on, and close to zero for the whole period in Benin. In the field of trade policy, all three countries implemented trade reforms attached to structural adjustment programs in the 1990s with the aim of liberalizing their economies and improving competitiveness. At the national level, these reforms involved the removal of govern-ment interference in domestic markets, removal of import bans and quotas, simplification of tariff structures as well as exchange-rate policy reforms. At the international level, all three coun-tries are members of regional organizations, with the ambition of becoming free-trade areas with harmonized trade rules. Moreover, Benin and Zambia are members of the WTO, while Ethiopia is still in the accession process. The three countries are all covered by negotiations of the European Partnership Agreements as well as the Africa Growth Opportunity Act (AGOA) initiative of the United States, providing them with preferential access to EU and US markets. Benin and Ethio-pia, being considered Least Developed Countries, benefit from free access to EU markets via the “Everything But Arms” initiative, while Zambia, as a middle-income economy, does not. Thus, the domestic policy options of the three countries are affected by rules established at the inter-national as well as regional levels.
Consistency of policy frameworks and effects on agricultural development
Trade liberalization is not per se an aim of agricultural-sector development policy but, rather, needs to be complemented by domestic policies aimed at socially inclusive and sustainable agri-cultural sector development. The case of trade liberalization in Benin is a good example. Alt-hough substantial trade reforms have been implemented since 1990, the reduction of its rural poverty and decline in its Gini coefficient lag far behind that of Ethiopia, which invested a much greater share of its public budget in domestic-sector development (17% in 2015, compared to about 4% in Benin). The pro-poor focus of Ethiopian public expenditure as well as the
compara-tively equal distribution of land use rights in the highlands, which are dominated by small-scale farming, have added to comparatively inclusive development there. Meanwhile, Zambia is a quite different case. It invests a relatively large share of its public budget (9.5%) to support a rela-tively small agricultural sector (5.3% of GDP). However, due to its almost exclusive focus on input and output subsidies, the end effect on broad and pro-poor sector development is rather small. Despite substantial growth in food production in recent decades, the sectoral productivity in all three countries still lags far behind the productivity levels achieved in the rest of the world. Thus, trade reforms alone, even if resulting in a high degree of openness to international markets, are not sufficient for achieving a sustainable, socially inclusive and competitive agricultural sector. We do not find, however, that current international trade policy commitments seriously restrict domestic agricultural policy space and development in these countries. For example, Benin and Zambia’s WTO commitments do not seriously restrict any domestic policy objectives, as their tariff bindings are far above currently applied tariffs. Meanwhile, for Ethiopia, given its already existing free access to the markets of several high-income economies and its own preferential trade agreements with others, joining the WTO and not having the possibility to set tariff bind-ings far above applied levels might not be in its best interest. Regarding the concluding of Eco-nomic Partnership Agreements with the EU, long transition periods and the option to opt out a substantial share of sensitive products implies only limited restrictions on domestic agricultural sector development. Nevertheless, concluding such agreements may be less interesting for Least Developed Countries, like Benin and Ethiopia, compared to sub-Saharan African countries not having that status, such as Zambia.
As for regional trade integration, the share of external trade with African trade partners in total trade has increased for Benin, Ethiopia and Zambia during recent decades. Nevertheless, there is still much potential for improved regional trade integration through the reduction of non-tariff barriers of institutional, regulatory, and infrastructural kinds, which hamper existing regional trade agreements from delivering their full potential.
Core findings
Trade liberalization is not per se an aim of agricultural-sector development policy but, rather, needs to be complemented by domestic policies aimed at socially inclusive and sustainable agri-cultural sector development. The social inclusion of agriagri-cultural development has been found to be substantially higher in Ethiopia compared to Zambia and Benin, due to its strong and pro-poor public agricultural budget and relatively equal distribution of land use rights among farms in the highlands. We do not find current international trade policy commitments seriously restricting domestic agricultural policy space and development for any of the three countries.
Contents
Abstract ... i Executive Summary ... ii Contents ... v Figures ... vii Tables ... viii Abbreviations ... ix1 Introduction to the research project ... 1
2 Current state of the agricultural sector in Benin, Ethiopia and Zambia ... 3
2.1 Economy and agricultural sector ... 3
2.2 Sustainability, social inclusion, and productivity of the agricultural sectors in the three countries ... 8
2.2.1 Sustainability ... 8
2.2.2 Social inclusion ... 10
2.2.3 Productivity ... 13
2.3 Trade ... 16
2.4 Conclusion ... 23
3 Trade and agricultural policies ... 25
3.1 Trade policies ... 26
3.2 Agricultural policies... 29
3.2.1 Benin ... 29
3.2.2 Ethiopia ... 31
3.2.3 Zambia ... 31
3.2.4 Land tenure systems ... 33
4 International trade policies affecting Benin, Ethiopia and Zambia ... 35
4.1 Regional trade agreements ... 35
4.2 Economic Partnership Agreements and the African Growth and Opportunity Act ... 36
4.3 World Trade Organization (WTO) commitments ... 37
vi
Contents
5 Effects of current policies on environmental sustainability, social inclusion and
competitiveness ... 41
5.1 Overview and general conclusions ... 41
5.2 Country-specific effects of policies on the agro-food sector ... 43
5.2.1 Benin ... 43
5.2.2 Ethiopia ... 50
5.2.3 Zambia ... 56
6 Coherence of (agricultural) trade policies with domestic policies ... 61
Figures
Figure 1: Benin, Ethiopia, and Zambia ... 3
Figure 2: Annual GDP growth, 1961–2015 (in %) ... 4
Figure 3: Real GDP per capita, 1960–2014 (in constant 2010 US$) ... 4
Figure 4: GDP composition, 1960–2014 (in %) ... 5
Figure 5: Annual growth of agricultural value added, 1966–2015 (in %) ... 7
Figure 6: Food production index, 1961–2013 (2004–2006 = 100) ... 7
Figure 7: Fertilizer consumption, 2003– 2013 (kg of nutrients per hectare of arable land) ... 8
Figure 8: Forest area, 1990–2015 (% of land area) ... 9
Figure 9: Agricultural sector share in total GHG emissions, 1990–2010 (in %) ... 9
Figure 10: Rural and urban poverty headcount ... 12
Figure 11: GINI index (World Bank estimate) ... 13
Figure 12: Tractors per 100 sq. km of arable land in Benin and Zambia, 1960–2000 ... 14
Figure 13: Agricultural irrigated land in Benin and Ethiopia, 2000–2012 (% of total agricultural land) ... 14
Figure 14: Agriculture value added per worker, 1980’s–2015 (constant 2010 US$) ... 15
Figure 15: Agricultural credit, 1990–2015 (2005 = 100) ... 15
Figure 16: Cereal yield, 1961–2013 (kg per ha) ... 16
Figure 17: Trade as share of GDP, 1960’s–2010’s (in %) ... 16
Figure 18: Imports, exports and net trade, 1974–2014 (in current Million US$) ... 17
Figure 19: Share of merchandise export value by primary commodity group, 1990’s–2010’s (in %) ... 18
Figure 20: Shares of export values by destination, 1960’s–2010’s (in %) ... 19
Figure 21: Composition of merchandised imports by product, 1990’s–2010’s (in %) ... 21
Figure 22: Shares of import values by geographic origin and economic status, 1960’s–2010’s (in %) ... 22
Figure 23: Trends in support (or taxation) of the agricultural sector (Nominal Rate of Assistance), 1960’s–2000’s (%) ... 26
Figure 24: Import and export taxes, 1990’s–2010’s (% of government revenue) ... 27
Figure 25: Customs and other import duties, 1990’s–2010’s (% of tax revenue)... 27
Figure 26: Bound and applied Most Favoured Nation tariff rates, simple average for agricultural products, for Benin and Zambia, 1990’s–2010’s (in %) ... 28
viii
Tables
Figure 28: Agricultural value added in Benin set in relation to relevant policy events,
1970–2015 (in constant 2010 US$) ... 44
Figure 29: Benin’s Gross Domestic Product, 1960–2015 (in 2010 million US$) ... 45
Figure 30: Benin’s agro-food trade values set in relation to relevant policy events,
1962–2015 (in 2010 million US$) ... 46
Figure 31: Benin’s GDP composition, 1960–2014 ... 47
Figure 32: Cottonseed and cotton lint production in Benin and relevant policy events,
1961–2014 ... 49
Figure 33: Ethiopian agricultural value added and relevant policy events, 1981–2015
(in constant 2010 US$) ... 51
Figure 34: Ethiopian GDP and relevant policy events, 1981–2015 (in 2010 US$) ... 52
Figure 35: Ethiopian GDP composition, 1981–2015 ... 53
Figure 36: Ethiopian agro-food trade value change and relevant policy events,
1997–2015 (in constant 2011 US$)... 54
Figure 37: Ethiopian dairy product exports and imports, 2005–2009 ... 55
Figure 38: Agricultural value added in Zambia and relevant policy events, 1965–2015
(constant 2010 US$) ... 57
Figure 39: Zambian GDP composition, 1965–2015 ... 58
Figure 40: Zambian maize production and relevant policy events, 1961–2014 ... 59
Figure 41: Zambian trade in agro-food products and relevant policy events,
1995–2010 (constant 2010 US$) ... 60
Tables
Table 1: Core economic indicators for Benin, Ethiopia and Zambia ... 6
Table 2: Share of farms by size (in %) ... 10
Abbreviations
ACP African, Caribbean and Pacific countries
AGOA Africa Growth Opportunity Act
AMAB Mutual Agricultural Insurance of Benin
CET Common External Tariff
COMESA Common Market for Eastern and Southern Africa
EBA Everything But Arms
EPA Economic Partnership Agreement
ECOWAS Economic Community of West African States
ECX Ethiopian Commodity Exchange
EU European Union
FISP Farmer Input Support Program
FNDA National Fund for Agricultural Development
FRA Food Reserve Agency
FSP Fertilizer Support Program
FTA Free Trade Agreement
GDP Gross Domestic Product
GHG Greenhouse gas
GTP Growth and Transformation Plan
IMF International Monetary Fund
LDC Least Developed Countries
MFN Most Favorable Nation
MCC Millennium Challenge Corporation
MMD Movement for Multiparty Democracy
NRA Nominal Rate of Assistance
ONASA National Office for Food Security
SADC Southern Africa Development Community
SONAPRA National Agricultural Promotion Company
US United States of America
WAEMU West African Economic and Monetary Union
1
Introduction to the research project
Generally, agricultural trade policy is just one element of a package of agricultural, environmen-tal, economic and development policies, which together constitute the political framework for (inter)national agricultural development. Thus, orientation of these policies towards overarching political objectives as well as achieving coherence between different policy fields is important. Against this background, the present study analyses the trade policies of selected African
coun-tries (Benin, Ethiopia1, and Zambia) with respect to their conformity with objectives regarding
the “ecological sustainability”, “social inclusion” and “competitiveness” of agriculture as well as with respect to their coherence with domestic policies. It compares the three countries against relevant macro-economic indicators. However, the presentation of data is often constricted by their availability and different data collection methods across countries.
The study is organized as follows. First, Chapter 2 provides an overview of the three selected economies, with a focus on each agricultural sector: its sustainability, social inclusion, and productivity as well as its role in trade. Subsequently, Chapter 3 presents current trade and agri-cultural policies in each country, with an outlook towards future developments. International trade policies affecting Benin, Ethiopia and Zambia – meaning regional trade agreements, Euro-pean Partnership Agreements and World Trade Organization (WTO) commitments as well as trade policies of other countries – are presented in Chapter 4. In Chapter 5, the effects of each country’s agricultural trade policies on proclaimed sustainability, social inclusion and competi-tiveness objectives are discussed. Finally, Chapter 6 discusses the levels of coherence between the selected country’s trade and domestic policies, deriving some implications for future national trade policies as well as further development of international trade policies.
1 It is important to note that agricultural livelihoods in Ethiopia are highly diverse and so are its associated policies. This report focuses on Ethiopian livelihoods on average, being primarily driven by the highland areas which com-prise a large share of the population. Studying the effects of trade policies on an inclusive, sustainable and compet-itive agricultural sector in the Ethiopian lowlands would require a different analytical focus (see Rettberg, Beck-mann, Minah, & Schelchen 2017).
2
Current state of the agricultural sector in Benin,
Ethiopia and Zambia
2.1
Economy and agricultural sector
Benin, Ethiopia and Zambia are three low-income countries located in sub-Saharan Africa (Figure 1). While Benin has a seaport, Ethiopia is landlocked, but with close access to the Port of Djibouti, whereas Zambia is landlocked, with the closest seaport (Beira, Mozambique) being 1,400 km away.
Since the 1960’s, annual Growth Domestic Product (GDP) growth in all three countries has been fluctuating substantially from one year to the other (Figure 2). The volatility of growth rates was stronger in the period prior to 2005 but became more stable during the past decade, with all three countries growing since 2005. Among the three, Ethiopia ap-pears to be the best performer in recent years, with its annual GDP growth being on average above 10% since 2005. However, this finding
needs to be put into perspective with the initial levels of these economies as, in fact, Zambia and to a lesser degree Benin are both wealthier than Ethiopia. Nevertheless, purchasing power ex-pressed as GDP per capita in constant 2010 US$ shows that Ethiopia has been catching up in re-cent years (Figure 3). Figure 3 also shows that, while real GDP per capita in Benin has been steadi-ly increasing over time, in Ethiopia it remained rather constant until 2004, before taking off strongly. The situation in Zambia is more mixed, as purchasing power there was high in the 60’s, before it started to decrease, first slowly in the 70’s and then sharply through the 80’s and 90’s. Only in the late 90’s did a growth trend resume, caused by internal policy choices as well as the strong dependence of the Zambian economy on export of copper, the prices of which on interna-tional markets fell in the 70’s and remained low through the 80’s and 90’s (Avisse and Fouquin, 2001).
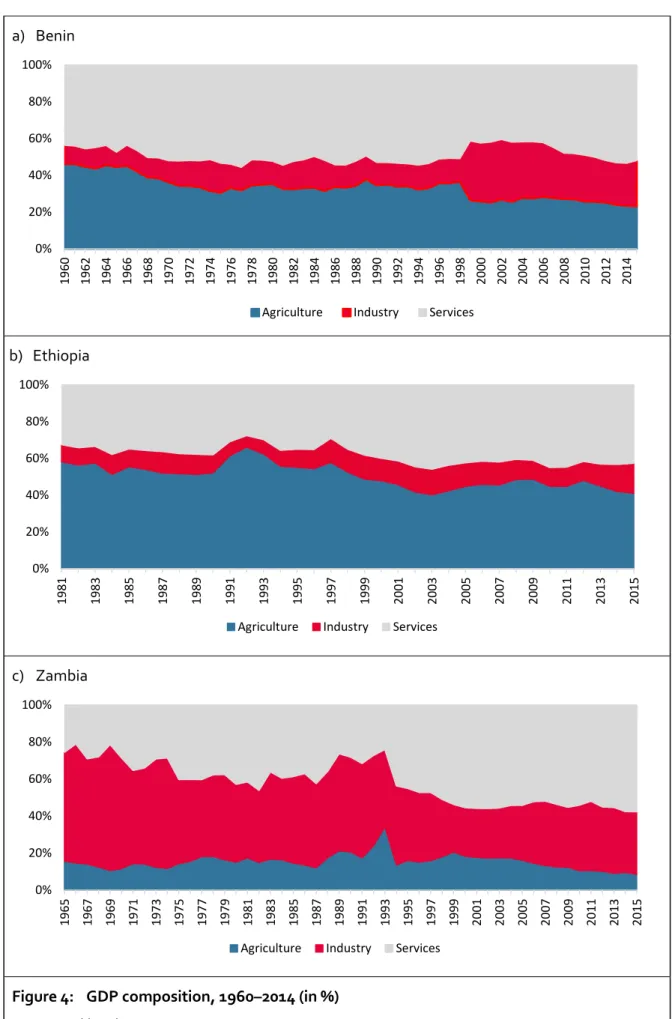
The structures of these three economies are quite different. While the agricultural sector used to play an important role in both Benin and Ethiopia, it has only been a small sector for several dec-ades in Zambia, where mining historically contributed the most to the economy before services took over (Figure 4). Nevertheless, with economic development in all three countries, the contri-bution of their agricultural sectors is shrinking slowly, mostly to the benefit of the service sector, while shares of industry are either growing slowly, such as in Benin and Ethiopia, or decreasing, as is the case in Zambia.
Figure 1: Benin, Ethiopia, and Zambia
Source: Authors’ own illustration conducted in Tab-leau software.
4
Current state of the agricultural sector in Benin, Ethiopia and Zambia
Although the agricultural sector’s contribution to the GDP is relatively small in Zambia, it is still the sector accounting for the highest proportion of employment in the country (Table 1). This evidence pinpoints to inequalities in income distribution in Zambia, which has the most unequal income distribution of the three countries, as measured by the Gini index (Table 1).
Figure 2: Annual GDP growth, 1961–2015 (in %)
Source: World Bank (2016a).
Figure 3: Real GDP per capita, 1960–2014 (in constant 2010 US$)
Source: World Bank (2016a). -15% -10% -5% 0% 5% 10% 15% 20% 1961 1963 1965 1967 1969 1971 1973 1975 1977 1979 1981 1983 1985 1987 1989 1991 1993 1995 1997 1999 2001 2003 2005 2007 2009 2011 2013 2015
Benin Ethiopia Zambia
0 500 1000 1500 2000 1960 1962 1964 1966 1968 1970 1972 1974 1976 1978 1980 1982 1984 1986 1988 1990 1992 1994 1996 1998 2000 2002 2004 2006 2008 2010 2012 2014
a) Benin
b) Ethiopia
c) Zambia
Figure 4: GDP composition, 1960–2014 (in %)
Source: World Bank (2016a). 0% 20% 40% 60% 80% 100% 1960 1962 1964 1966 1968 1970 1972 1974 1976 1978 1980 1982 1984 1986 1988 1990 1992 1994 1996 1998 2000 2002 2004 2006 2008 2010 2012 2014 Agriculture Industry Services
0% 20% 40% 60% 80% 100% 1981 1983 1985 1987 1989 1991 1993 1995 1997 1999 2001 2003 2005 2007 2009 2011 2013 2015 Agriculture Industry Services
0% 20% 40% 60% 80% 100% 1965 1967 1969 1971 1973 1975 1977 1979 1981 1983 1985 1987 1989 1991 1993 1995 1997 1999 2001 2003 2005 2007 2009 2011 2013 2015 Agriculture Industry Services
6
Current state of the agricultural sector in Benin, Ethiopia and Zambia
Table 1: Core economic indicators for Benin, Ethiopia and Zambia
Benin Ethiopia Zambia
Population (million) 10.9 (2015) 99.3 (2015) 16.2 (2015) GDP (US$ current billion) 8.5 (2015) 61.5 (2015) 21.2 (2015)
GDP growth (%) 5.2 (2015) 9.6 (2015) 3.2 (2015)
GDP per capita (US$) 779.1 (2015) 619.1 (2015) 1307.8 (2015)
Gini index 43.4 (2011) 33.2 (2010) 55.6 (2010)
Share of agriculture in GDP (%) 25.3 (2015) 40.9 (2015) 5.3 (2015) Share of agriculture in total employment
(%) 45.1 (2010) 72.7 (2013) 52.2 (2012)
Share of agriculture in total exports (%) 75.1 (2014) 90.6 (2015) 8.9 (2014) Share of agriculture in total imports (%) 49.6 (2014) 11.5 (2015) 5.3 (2014) Source: World Bank (2016a).
With regard to the importance of the agricultural sector in trade, it appears from Table 1 that Benin and Zambia are antipodes. While agricultural products account for most of Benin’s imports and exports, they are only a small fraction of Zambia’s international trade. The case of Ethiopia is more mixed, as agricultural products account for the quasi totality of the country’s exports but are only a fraction of its imports.
Growth in the agricultural sectors of these countries, measured as agricultural value added, has been erratic over the years (Figure 5). This intermittent growth is mainly due to high dependence of the sector in all three countries on volatile weather conditions as well as volatile input and out-put prices. Despite such erratic growth, the three countries have experienced strongly increasing food production over the past few decades, especially in recent years (Figure 6). This perfor-mance has mainly been driven by agricultural land expansion and, to a lesser degree, by yield growth (Byerlee et al., 2014).
Figure 5: Annual growth of agricultural value added, 1966–2015 (in %)
Source: World Bank (2016a).
Figure 6: Food production index, 1961–2013 (2004–2006 = 1002)
Source: World Bank (2016a).
2 The food production index has no unit. Average food production over the period 2004–2006 is taken as the refer-ence point to which food production in the other years is compared.
-40% -20% 0% 20% 40% 60% 80% 19 66 19 68 19 70 19 72 19 74 19 76 19 78 19 80 19 82 19 84 19 86 19 88 19 90 19 92 19 94 19 96 19 98 20 00 20 02 20 04 20 06 20 08 20 10 20 12 20 14
Benin Ethiopia Zambia
0 40 80 120 160 200 19 60 19 62 19 64 19 66 19 68 19 70 19 72 19 74 19 76 19 78 19 80 19 82 19 84 19 86 19 88 19 90 19 92 19 94 19 96 19 98 20 00 20 02 20 04 20 06 20 08 20 10 20 12
8
Current state of the agricultural sector in Benin, Ethiopia and Zambia
2.2
Sustainability, social inclusion, and productivity of the agricultural
sectors in the three countries
2.2.1
Sustainability
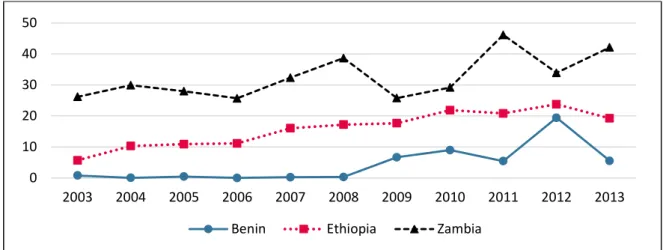
The agricultural sectors in all three countries are characterized by the use of limited amounts of external inputs. Although the intensity of use of external inputs varies across regions and across crops, in general in all three countries current agricultural techniques have resulted in soil mining, where the minerals extracted when harvesting crops are not compensated for via fertilizer input, whether organic or inorganic (Vanlauwe et al., 2014). Over the period 2002-2013, the average use of fertilizers in Benin stood at 5 kg of nutrients per ha and 16 kg and 32 kg for Ethiopia and Zam-bia, respectively (Figure 7). Over the same period, the world average was about 121 kg (World Bank, 2016a). While the world average may be too high from an environmental sustainability perspective, the Abuja declaration, based on expert estimates, put the minimum required level of fertilizer use in African countries at 50 kg of nutrients/ha (Okoboi and Barungi, 2012).
Agriculture in the three countries exerts a strong pressure on forestland and is the key factor be-hind deforestation (Figure 8), the rate of which is the highest in Benin and lowest in Ethiopia (World Bank, 2016a). This finding needs to be put into perspective, however, by looking at the initial forest endowment and population density of these countries. Ethiopia has a higher popula-tion density and a lower forest endowment as compared to the two other countries. Zambia is the least densely populated country of the three, and still has substantial arable land that can be put into production, while in Benin, especially in the southern part of the country, most of the existing agricultural land is already under production and more can only be acquired by convert-ing forestland into cropland. Several of the current agricultural techniques used in the three countries are not environmentally friendly, such as slash-and-burn clearing, which exposes soil to wind and water erosion. Other problematic techniques currently in use include bush fires, live-stock overgrazing and mono-cropping.
Figure 7: Fertilizer consumption, 2003– 2013 (kg of nutrients per hectare of arable land)
Source: World Bank (2016a). 0 10 20 30 40 50 2003 2004 2005 2006 2007 2008 2009 2010 2011 2012 2013
Figure 8: Forest area, 1990–2015 (% of land area)
Source: World Bank (2016a).
Figure 9: Agricultural sector share in total GHG emissions, 1990–2010 (in %)
Source: FAO (2016).
Similar to most African countries, Benin, Ethiopia and Zambia have low emissions compared to the rest of the world. To illustrate, the average CO2 emissions measured in metric tons per capita over the period 1964 – 2013 were 0.06 in Ethiopia, 0.21 in Benin and 0.48 in Zambia, taken against the world average over the same period, which was 4.21 (World Bank, 2016a). Nonethe-less, agriculture contributes substantially to the current greenhouse gas emissions (GHG) of all three countries, especially in Ethiopia (Figure 9). The differences in the contribution of their agri-cultural sectors to total GHG emissions across the three countries is related to the importance of the agricultural sector in their respective economies (see Table 1). In Ethiopia, where the agricul-tural sector is large, its contribution to total GHG emissions is also large. In any case, in all the three countries, the contribution of the agricultural sector to GHG emissions have increased compared to levels in 1990. It is hoped that further improvement of agricultural practices may substantially contribute to lower GHG emissions in the future.
0 20 40 60 80 19 90 19 91 19 92 19 93 19 94 19 95 19 96 19 97 19 98 19 99 20 00 20 01 20 02 20 03 20 04 20 05 20 06 20 07 20 08 20 09 20 10 20 11 20 12 20 13 20 14 20 15
Benin Ethiopia Zambia
0% 20% 40% 60% 80%
10
Current state of the agricultural sector in Benin, Ethiopia and Zambia
2.2.2
Social inclusion
From a social inclusion perspective, access to land differs among the three countries (Table 2). Farm size is very small on average, the lowest being in Ethiopia with 1.3 ha per farming house-hold, while the average in Benin is 1.7 ha and in Zambia 3.2 ha (MAEP, 2011; Devereux et al., 2007; Tembo et al., 2013). However, these average values hide an unequal distribution of land within each country, with a tiny proportion of farming households having large tracts of land and the remainder only small plots. Distribution of land is the most equal in Ethiopia, with only about 1% of farms having a farm size above five ha, whereas this share is 6% in Zambia and 12% in Benin. A recent development regarding access to land in all three countries is large-scale land acquisi-tions. In both Ethiopia and Zambia, there has to some degree been foreign investment in large-scale land acquisition (Abbink, 2011; Ng’ombe and Keivani, 2013), whereas in Benin, by contrast, the main trend has been urban demand for large-scale rural land acquisition, either for invest-ment or speculation (Hilhorst, 2011). This new trend in all three countries has been found to be contributing towards more unequal land distribution, having little or sometimes even a negative localized effect on food security, rural employment and rural poverty (Hilhorst, 2011; Ng’ombe and Keivani, 2013;Alamirew et al., 2015; Rahmato, 2011).
Table 2: Share of farms by size (in %)
< 1ha 1–5ha > 5ha
Benin* 34% 54% 12%
Ethiopia ** 63% 36% 1%
Zambia *** 48 46% 6%
Sources: * Authors’ own estimates, based on MAEP (2011); ** FAO (2001); *** Authors’ own estimates, based on Hichaambwa and Jayne (2014).
In Zambia and Ethiopia, there is a long history of fertilizer subsidies aimed at reducing the finan-cial costs of production for farmers and improving yield. However, in both countries the outcome of these policies has been mixed, due to high fiscal costs and a substantial share of the subsidies accruing to wealthy large-scale farmers (Spielman et al., 2010; Druilhe and Barreiro-Hurlé, 2012). From a gender perspective, in all three countries men enjoy much better access to land than women do (Hilhorst et al., 2011; Bezabih et al., 2010). In the customary tenure systems that still reign in large parts of these countries, land is inherited by men, with women mostly gaining ac-cess to land through marriage. However, when husbands die, women often have difficulty keep-ing their land. Female-headed households, which are often cases where the husband has died or is absent, are more vulnerable than male-headed households. In Benin and Zambia, there are national gender policies that have been put in place to improve conditions for females, especially in rural areas (MAEP, 2011; Dlamini and Samboko, 2016). However, in practice the implementa-tion of such policies has for the most part failed. In Zambia, for instance, gender policy targets distributing 30% of the country’s land to women; however, this target has never come close be
being reached. Nevertheless, women play an important role in the agricultural sector in all three countries and are involved in most agricultural operations and in all food-processing stages. An-other dimension of the gender component is youth access to land. In the densely populated high-lands of Ethiopia and in the southern part of Benin, continued population growth in combination with egalitarian inheritance and land redistribution reforms have led to land fragmentation, to levels that are insufficient for cropping (Holden and Otsuka, 2014). Access to extension services varies by country. While most farmers in Ethiopia have good access to extension services overall, in Benin and Zambia farmers in remote areas barely have any contact with extension workers (Adeoti et al., 2002; Spielman et al., 2011).
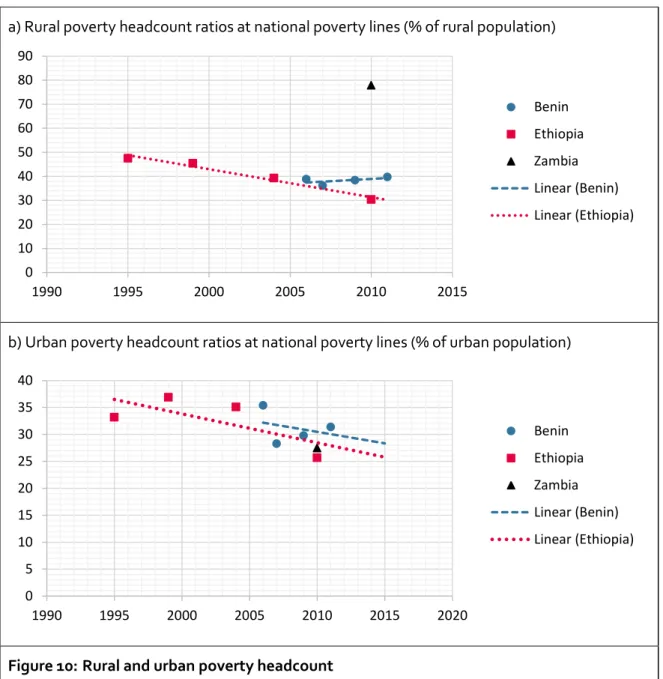
In all three countries, the main economic activity in rural areas is agriculture, which is dominated by smallholders. Hence, there is a good correlation between rural poverty and conditions for smallholder farmers, and Figure 10 shows that poverty is more a rural feature than an urban one. In fact, for all three countries across time, the rural poverty headcount is higher than that for ur-ban poverty. Moreover, in Benin, although the rural poverty headcount has remained constant over time (Figure 10a), the urban poverty headcount has decreased (Figure 10b). This may indi-cate differentiated policies favouring urban areas more than rural ones. However, in Ethiopia it appears clearly that both urban and rural poverty have decreased in similar proportions over time, and one may thus infer that policies in Ethiopia are fairer in treating rural and urban areas alike. The changes in poverty in the rural and urban areas of the three countries have been trans-lated into Gini coefficients (Figure 11). In Ethiopia, the impressive downward trend of its Gini co-efficient over time illustrates that society has become more equal overall. By contrast, the Gini coefficient in Benin has increased, showing that the society has become more unequal; this can be explained in parts by poverty remaining at the same levels in rural areas, whereas it is decreas-ing in urban areas. As for Zambia, the overall inequality level is substantially higher by compari-son, though the overall trend seems to reflect a slight decrease; but if one only looks at the peri-od from 1995 on, income inequality is clearly increasing even further.
12
Current state of the agricultural sector in Benin, Ethiopia and Zambia
a) Rural poverty headcount ratios at national poverty lines (% of rural population)
b) Urban poverty headcount ratios at national poverty lines (% of urban population)
Figure 10: Rural and urban poverty headcount
Source: World Bank (2016a). 0 10 20 30 40 50 60 70 80 90 1990 1995 2000 2005 2010 2015 Benin Ethiopia Zambia Linear (Benin) Linear (Ethiopia) Linear (Zambia) 0 5 10 15 20 25 30 35 40 1990 1995 2000 2005 2010 2015 2020 Benin Ethiopia Zambia Linear (Benin) Linear (Ethiopia) Linear (Zambia)
Figure 11: GINI index (World Bank estimate)
Source: World Bank (2016a).
2.2.3
Productivity
This section looks at the productivity of the agricultural sector as an important ingredient for later discussions on competitiveness. On the whole, the annual productivity of the agricultural worker in all three countries is quite low. On average, during the period 1980–2015 and measured in constant 2010 US$, it was lowest in Ethiopia (339 US$) and highest in Zambia (803 US$), with Benin being in the middle (761 US$). These productivity figures compare unfavourably with the world average over the same period, which was 1,478 US$. This low productivity can be associat-ed with the low capital intensity in all three countries, which are especially weak in terms of mechanization. In fact, the number of tractors per 100 square kilometres of arable land in Benin is on average less than one, while in Zambia it was on average 14 for the period 1961–1987 (Figure 12), against a world average of 148 during the same period (World Bank, 2016a). Out of the three countries, Zambia appears to be the only one with a substantial degree of mechanization in the agricultural sector, originating from its colonial history, as large-scale farms were established by European settlers in the early 20th century. However, the vast majority of the smallholder farm-ers there have not mechanized their production yet. Similarly to the low levels of mechanization, agriculture in all three countries is hardly irrigated (Figure 13). The upward trend observed in the case of Ethiopia as compared to Benin reflects higher levels of, mostly public, investment made in the agricultural sector in Ethiopia.
0 10 20 30 40 50 60 70 1975 1980 1985 1990 1995 2000 2005 2010 2015 Benin Ethiopia Zambia Linear (Benin) Linear (Ethiopia) Linear (Zambia)
14
Current state of the agricultural sector in Benin, Ethiopia and Zambia
Figure 12: Tractors per 100 sq. km of arable land3 in Benin and Zambia, 1960–2000
Source: World Bank (2016a).
Figure 13: Agricultural irrigated land in Benin and Ethiopia, 2000–2012 (% of total agricultural land)4
Source: World Bank (2016a).
Against this background of low mechanization and irrigation, it is noteworthy that labour produc-tivity in the agricultural sector, especially in Benin and in Ethiopia, has actually improved over time, though at a moderate growth rate (Figure 14). This can be attributed to a take-off in the use of fertilizer, improved seeds and increasing access to credit, the latter of which almost quadru-pled between 2005 and 2015 in all countries (Figure 15). In contrast to the other two countries, however, the value added per worker in Zambia declined, which may have been a result of multi-ple shifts in agricultural policy since the change in political regime in 1991, which will be discussed in section 5.2.
3 Data are only available for Benin and Zambia. 4 Data are only available for Benin and Ethiopia.
0 5 10 15 20 25 1960 1965 1970 1975 1980 1985 1990 1995 2000 Benin Zambia 0 0.1 0.2 0.3 0.4 0.5 0.6 2000 2002 2004 2006 2008 2010 2012 Benin Ethiopia Linear (Benin) Linear (Ethiopia)
Figure 14: Agriculture value added per worker, 1980’s–2015 (constant 2010 US$)
Source: World Bank (2016a).
Figure 15: Agricultural credit, 1990–2015 (2005 = 100)
Source: FAO (2016).
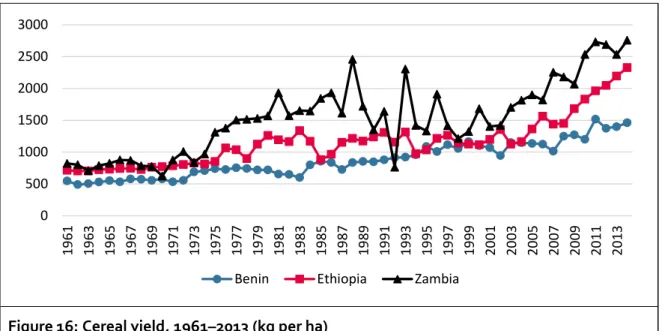
Another indicator for productivity and as such competitiveness– cereal yield – exhibits an increas-ing trend for all three countries, especially in recent years (Figure 16). Nonetheless, their perfor-mance still lags behind the world average cereal yield, which was 2,620 kg/ha for the period 1961–2014, whereas it was only 875 kg/ha for Benin, 1,159 kg/ha for Ethiopia and 1,535 kg/ha for Zambia (World Bank, 2016a).
0 200 400 600 800 1000 1200 1400 19 80 19 82 19 84 19 86 19 88 19 90 19 92 19 94 19 96 19 98 20 00 20 02 20 04 20 06 20 08 20 10 20 12 20 14
Benin Ethiopia Zambia
0 100 200 300 400 500 600 700 1990 1995 2000 2005 2010 2015 2020
Benin Ethiopia Zambia
16
Current state of the agricultural sector in Benin, Ethiopia and Zambia
Figure 16: Cereal yield, 1961–2013 (kg per ha)
Source: World Bank (2016a).
2.3
Trade
Geographical location and resource endowment shape the trade potential of the three countries differently. Benin, with a seaport, has historically been very open to trade. Zambia, whose econ-omy depends on mineral exports, is also very open to trade, despite being landlocked. Mean-while, trade as a proportion of GDP has not only been lower for Ethiopia compared to the other two countries but has even been decreasing (Figure 17).
Figure 17: Trade as share of GDP, 1960’s–2010’s (in %)
Source: World Bank (2016a). 0 500 1000 1500 2000 2500 3000 19 61 19 63 19 65 19 67 19 69 19 71 19 73 19 75 19 77 19 79 19 81 19 83 19 85 19 87 19 89 19 91 19 93 19 95 19 97 19 99 20 01 20 03 20 05 20 07 20 09 20 11 20 13
Benin Ethiopia Zambia
0% 20% 40% 60% 80% 100% 19 60 19 62 19 64 19 66 19 68 19 70 19 72 19 74 19 76 19 78 19 80 19 82 19 84 19 86 19 88 19 90 19 92 19 94 19 96 19 98 20 00 20 02 20 04 20 06 20 08 20 10 20 12 20 14
A common trend for the three countries is that both imports and exports have increased over time. However, while the trade-deficit gap has been widening in Benin and Ethiopia, it has been inverted into a trade surplus in Zambia (Figure 18).
a) Benin
b) Ethiopia
c) Zambia
Figure 18: Imports, exports and net trade, 1974–2014 (in current Million US$)
Source: World Bank (2016a). -2000 0 2000 4000 6000 19 74 19 76 19 78 19 80 19 82 19 84 19 86 19 88 19 90 19 92 19 94 19 96 19 98 20 00 20 02 20 04 20 06 20 08 20 10 20 12 20 14 M illio n u S$
Imports Exports Net trade
-10000 -5000 0 5000 10000 15000 20000 19 77 19 79 19 81 19 83 19 85 19 87 19 89 19 91 19 93 19 95 19 97 19 99 20 01 20 03 20 05 20 07 20 09 20 11 M illio n U S$
Imports Exports Net trade
-2000 0 2000 4000 6000 8000 10000 12000 19 97 19 98 19 99 20 00 20 01 20 02 20 03 20 04 20 05 20 06 20 07 20 08 20 09 20 10 20 11 20 12 20 13 20 14 M illio n U S$
18
Current state of the agricultural sector in Benin, Ethiopia and Zambia
The share of agricultural exports among total exports varies by country. It has decreased sub-stantially in Benin, while remaining roughly constant and high in Ethiopia. In Zambia, it has been low for decades and shrinking, especially since about 2007 (Figure 19). Food exports have risen in all three countries over time, with the strongest increase taking place in Benin in the past decade.
a) Benin
b) Ethiopia
c) Zambia
Figure 19: Share of merchandise export value by primary commodity group, 1990’s–2010’s (in %)
Source: World Bank (2016a). 0% 20% 40% 60% 80% 100% 1992 1993 1994 1995 1996 1997 1998 1999 2000 2001 2002 2003 2004 2005 2006 2007 2008 2009 2010 2011 2012 2013 2014
Agricultural raw materials exports Food exports Manufactures exports 0% 20% 40% 60% 80% 100% 1997 1998 1999 2000 2001 2002 2003 2004 2005 2006 2007 2008 2009 2010 2011 2012 2013 2014 2015 0% 20% 40% 60% 80% 100% 1995 1996 1997 1998 1999 2000 2001 2002 2003 2004 2005 2006 2007 2008 2009 2010 2011 2012 2013 2014
Ores and metals exports
Agricultural raw materials exports Food exports
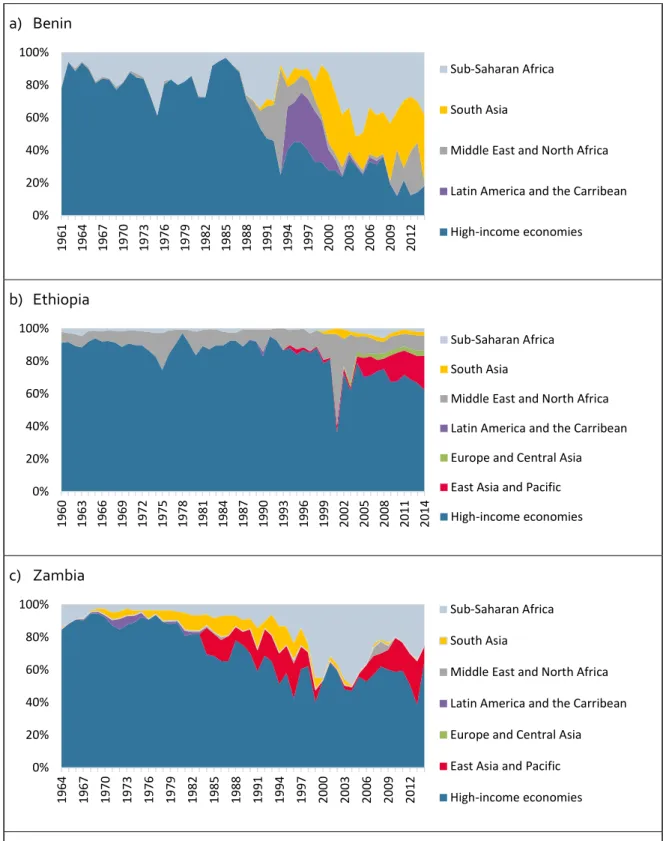
The main agricultural export in Benin is cotton, and other exported commodities include pineap-ples, cashew nuts, and cereals. In Ethiopia, the main agricultural exports are coffee, tea and chat, while in Zambia it is mostly maize. The destinations for Benin and Zambia exports have strongly changed over time, while they have remained fairly stable for Ethiopia (Figure 20).
a) Benin
b) Ethiopia
c) Zambia
Figure 20: Shares of export values by destination, 1960’s–2010’s (in %)
Source: World Bank (2016a). 0% 20% 40% 60% 80% 100% 1961 1964 1967 1970 1973 1976 1979 1982 1985 1988 1991 1994 1997 2000 2003 2006 2009 2012 Sub-Saharan Africa South Asia
Middle East and North Africa Latin America and the Carribean High-income economies 0% 20% 40% 60% 80% 100% 1960 1963 1966 1969 1972 1975 1978 1981 1984 1987 1990 1993 1996 1999 2002 2005 2008 2011 2014 Sub-Saharan Africa South Asia
Middle East and North Africa Latin America and the Carribean Europe and Central Asia East Asia and Pacific High-income economies 0% 20% 40% 60% 80% 100% 1964 1967 1970 1973 1976 1979 1982 1985 1988 1991 1994 1997 2000 2003 2006 2009 2012 Sub-Saharan Africa South Asia
Middle East and North Africa Latin America and the Carribean Europe and Central Asia East Asia and Pacific High-income economies
20
Current state of the agricultural sector in Benin, Ethiopia and Zambia
Benin and Zambia have both significantly reduced their exports to high-income economies and begun exporting more to other low- and middle-income economies, especially in sub-Saharan Africa. A trend that is specific to Benin is the development of exports to South Asia as well as to North Africa and the Middle East.
Imports to Benin, Ethiopia and Zambia have also been following different patterns. While agro-food imports form a large share of Benin’s imports, they are rather low in both Ethiopia and Zambia (Figure 21).
Similar to export destinations, the origin of imports to Benin and Zambia have changed over time, shifting from high-income economies to low- and middle-income economies in sub-Saharan Africa and Asia (Figure 22).
a) Benin
b) Ethiopia
c) Zambia
Figure 21: Composition of merchandised imports by product, 1990’s–2010’s (in %)
Source: World Bank (2016a). 0% 20% 40% 60% 80% 100% 1992 1993 1994 1995 1996 1997 1998 1999 2000 2001 2002 2003 2004 2005 2006 2007 2008 2009 2010 2011 2012 2013 2014 Manufactures imports Fuel imports Food imports
Agricultural raw materials imports
0% 20% 40% 60% 80% 100% 1997 1998 1999 2000 2001 2002 2003 2004 2005 2006 2007 2008 2009 2010 2011 2012 2013 2014 2015 Manufactures imports Fuel imports Food imports
Agricultural raw materials imports
0% 20% 40% 60% 80% 100% 1995 1996 1997 1998 1999 2000 2001 2002 2003 2004 2005 2006 2007 2008 2009 2010 2011 2012 2013 2014 Manufactures imports Fuel imports Food imports
22
Current state of the agricultural sector in Benin, Ethiopia and Zambia
a) Benin
b) Ethiopia
c) Zambia
Figure 22: Shares of import values by geographic origin and economic status, 1960’s–2010’s (in %)
Source: World Bank (2016a). 0% 20% 40% 60% 80% 100% 1961 1964 1967 1970 1973 1976 1979 1982 1985 1988 1991 1994 1997 2000 2003 2006 2009 2012 Sub-Saharan Africa South Asia
Middle East and North Africa Latin America and the Carribean Europe and Central Asia East Asia and Pacific High-income economies 0% 20% 40% 60% 80% 100% 1960 1963 1966 1969 1972 1975 1978 1981 1984 1987 1990 1993 1996 1999 2002 2005 2008 2011 2014 Sub-Saharan Africa South Asia
Middle East and North Africa Latin America and the Carribean Europe and Central Asia East Asia and Pacific High-income economies 0% 20% 40% 60% 80% 100% 1964 1967 1970 1973 1976 1979 1982 1985 1988 1991 1994 1997 2000 2003 2006 2009 2012 Sub-Saharan Africa South Asia
Middle East and North Africa Latin America and the Carribean Europe and Central Asia East Asia and Pacific High-income economies
2.4
Conclusion
To conclude this section, the current state of the agricultural sector in the three countries being examined here is that it is a predominant sector in the Ethiopian economy, an important sector in Benin and a rather small sector in Zambia. In all three countries, however, the agricultural sector is the main source of livelihoods, as it employs a large share of the labour force, even in Zambia where its share in the overall economy is rather small. This suggests that agricultural policies in all three countries have the potential to influence the livelihoods and welfare of a large propor-tion of their populapropor-tion. But many of the agricultural techniques currently being applied are un-sustainable, and the sector is not very socially inclusive in all three countries, though with notable differences. For example, land is very unequally distributed in Zambia and substantially more equally distributed in Ethiopia. Yet, several vulnerable social groups face difficult access to land in all countries. Despite slow growth, the agricultural sector’s productivity in all three countries still lags far behind the productivity levels achieved in the rest of the world. The three countries are open to trade, with agricultural products playing an important role in exports for Benin and Ethi-opia, while being a minor export source in Zambia. These findings suggest that trade policies have the potential to affect the development of each agricultural sector and, reciprocally, that agricultural policies will influence trade performance, especially in Benin and Ethiopia. Moreover, the composition of trade partners for both imports and exports of the three countries have changed over time. This may reflect trade agreements and other trade-related commitments having played a role alongside changes in comparative advantage. In the next section, we discuss in more detail the trade and agricultural policies implemented in the three countries, followed by a section on their trade agreements and international commitments, before examining the ex-tent to which these policies and trade agreements may have affected the development of their agricultural sectors.
3
Trade and agricultural policies
Trade and agricultural policies in Benin, Ethiopia and Zambia vary significantly from one country to the other. Table 3 shows that the agricultural sector is neither taxed nor supported in Benin, while it is heavily taxed in Ethiopia and subsidized in Zambia. It also shows that non-agricultural sectors in all three countries are more greatly supported than the agricultural sector. Based on the share of agriculture in the public budgets, it appears that there is little public investment in that sector in Benin, while there is more in Ethiopia and Zambia. However, these figures hide a more complex reality. In fact, the trend in support (or taxation) of the agricultural sector over the past decades has not been linear. In both Ethiopia and Zambia, the agricultural sector has been taxed for much of the past half century, while in Benin there has hardly been any support for or tax on the sector in general (Figure 23). Hence, it seems worthwhile to review in more detail country-specific trade and agricultural policies.
Table 3: Main indicators of support to agriculture in Benin, Ehtiopia and Zambia
Benin Ethiopia Zambia
Nominal Rate of Assistance for the
agricultural sector 0.00 (2005) -0.49 (2010) 0.31 (2005)
Nominal Rate of Assistance for
non-agricultural sectors 0.14 (2010) 0.05 (2009)
Relative Rate of Assistance for agriculture -0.55 (2010) 0.25 (2005) Share of agriculture in the public budget 4.78% (2014) 17.0% (2015) 9.5% (2015) Agricultural budget expressed as % of
agricul-tural value added 3.78% (2014) 7.4% (2015) 46.3% (2015)
Source: World Bank (2013); World Bank (2016a, c); FAO (2016); Benin Republic (2016); Kuteya et al. (2016); own calculations.
26
Trade and agricultural policies
Figure 23: Trends in support (or taxation) of the agricultural sector (Nominal Rate of Assistance), 1960’s–2000’s (%)
Source: World Bank (2013).
3.1
Trade policies
Trade policies in Benin, Ethiopia and Zambia have followed similar patterns, having in common that they implemented trade reforms attached to structural adjustment programs in the 1990’s with the aim of liberalizing their economies and improving competitiveness. In Benin, the re-forms chiefly targeted the removal of policy-induced trade distortions and the subsequent with-drawal of the state from marketing activities. Trade-friendly reforms involved lifting import bans
and quotas, simplifying the tax structure and converting most specific tariffs into ad valorem taxes
(Decaluwe and Robichaud, 2008) Another dimension of these reforms targeted the exchange rate, which had overvalued the domestic currency. In Ethiopia, liberalization efforts also took place, with the state withdrawing from marketing activities and devaluing the local currency to promote an export-oriented economy (Hailegiorgis, 2010). In Zambia as well, tariff reduction, removal of price controls, liberalization of the foreign exchange rate and re-establishing relations with multilateral agencies took place (Avisse and Fouquin, 2001). As depicted in Figure 24, import and export taxes comprise a substantial share of government revenue in all three countries. Most of the taxes on international trade actually come from import duties, which make up a great share of government tax revenue (Figure 25).
-80% -60% -40% -20% 0% 20% 40% 19 65 19 67 19 69 19 71 19 73 19 75 19 77 19 79 19 81 19 83 19 85 19 87 19 89 19 91 19 93 19 95 19 97 19 99 20 01 20 03 20 05 20 07 20 09
Figure 24: Import and export taxes, 1990’s–2010’s (% of government revenue)
Source: World Bank (2016a).
Figure 25: Customs and other import duties, 1990’s–2010’s (% of tax revenue)
Source: World Bank (2016a).
Regarding integration into international trade agreements, there are notable differences be-tween the three countries. While Benin and Zambia have been highly involved in regional inte-gration efforts that have shaped their recent trade policies, Ethiopia has committed itself less to regional trade agreements. Benin is a member of the West African Economic and Monetary Un-ion (WAEMU), which is a working customs unUn-ion and common market. Consequently, the majori-ty of its policy instruments have been harmonized towards the WAEMU (WTO, 2010), and since
2000 it has applied the WAEMU common external tariff5, rules of origin as well as other trade
regulations. Zambia, as a member of the Common Market for Eastern and Southern Africa (COMESA) and the Southern African Development Community (SADC) agreements, has taken
major steps towards reducing tariffs and liberalizing trade policies6. Meanwhile, Ethiopia has
5 WAEMU common external tariff book: http://www.izf.net/content/tarifs-douaniers-en-afrique-louest 6 Zambia tariff book: https://www.zra.org.zm/commonHomePage.htm?viewName=TariffGuide
0% 10% 20% 30% 40% 50% 60% 19 90 19 91 19 92 19 93 19 94 19 95 19 96 19 97 19 98 19 99 20 00 20 01 20 02 20 03 20 04 20 05 20 06 20 07 20 08 20 09 20 10 20 11 20 12 20 13
Benin Ethiopia Zambia
0% 10% 20% 30% 40% 50% 60% 70% 19 90 19 91 19 92 19 93 19 94 19 95 19 96 19 97 19 98 19 99 20 00 20 01 20 02 20 03 20 04 20 05 20 06 20 07 20 08 20 09 20 10 20 11 20 12 20 13
28
Trade and agricultural policies
finalized its accession of the COMESA Free Trade Area (FTA) regulations, employing a phase-to-phase approach where trade areas were classified into three main groups, based on their level of competitiveness within the FTA: namely, extremely sensitive, upon capacity building and un-competitive. This classification determines the tariff level associated with each trade area.
Ethio-pia implements COMESA’s common external tariff7, ranging from 0% on raw materials and
capi-tal goods to 10% and 25% for intermediate and finished products, respectively. Because of their membership in the WTO since its inception, and their status as least developed countries, Benin and Zambia have high tariff bindings, but their applied Most Favoured Nation (MFN) tariffs, which apply to other WTO members, are rather low (Figure 26). Ethiopia, not being a member of the WTO, has no tariff bindings, but still its applied tariffs are low on average. The finding that the country’s weighted average tariff is lower than the simple average is an indicator that high tariffs are acting in a restrictive manner, resulting in the value share of commodities on which high tariffs are imposed being relatively small (Figure 27).
a) Benin
b) Zambia
Figure 26: Bound and applied Most Favoured Nation tariff rates, simple average for agricultural products, for Benin and Zambia, 1990’s–2010’s (in %)
Source: World Bank (2016a).
7 Ethiopian tariff book: http://www.erca.gov.et/index.php/search-hs-code?view=hscode 0 10 20 30 40 50 60 70 2000 2005 2010 2015 Bound rate Applied tariff rate Linear (Bound rate) Linear (Applied tariff rate)
0 20 40 60 80 100 120 140 1990 1995 2000 2005 2010 2015 Bound rate Applied tariff rate Linear (Bound rate) Linear (Applied tariff rate)
Figure 27: Trend in average applied tariffs on agricultural products in Ethiopia
Source: World Bank (2016a).
3.2
Agricultural policies
From our perspective, a key ingredient for understanding the current state of agricultural policies in the three countries discussed here is the historical development of their agricultural sectors, which exhibit country-specific patterns.
3.2.1
Benin
In Benin, prior to the colonial era, palm oil plantation was introduced and promoted by the for-mer Dahomey Kingdom (which became present-day Benin), constituting its main export com-modity to the rest of the world (Fournier et al., 2000). During the colonial era and after independ-ence, palm oil production still played a major role in Benin’s economy, until the whole set-up col-lapsed at the end of the 80’s, with palm oil prices on international markets plunging. It is worth noting that from 1974 to 1989, the country was ruled by a centrally planned regime, which na-tionalized the palm oil industry and promoted collectivization of farms. However, this shift in agricultural policy did not bring much productivity growth to the sector. Instead, the state mo-nopoly over the sector led to it becoming a high-cost industry, with inefficiencies all along the chain (Floquet and Mongbo, 1998).
Following the collapse of the palm oil industry, cotton, which was introduced during the colonial era, emerged as the commodity with the highest export potential. Starting from the late 80’s, a number of policies were put in place to promote cotton, and an attractive set-up was created to motivate farmers via input credits, pre-fixed prices and other incentives. In 1983, a government parastatal called the National Agricultural Promotion Company (SONAPRA) was set up and given a monopoly over the provision of inputs for and marketing of cotton (WTO, 2010). As a result, cotton production surged (Minot and Daniels, 2005). Following above-mentioned trade reforms in the 1990’s, and implementation of the associated structural adjustment programs, the gov-ernment withdrew from most support activities, especially extension services, input provision and access to finance. For example, SONAPRA’s input-supply operations were gradually privat-ized between 1993 and 2000. Starting in 2008, its industrial branch, including cotton-ginning,
0 5 10 15 20 25 2004 2006 2008 2010 2012 2014 Simple average Weighted average Linear (Simple average) Linear (Weighted average)
30
Trade and agricultural policies
was transferred to a new entity primarily owned by the private sector. Its purchasing monopoly for agricultural output (including seed cotton) was also dismantled. As a result of these reforms, provision of services such as inputs, extension, and credit disappeared almost completely for all agricultural commodities, except for cotton, which was better organized and more profitable for the private sector. Only in recent years has the government resumed significant provision of irri-gation facilities and extension services for all agricultural commodities. With the setting up of the Agricultural Inputs Purchasing Pool in 2008, provision of inputs to agricultural commodities other than cotton also resumed (WTO, 2010).
For export diversification purposes, other commodities for which Benin may have a comparative advantage were identified and their value chains promoted. However, cotton remains the coun-try’s main export, and the institutional framework needed to promote other chains is still lacking. Cotton, as the country’s single most important export product, has been taxed for most of the period since its promotion (Baffes, 2009). Yet, due to a number of organizational problems in recent years, its production has needed support from the government to keep it afloat. Conse-quently, taxes from cotton have been outweighed by support for cotton coming at the expense of other agricultural commodities, such that the agricultural sector on average receives no sub-stantial support (World Bank, 2013).
Another important government policy in the agricultural sector in Benin has been an effort to secure and raise producers’ income through the National Agricultural Income Support Board (ONS). This government body was set up in 1987, initially to support producers of seed cotton and guarantee them a profitable and attractive price. In 1996, its scope of work was revised to comprise other agricultural subsectors and encourage effective diversification of agricultural products for export (WTO, 2010). Following the adjustment programs and the shift from price-stabilization policy to free-market price policy, the ONS’s scope of work was reoriented towards facilitating producers’ access to financing, promoting agricultural insurance and improving price transparency. The ONS follows price trends for agricultural products and provides farmers with information to help in determining their purchase prices. It also contributed to the setup of the Mutual Agricultural Insurance of Benin (AMAB), which was created in 2007 and started its activi-ties effectively in 2009. The ONS also developed the framework for the National Fund for Agri-cultural Development (FNDA), which is intended to finance the agriAgri-cultural sector and contribute towards resolving problems such as the high cost of capital compared to internal profitability of the sector, the lack of proximity of financial services and the stringent formalities that must be gone through for obtaining loans. Although the FNDA was officially created in 2014, because of a lack of funds, its activities are still not well developed. Finally, the ONS prepared the framework for the National Fund for Agricultural Calamities (FNBGCAB), which is expected to finance pro-jects to prevent agricultural calamities as well as compensate farmers for the kinds of calamities (drought, floods, insect invasions, etc.) not supported by the regular insurance schemes offered by the AMAB (ONS, 2016). To date, the FNGCAB has not yet been officially launched. Despite some tangible outcomes, especially the creation of the AMAB, the ONS and the government have not, on the whole, provided much support for farmers’ incomes (CIEMD, 2012). This is also evidenced by the neutral nominal rate of assistance of the agricultural sector (see Figure 23). In 1992, the Benin government created the National Office for Food Security (ONASA), a body which administers buffer stocks for staples, such as maize, yam, and cassava. The ONASA buys
products from markets around the nation by announcing their collection on the radio, defining the criteria for participation, specifications for the product, place of delivery and purchase price. This is mostly done soon after harvest time, giving farmers a floor price and avoiding prices fall-ing too low. If there is a serious shortage and the supply chain is broken, ONASA sells its stocks at subsidized prices on markets in shortage regions (WTO, 2010). Hence, it participates in stabilizing prices within a certain range.
In a move to reform the agricultural sector, the Benin government decided on November 30, 2016 to dismantle several of the bodies involved in its complex agricultural sector, namely SONAPRA, the Agricultural Inputs Purchasing Pool, ONS, ONASA, and agencies in charge of promoting irrigation and agricultural mechanization. The plan is to transfer their activities to a new body, the Territorial Agency for Agricultural Development, for efficiency reasons. While this reform is yet to be implemented, there are concerns about overlap between this new entity and the existing territorial divisions of the Ministry of Agriculture.
3.2.2
Ethiopia
Following the fall of Ethiopia’s centrally planned regime in 1991, the government implemented several agricultural policy reforms under structural adjustment Programs. These reforms includ-ed trade liberalization and deregulation of prices, abolishment of price controls and quota-rationing systems, currency devaluation, tight fiscal and monetary policy, privatization of unprof-itable large state farms, as well as liberalization of the labour market. Nonetheless, land contin-ues to be public property with limited usufruct right (Deininger et al., 2008), and subsidies have remained in place for food items and agricultural inputs (Spielman et al., 2010). The government has always been involved in input procurement, although some private importers and dealers have been allowed to enter the market. Government is also involved in fertilizer-stockholding programs, which are however seen as expensive and ineffective in stabilizing prices (Agbahey et al., 2015a).
Identification and prioritization of selected crop and livestock products for export was also part of the agricultural development strategy in the late 1990’s. During high-price periods, control of retail prices and export bans have been introduced. For example, export bans were imposed on sorghum, wheat and maize in 2006 and lifted in 2010 after a good harvest. To coordinate exports, a state company was created, with the purpose of shortening the value chain by skipping inter-mediaries. To address soil erosion, the main policy designed in 2013, and for which a pilot phase has already been completed, is the fertilizer-blending program (Agbahey et al., 2015b). Its aims include reducing dependency on imported fertilizer, source fertilizer nutrients domestically and reduce soil and fertility degradation by supplying farmers on-demand with specific nutrient blends.
3.2.3
Zambia
In Zambia, under the British mandate, there was little focus on smallholder agriculture. During that time, rural communities basically supplied labour to the mining sector and to large-scale farms established by settlers (Scott, 1995). Separation between settlers and local communities did not allow advanced technologies to be passed on from the former to the smallholder farmers
32
Trade and agricultural policies
among the latter. Following independence, all economic activities were nationalized and farms were collectivized (Fundanga and Mwaba, 1997). The government introduced several support policies for agriculture: mostly subsidies for maize that were financed with copper-export reve-nues. The objective of such subsidies was to keep staple food prices low for urban consumers while providing incentives for rural farmers to produce (Jayne et al., 2009). The subsidies led to a substantial allocation of farm resources to maize and mono-cropping. In the mid 70’s, following the collapse of copper prices on international markets, the government was forced to cut back on several subsidy programs but maintained fertilizer and maize subsidies for national food security purposes. Although the domestic currency was eventually devalued, it was not carried out to the extent necessary to make agricultural exports viable and, thus, the inflated currency restricted exports from the agricultural sector throughout the 1980’s. From 1985–1987, the government began to auction foreign exchange but reversed the policy at the end of the 1980’s. Economic reform began in earnest after the Movement for Multiparty Democracy (MMD) took over from the Kaunda regime in 1991 (Avisse and Fouquin, 2001) and implemented the Economic Reform Program (ERP), which emphasized economic liberalization.
Zambia has initiated five distinct phases of fertilizer subsidies in an attempt to increase the productivity of agriculture (Jayne et al., 2009). During the first phase (1991–1993) the govern-ment appointed state-affiliated banks and credit unions to provide credit for fertilizer. However, after minimal repayment rates, the government was forced to modify the program. During the second phase, the government appointed a limited number of private firms to import fertilizer and supply private retailers on credit. There were some issues of corruption associated with pri-vate sales and a low repayment rate of between 20 and 30% during this phase (1994–1996). The third phase (1996–1999) saw the government design a state run organization, the Food Reserve Agency (FRA), to import and distribute fertilizer to private agents. In the fourth phase, because of pressure from international donors, the government of Zambia modified this program and con-tracted large private companies to import and distribute fertilizer to cooperatives. In the fifth phase, due to issues of non-transparency in the selection process under the FRA scheme, in 2002 the government put in place the publicly managed Fertilizer Support Program. By 2007, expendi-ture on the program accounted for 30% of total budget of the Ministry of Agriculexpendi-ture and Coop-eratives (World Bank, 2010), and it has recently been renamed the Farmer Input Support Pro-gramme (WTO, 2016). In a recent report by the Food and Agriculture Organization of the United Nations (FAO) analysing fertilizer subsidies under structural adjustment programs, it has been found that Zambia has by far the largest fertilizer application rate in all of Africa (Druilhe and Barreiro-hurlé, 2012). Thus, despite criticisms related to the trade distortions associated with the fertilizer policy as well as its benefits mainly accruing to large farmers (Howard and Mungoma, 2016), this policy has been seen by many as a success story in agricultural development in Africa. Currently, the government allocates more than 60% of agricultural expenditure to maize input and output subsidies (Hichaambwa and Jayne, 2014; Kuteya et al., 2016), the effects of which on Zambian agriculture have been controversial. Through the National Agricultural Marketing Board, the government subsidises seed and fertilizer (Jayne et al., 2011). As a result of