CoAST: Collaborative Application-Aware Scheduling of
Last-Mile Cellular Traffic
Cong Shi*, Kaustubh Joshi
†, Rajesh K. Panta
†, Mostafa H. Ammar*, Ellen W. Zegura*
*School of Computer Science
Georgia Institute of Technology, Atlanta, GA †AT&T Labs - Research, Bedminster, NJ
{cshi7, ammar, ewz}@cc.gatech.edu
{kaustubh, rpanta}@research.att.com
ABSTRACT
The explosive growth of mobile data traffic poses severe pressure on cellular providers to better manage theirfinite spectrum. Pro-posed solutions such as congestion-pricing exist, but they degrade users’ ability to use the network when they want. In this paper, we propose a fundamentally different approach - rather than reduc-ing the aggregate busy hour traffic, we seek to smooth the peaks that cause congestion. Our approach is based on two key insights obtained from traffic traces of a large cellular provider. First, mo-bile traffic demonstrates high short-term variation so that delaying traffic for very short periods of time can significantly reduce peaks. Second, by making collaborative decisions on which traffic gets de-layed and by how much across all users of a cell, the delays need not result in any degradation of user experience. We design a sys-tem, CoAST, to implement this approach using three key mecha-nisms: a protocol to allow mobile applications and providers to ex-change traffic information, an incentive mechanism to incentivize mobile applications to collaboratively delay traffic at the right time, and mechanisms to delay application traffic. We provide extensive evaluations that show that CoAST reduces traffic peaks by up to 50% even for applications that are not thought to be delay-tolerant, e.g., streaming and web browsing, but which together account for 70% of all cellular traffic.
Categories and Subject Descriptors
C.2.3 [Computer-Communication Networks]: Network Opera-tions —Network Management
Keywords
Cellular Networks; Peak Throughput; Delay Tolerance; Scheduling
1. INTRODUCTION
The rapid proliferation of smartphones, tablets, and mobile ap-plications has led to a tremendous increase in mobile data traffic in the last few years. For example, the mobile data traffic on major US based mobile carriers has increased by more than 20,000% in
Permission to make digital or hard copies of all or part of this work for personal or classroom use is granted without fee provided that copies are not made or distributed for profit or commercial advantage and that copies bear this notice and the full cita-tion on thefirst page. Copyrights for components of this work owned by others than ACM must be honored. Abstracting with credit is permitted. To copy otherwise, or re-publish, to post on servers or to redistribute to lists, requires prior specific permission and/or a fee. Request permissions from [email protected].
MobiSys’14,June 16–19, 2014, Bretton Woods, New Hampshire, USA. Copyright 2014 ACM 978-1-4503-2793-0/14/06 ...$15.00.
http://dx.doi.org/10.1145/2594368.2594385 .
five years [7]. Furthermore, according to forecasts by major equip-ment manufacturers, this trend is likely to continue in future with 78% compound annual growth rate [1]. In contrast, the capacity of cellular networks, especially the wireless spectrum, has not in-creased proportionally. The efficient management of mobile traffic is, therefore, critical for cellular network operators.
Various solutions have been proposed to manage the mismatch between the ever-increasing traffic demand andfinite wireless spec-trum. These solutions can be broadly classified into two categories— adding more network resources to increase the overall capacity (i.e. increasing supply), or managing user demands and behavior to re-duce the load on the network (i.e. controlling demand). Examples of thefirst category include the use of small cells for augmenting the capacity of traditional macro cells, adding WiFi hotspots to of-fload cellular traffic to WiFi, using portable base stations (e.g. Cells On Wheels or COWs) to meet high traffic demands in event venues where large numbers of users gather for some time periods, etc. Ex-amples of the second category include congestion pricing, off-peak delivery, network-aware throttling, etc. These approaches reduce the aggregate traffic in busy periods by either shifting the parts of traffic that can tolerate some delay to off-peak hours (e.g. backup, synchronization, cloud offload, etc.) [12], or causing the user to use the network less frequently.
These existing approaches have some fundamental limitations. Shifting traffic to off-peak hours can cause degradation of quality of service experienced by the end users. The vast majority of mo-bile data traffic, including video streaming and momo-bile web brows-ing, cannot be shifted to off-peak hours because of latency require-ments. Although additional network resources increase the overall capacity, they also incur significant costs. Furthermore, solutions like small cells can be deployed only gradually because of the de-tail radio engineering trials required for the correct positioning and deployment of such infrastructure.
In this paper, we take a fundamentally different approach to tackle this problem—delaying mobile traffic like video streaming and mo-bile web browsing that are not traditionally thought to be delay tol-erant. This is based on two key insights derived from mobile traffic traces of a large US cellular provider. First, we observe that the mobile data traffic exhibits high burstiness over small time scales (tens of seconds). Thus, to ensure adequate quality of service at all times, it is important to reduce the instantaneous peak traffic, not just the aggregate traffic. Second, even applications like video streaming and mobile web browsing can, in fact, tolerate small de-lays. For example, a video streaming client can tolerate delays of tens of seconds as long as its playback buffer is not empty. Mobile web browsers can delay downloading the contents that are not cur-rently displayed on the screen. These two insights suggest that if the right user traffic (from the set of all current user traffic in the
cell) is delayed at the right time for the right time duration, it is pos-sible to reduce the peak traffic in a cell without affecting the user experience on any mobile device. This requires both device-level information (e.g. tolerable delay values at the given time instant) and cell-level information (e.g. the total traffic demand in the cell at the given time instant). Thus, an efficient interaction mechanism between mobile devices and cellular infrastructure is necessary to enable collaboration between them to make proper decisions about delaying the user traffic.
Using these insights, we present the design, implementation, and extensive evaluation of a novel system called CoAST (Collaborative
Application-AwareScheduling of Last Mile CellularTraffic). CoAST provides an interface to enable an efficient collaboration between mobile devices and the network element to which they are con-nected (e.g. a base station). The interface is simple andflexible, allowing dynamic policies and protocols to be built on top of it, according to the requirements and capabilities of individual mo-bile applications. CoAST also provides an incentive mechanism for mobile applications to delay their traffic and the actual mecha-nisms to delay the application traffic.
In addition to benefits to the mobile network operator, CoAST also improves the application performance for the end user. By de-laying traffic of users with enough playback buffer contents, CoAST can aggressivelyfill the starving buffers of other users, thereby re-ducing their buffering delays.
In summary, CoAST makes following novel contributions: 1) Rather than reducing the aggregate busy hour traffic, CoAST reduces the instantaneous peak load in a cell, without compromis-ing the quality of service experienced by the end users.
2) CoAST can handle traffic which is not traditionally thought to be delay tolerant.
3) CoAST provides a simple andflexible interface for mobile devices and the cellular network to exchange various information to enable them to make proper decisions about delaying user traffic. We implement a prototype of CoAST on the Android platform for two sample application categories, streaming (e.g., YouTube) and web browsing, which are the top two generators of cellular network traffic, accounting for nearly 70% of global cellular traf-fic [25]. We evaluate our implementation on a per-cell basis us-ing emulation based on real YouTube and web browsus-ing traces ob-tained from a major US cellular provider. Our results show that CoAST reduces traffic peaks by an average of 30-50%, or con-versely, increases the capacity of a cell by 20% without compro-mising the quality of the end user experience. In fact, we show that CoAST achieves a better quality of service in terms of reduced buffering delay compared to the cell that does not use CoAST. Our experiments also show that the control plane overhead introduced by CoAST is negligible.
The rest of the paper is organized as follows. In Section 2, we describe the background of this work and present an overview of CoAST design. We motivate the CoAST design with an analysis on cellular traffic in Section 3. The design details of CoAST is described in Section 4. The deployment and implementation of CoAST system is discussed in Section 5. The system evaluation of CoAST prototype and the trace-driven evaluation of CoAST are presented in Section 6 and 7, respectively. We discuss the related issues in Section 8. Section 9 summarizes the related work. We conclude this paper and discuss future work in Section 10.
2. BACKGROUND AND DESIGN OVERVIEW
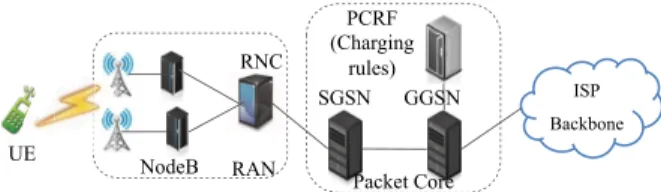
In this section, we describe the background of this work and present a high-level overview of CoAST design.ISP Backbone NodeB SGSN PCRF (Charging rules) UE GGSN RNC Packet Core RAN
Figure 1: Architecture of UMTS data network.
2.1 Background of Cellular Networks
In this subsection, wefirst describe the basics of cellular archi-tecture and then provide information about the data set used in our evaluations.
Figure 1 shows the key components of a typical UMTS data net-work. It consists of 2 major components: the Radio Access Net-work (RAN) and the Core NetNet-work (CN) (or Packet Core). The mobile device, called User Equipment (UE) in UMTS terminology, is connected to one or several cell sectors in RAN. A physical base station (called NodeB in 3G and eNodeB in LTE) can have mul-tiple cell sectors, which provide radio resources to UEs for wire-less communications. Cellular data traffic from several NodeBs are then passed to the Radio Network Controller (RNC), which man-ages handovers, and scheduling of wireless resources among the NodeBs under its control. The RNCs connect to Serving GPRS Support Nodes (SGSNs) at the core network. The SGSNs are con-nected to the external networks, such as the Internet, via Gateway GPRS Support Nodes (GGSNs). When a UE connects to the net-work, it establishes a Packet Data Protocol (PDP) context which facilitates tunneling of IP traffic from the UE to the peering GGSN using GPRS Tunneling Protocol (GTP) (see [14] for details of the UMTS network).
We evaluate CoAST using real-world cellular traffic data from a tier-1 cellular network carrier. All device and user identifiers are anonymized for our analysis. Thefirst data set is collected from the link between SGSN and GGSN in the core network. It con-tains information about IPflows carried in PDP contexts for a 3% random sample of devices collected every minute, e.g. start and end time stamps, perflow traffic volume, application identifier, etc. This data set is used to collect information about the characteristic of video streaming traffic. To gain morefine grained information about the actual traffic volume in a given cell sector, we use another dataset collected every 2 seconds at RNCs in the RAN network.
2.2 Design Overview
CoAST aims to reduce the peak-to-average ratio of the cellular last-hop traffic, and consequently improve application performance for the end user. It is not designed for persistently congested net-works whose average traffic is close to the capacity. Such netnet-works need to be upgraded to increase the capacity. We focus primarily ondownstreamas the upstream traffic intensity is not as significant. (Note that CoAST can apply equally to upstream traffic as well. But we do not claim it is the contribution of this paper.) We accom-plish this by delaying downstream traffic at times when the link is experiencing heavy load. In order to avoid degrading the quality of service experienced by the end user, the acceptable delays may range from a few to tens of seconds depending on the applications. As will be shown in the next section such relatively short traffic delays are enough to produce the desired effect of reducing traffic peaks.
One key insight of CoAST is that only mobile applications know the delay constraints of their traffic while the eNodeB has the ag-gregated traffic information. Thus, solutions that rely solely on the eNodeB or on the mobile devices do not have enough information
to simultaneously achieve both high utilization and good quality of service. Collaboration between the eNodeB and mobile devices is required to determine if and by how much the downstream data should be delayed. The scheme, described in detail in Section 4, en-ables the users to optimize their download rates while minimizing the cost of data download and maximizing the quality of service.
It is important to note that the pricing incentive used in our scheme is, strictly speaking, internal to the system and is used to facilitate decision making regarding whether to delay a certain chunk of the download traffic. It is not meant to be exposed directly and as-is to the user, nor is it meant to translate directly into billing. It will be important, however, to incentivize users to deploy this system in their devices. So we expect that there will be some correlation between billing and pricing practices of operators to be influenced by the usage of this system. However, the exact approach here is beyond the scope of our technical discussion.
Although a wide user participation increases the effectiveness of CoAST, it is not necessary that all users in a cell deploy CoAST— only enough number of UEs that can make a difference in traffic peaks is needed. Also note that users who do not deploy the sys-tem will not necessarily have any advantage over those who use the system since the user experience is preserved for those using it. So there is no individual incentive to "cheat" the system from this perspective. On the contrary, users will be interested to partic-ipate if operator pricing does somehow reflect the usage of the sys-tem. CoAST also monitors the behaviors of participating devices to identify potential cheating, which will be discussed in Section 8.
3. FEASIBILITY AND BENEFITS OF
DE-LAYING MOBILE TRAFFIC
In this section we present an analysis of the real-world traffic traces of a large US cellular carrier to provide motivation about the feasibility and potential benefits of delaying mobile traffic for short time durations.
3.1 Short-Term Burstiness of Mobile Traf
fi
c
First, we analyze the traffic distribution of a large number of cells (13522 NodeBs) using a large dataset of cellular traffic collected at several RNCs to demonstrate that the mobile data traffic of a typ-ical cell demonstrates high variations over short time scales (e.g. 30 seconds). This dataset provides per cell as well as per UE cel-lular data records. We focus on the downlink traffic because it is significantly larger than the uplink traffic in cellular networks [9, 18].
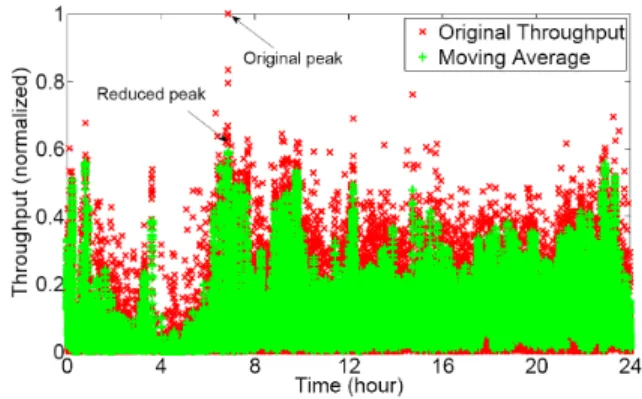
Figure 2 plots the downlink throughput along with its 20 second moving average in a typical cell in one day. The traffic is clearly very bursty with large short-term variations. To ensure adequate quality of service at all times, the cellular network provider needs to over-provision the network resources based on the peak traffic demand. Therefore, the burstiness of mobile traffic makes the re-sources underutilized during most periods of time.
A heuristic idea to better utilize the cellular resources is to delay a portion of mobile traffic for a short period of time to reduce the peak throughput over time. As a simple approximation, we use the moving average in a short period of time to demonstrate the po-tential benefits of delaying mobile traffic. Figure 2 shows that the peak value of the 20 second moving average is only about 60% of the original peak throughput. This implies that delaying a portion of mobile traffic by 20 seconds or less can result in a significant reduction in the peak throughput demand in the cell. It will lead to two major benefits. First, the reduction in the peak throughput allows the network to support more users and mobile traffic
with-Figure 2: The downlink traffic and its 20 second moving
aver-age in a cell in one typical day. The throughput is normalized with the maximal capacity used. The difference between the
original traffic and its moving average demonstrates its high
short-term variations.
out upgrading the infrastructure. In some cases, it also means that the cellular network may be able to support better quality services. For example, it may be feasible to support a better quality video streaming (say HD video with better resolution) if there is suffi-cient reduction in the overall load on the cell. Second, this also reduces congestion and helps improve the performance of mobile applications that are sensitive to delays (e.g., VoIP).
0 20 40 60 80 100 0 0.2 0.4 0.6 0.8 1
Window Size (second)
The Reduced peak
Figure 3: The reduction of the peak downlink throughput for moving averages computed over different time periods. The average and standard deviation are plotted.
To further quantify the relationship between the extra delay and the reduction on the peak throughput, we compare the reduced peak throughput achieved by moving averages computed over different time intervals for the top 200 heavy-loaded cells. The results are plotted in Figure 3. When the window size increases from 1s to 30s, the reduced peak throughput quickly decreases from 100% to 60.5% of the original peak on average. As the window size further increases to 100s, the peak is gradually reduced to 42.5% of the original peak. This figure implies that most benefits in terms of reduction of peak throughput can be obtained by delaying traffic for short time durations (e.g., 30 seconds), with diminishing returns for larger delay intervals.
3.2 Delay Tolerance of Mobile Applications
The real-world cell traffic traces indicate that delaying mobile traffic for a few seconds can reduce the peak load in the cell signif-icantly. The next natural question is: Can real-world mobile appli-cations tolerate such delays without affecting the quality of serviceexperienced by the end-users? To investigate this, we consider fol-lowing major traffic classes:
3.2.1 Streaming
Streaming applications (e.g., video streaming, audio streaming) account for around 34% of the total mobile traffic [25]. As they usually buffer some data, they can tolerate small delays which are equivalent to the current buffer occupancy of their playback buffer.
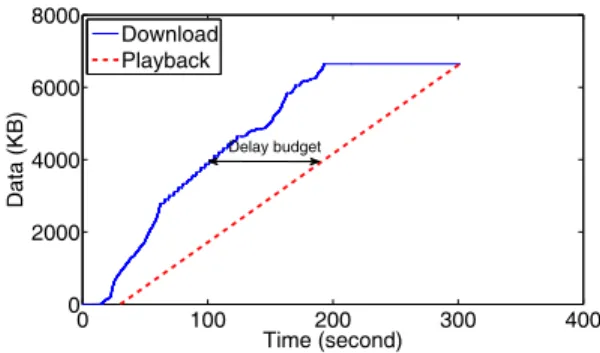
0 100 200 300 400 0 2000 4000 6000 8000 Time (second) Data (KB) Download Playback Delay budget
Figure 4: The download and playback progress of a Youtube video on an Android smartphone using a cellular network. The difference between download and playback represents the de-lay it can tolerate.
To investigate delay tolerance of streaming applications over cel-lular networks, we play a Youtube video on an Android smartphone and record the cellular traffic using Wireshark. Figure 4 compares the number of downloaded bytes and the actual playback progress during the experiment. Initially, the Youtube client aggressively buffers the video contents. But once the client has sufficient con-tents to play for some time, it slows the download to avoid down-loading unnecessary contents in case the user does not watch the complete video. The difference between the actual download and the playback progress at any given time is the amount of delay the Youtube client can tolerate at that time without affecting the user experience (i.e., pausing the video).
We also see from Figure 4 that depending on the size of the buffered data, the tolerable delay varies from a few seconds to more than one hundred seconds in this example. In addition, user opera-tions like “back” and “forward” will also impact the delay that the video client can tolerate at the specific time.
To accurately predict the future traffic and delay that the video client can tolerate, video size, bitrate, buffered data, and playback progress are required. Specifically, we can predict the amount of data to download based on the video size and buffered data. Mean-while, the bitrate, buffered data and playback progress can be used to estimate the delay that it can tolerate. Fortunately, all of them are available to the video client. Video size and bitrate can be ob-tained from the video metadata, while buffered data and playback progress are internal states of the video client. In contrast, delaying the streaming traffic arbitrarily, say from the network side without taking real time input from the application, may affect the user ex-perience.
3.2.2 Web Browsing
Web browsing applications, which are also one of the top gen-erators of cellular mobile traffic [25], are generally not regarded as being delay-tolerant. Due to their small size, mobile devices like smartphones and tablets can display only a small portion of a webpage (e.g., texts, images, and other multimedia contents) at any given time. Thus when a user browses a web page, only contents that are shown on the screen need to be downloaded immediately,
while off-screen contents can be downloaded a little bit later with-out impacting the user experience. In other words, off-screen con-tents can be treated as being delay-tolerant. In fact, some websites (e.g., Huffington Post [2]) already support progressive download and display of the web pages. When web pages contain many mul-timedia contents (e.g., images), the amount of traffic that can be delayed will be significant.
To identify the delay tolerance of web browsing, we analyze the on-screen and off-screen contents of the top 500 Alexa websites [6] in various categories. We only treat off-screen images as off-screen contents and the rest components as on-screen contents. We use PhantomJS [4] to download and render the web pages. For every website, we only download and analyze its home page. We set the user agent of all HTTP requests to that of the Android web browser and let those websites decide whether to return the mobile version or the full version. The screen size is set to 480×800, a typical setting for smartphones. For each web page, we identify all the off-screen images and treat them as off-off-screen content, while all other contents are treated as on-screen content.
0 0.2 0.4 0.6 0.8 1 0 0.2 0.4 0.6 0.8 1 The Ratio CDF Computer Global Home News Shopping
Figure 5: The ratio of off-screen content to the total content on the homepages of the top 500 websites. We also select 4 cate-gories and plot the top 500 websites in these catecate-gories.
Figure 5 shows the ratio of the size of the off-screen contents to that of the total contents on the homepage of the top 500 Alexa websites [6]. The category “Global” represents the overall top 500 websites. We also select and plot 4 categories among 16 special categories listed by Alexa. The distributions of other categories are between that of “News” and that of “Shopping”. Generally a sig-nificant portion of the web content is off-screen and can tolerate short extra delays. For categories like “News”, more than 50% of those websites have more than 50% of the contents that can tolerate extra delay. In addition, since the homepages of the websites that we analyzed usually contain less content than other pages, our esti-mation of the potential benefits as shown in Figure 5 is likely very conservative.
Like streaming applications, we also notice that only the web browser knows which images are off-screen and can tolerate short delay, especially when the user scrolls the web page. Specifically, by parsing the HTMLfile, the web browser can identify the images that are not shown on the screen. In addition, using the height and width attributes of the corresponding “img” tags, it can estimate their sizes.
4. COAST DESIGN
CoAST enables collaboration among mobile devices for schedul-ing their mobile traffic, when necessary and feasible, to reduce the peak traffic load on a cell. The basic idea is to use dynamic pric-ing to motivate the mobile applications to proactively shift their traffic in small time scales (up to 30 seconds) while still satisfying
their delay constraints. To realize this idea, CoAST uses three ma-jor mechanisms: a protocol to allow mobile applications and their associated cell to exchange traffic information, an incentive mech-anism to incentivize mobile applications to collaboratively delay traffic at the right time for the right time duration, and a mechanism to enable applications to delay their traffic. Thefirst two mecha-nisms are incorporated into thecontrol planeof CoAST, while the last one is realized in itsdata plane. However, it should be noted that all CoAST mechanisms are data plane functions from 3GPP protocol perspective, i.e. CoAST does not change the 3GPP proto-col itself.
4.1 Design Principles
Minimal modification to mobile applications:For ease of de-ployment, CoAST requires no modification on the server side, but only small changes on the client side because only mobile applica-tions know the delay constraints of their traffic. CoAST modifies the underlying socket API implementation to allow client appli-cations to specify the tolerable delay information via these socket calls in a transparent manner. The actual value of the tolerable de-lay at a given time instant depends on the application itself. In this paper, we describe how playback buffer size can be used tofigure out the value of tolerable delay for video streaming applications. For other applications, mobile developers may use existing instru-mentation systems [13] to determine the tolerable delay, thereby reducing the development efforts.
Privacy preservation:To reduce the peak load on the cell, CoAST relies on collaboration and sharing of traffic information among all mobile devices in that cell. A malicious mobile device may par-ticipate CoAST and collect the traffic information of other mobile devices to infer their application usage. To prevent privacy leak under such attack, the control plane is divided into UE proxies on mobile devices and a market proxy on the eNodeB. Each mobile device shares its aggregated traffic demand only with the market proxy and obtains the prices for downloading data only from the market proxy, avoiding the direct sharing of traffic demands among participating devices. With this design, it will be impossible for malicious mobile device to obtain accurate traffic information of mobile applications running on other mobile devices.
Control of demand through pricing: To motivate mobile
ap-plications to delay their traffic when necessary, CoAST uses dy-namic “prices” to charge mobile traffic at different time instants. The prices used by CoAST can be $ per bit as used in [12]. More generally, it can also be treated as the discount ratio on the ac-counted traffic. For example, when the price is 0.8, 1 Mb mobile traffic can be accounted as 0.8 Mb. The latter case is compatible with the usage-based pricing model used by most cellular providers nowadays. In this paper, we don’t specify the pricing model used by the cellular providers. We treat the price as the ratio of accounted traffic to the transferred traffic.
Tackling system abuse: CoAST requires UEs to report traffic
demands to the market proxy, which sets the prices based on de-mand information from all UEs in the cell. Malicious UEs may attempt to report fake information to abuse the system. To prevent such cheating behavior, CoAST records and compares the reported traffic demands and the real traffic to identify suspicious behavior (please see Section 8 for a detail discussion).
4.2 Overview of CoAST Operation
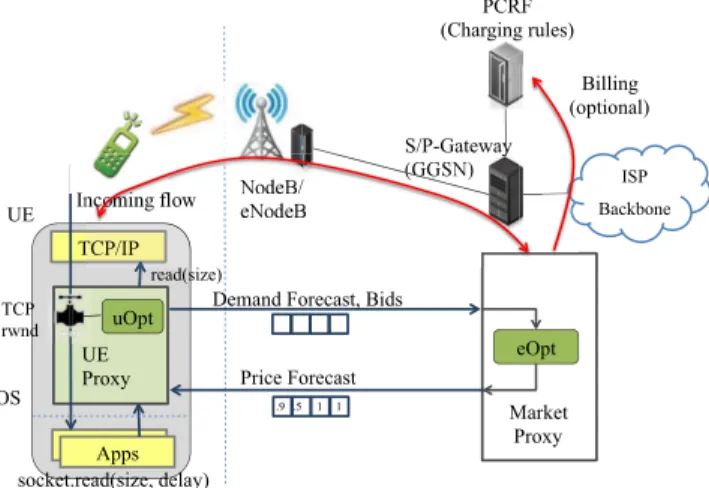
Figure 6 provides a high-level overview of the CoAST architec-ture. It consists of two major components: amarket proxythat re-sides on a cell-level network element like eNodeB and aUE proxy
on each mobile device. The market proxy collects the traffic
de-Market Proxy UE Proxy Apps TCP/IP Apps
Demand Forecast, Bids
Price Forecast socket.read(size, delay) eOpt uOpt TCP rwnd read(size) ISP Backbone NodeB/ eNodeB S/P-Gateway (GGSN) PCRF (Charging rules) UE Incoming flow Billing (optional) .9 .5 1 1 OS
Figure 6: CoAST Architecture.
mands for some future time window from all mobile devices in a cell. These are used by the market proxy as parameters of an op-timization problem (eOpt) which determines new future prices for each UE (for the next time window) with the goal of minimizing the traffic peak in the cell. The traffic demands and prices may also be reported to the LTE network for accounting and billing purpose. On the user side, applications determine their traffic demands in a manner that satisfies their delay constraints and sends this infor-mation to its UE proxy through the user library. The UE proxy uses these demand information as inputs to an optimization prob-lem (uOpt) that attempts to minimize the cost of satisfying these demands based on prices obtained from the market proxy. CoAST also includes a mechanism by which applications can control their traffic according to the outputs of uOpt.
4.3 Control Plane
CoAST ensures that the traffic demand does not exceed the net-work capacity at any time without affecting the user experience of mobile applications. Let’s denote the capacity of a cell sector byc,
the throughput at timetof theithflow under the control of CoAST by thi(t), and the total throughput of all other flows bythb(t).
CoAST’s goal can be expressed as optimizing an objective function of the difference between the throughput and capacity over time, as follows: min Φ({ n i=1 thi(t) +thb(t)−c}) (1)
whereΦcan be any meaningful utility function. For simplicity of description, we omit the constraints in Eqn 1 and will present them in Eqn 4.
One design challenge is the fact that CoAST has neither control nor accurate information about the background traffic in the cell. By background traffic, we mean all mobile traffic generated by ap-plications that do not use CoAST. Given the burstiness of mobile traffic as shown in Figure 2, it’s also hard to accurately predict the background traffic using historical information. To solve this prob-lem, CoAST optimizes the maximal throughput of theflows under its control over time, as follows:
min max t n i=1 thi(t) (2)
Therefore, no information of the background traffic is required.
Letth∗b= maxtthb(t). A pleasant property of this objective
func-tion is that it is equivalent to minimizingn
will be proved in Section 4.5. When enough numbers of UEs use CoAST, the peak throughput of total traffic will be minimized.
A centralized solution to Formula 2 would require the market proxy and the UE proxies to share information of allflows, re-sulting in a lot of control overhead. Moreover, it violates our pri-vacy preservation design goal. Thus, a distributed control protocol that exchanges limited information is required. To solve this prob-lem, we use the dual decomposition method [20] to decompose the original problem into a master problem and multiple independent sub-problems. The master problem (eOpt) is solved by the market proxy, while the independent sub-problems (uOpt) are solved by the UE proxies. We describe this control protocol next.
At a high level, the control plane functions as follows: The mar-ket proxy periodically computes the projected prices for mobile traffic for some time window in the future. These prices are cal-culated based on the traffic demand collected from all connected UEs. The prices are broadcasted to all connected UEs. Each UE proxy uses the price information from the market proxy and the demand information from its mobile applications to schedule the mobile traffic such that the demand of each application is satisfied and the overall cost is minimized. The UE proxy then sends back the traffic demands that it calculates for some future time window to the market proxy, and the process is repeated.
4.3.1 Market Proxy Operations
The market proxy operates in time slots with lengthτ (e.g., 1 second). The time slot that timetbelongs to is denoted astτ =
t−t0
τ , wheret0is the start time. Letp(tτ)represent the price
for the downlink traffic through a cell sector during time slottτ.
Letthe(tτ)represent the downlink traffic demand of UEe
dur-ing time slottτ.
In everyδseconds (e.g., 0.1), the market proxy receives a vector of traffic demand for the nextκ(e.g., 30) time slots, i.e.,the =
{the(tτ), the(tτ+1), . . . , the(tτ+κ)}, wheretis the
cur-rent time. Then it updates the price vector , i.e.,p={p(tτ), . . . , p(tτ+κ)}, as follows: p= [p+β( e the−α)]H (3) whereα = maxt
ethe(t),[p]H represents the projection ofp
onto the hyperplaneH ={p(t)|tp(t) = 1, p(t) ≥0}, andβ
is the step length. The value ofβis set to ensure that∀t,|p(t)− p(t)|< p(t)/10in our implementation.
The market proxy then broadcasts the prices to all UEs in the cell.
4.3.2 UE Proxy Operations
The UE proxy collects the information about traffic demand per slot (τ) forκslots into the future from all mobile applications and
periodically receives the future price information from the market proxy. It generates the future traffic demand,the, and sends it to
the market proxy.
Each mobile application reports its delay constraints for the next
κtime slots to its UE proxy. Let’s useD, t, i.e., a tuple of the
amount of dataD and its deadlinet, to express the delay con-straint that dataDshould be downloaded before deadlinet.
There-fore, for a specificflowi, its delay constraints can be expressed
as a set of tuples, i.e.,{Di,0, ti,0,Di,1, ti,1, . . . ,Di,n, ti,n},
whereti,0 < ti,1 < · · · < ti,n. Let’s define functiondi(t) =
T
j=0Di,j, whereti,T ≤t≤ti,T+1. It represents the amount of
data required to be transferred before timet.
When a UE proxy receives the price information from the mar-ket proxy, it tries to minimize the cost of transferring data under
the constraint that the delay constraints of allflows are satisfied. Specifically, at timet∗the UE proxy solves the following
optimiza-tion funcoptimiza-tion: min i t∈T thi(t)×p(t) s.t. i thi(t)≤bd,∀t∈T i t≤t thi(t)×τ≥di(t),∀t∈T (4)
wherethi(t)is the throughput offlowiat timet,bdis the
band-width, andT ={t∗τ, . . . ,t∗τ+κ}.
By solving the above optimization function we obtain the de-sired throughput of all downlinkflows over time. thi(t∗τ)
cor-responds to the bandwidth allocated toflowiin the current time
slot. The UE proxy will send this value back to the mobile ap-plications to control their traffic in the data plane accordingly as described in Section 4.4. It should be noted that those constraints may not be satisfied, i.e., the available bandwidth may be smaller than the traffic demand. Under such scenario, CoAST will allow mobile applications to transfer data as fast as possible and let users decide if they want to stop some applications.
The UE proxy will send{the(t)|the(t) =
ithi(t), t∈T}to
the market proxy. The market proxy collects such traffic demands from all UEs in the cell and updates the prices in the next round.
4.4 Data Plane
The primary functionality of the CoAST data plane is to control the downlink traffic based on the throughput cap assigned by the control plane. As most of the mobile applications we are consid-ering use TCP and we don’t want to modify the server, we focus on controlling the TCP traffic from the receiver side. It is also im-portant to note that while the control plane operates with a window of projected demands and prices, the data plane only controls the traffic for the current slot.
In TCP the amount of data that the sender can send within an RTT is limited bymin{cwnd, rwnd}wherecwndis the
conges-tion window size, andrwndis the receiver’s window size adver-tised in the acknowledgement packets. When cwnd is larger than rwnd, rwnd will determine the throughput of a TCPflow. To control the downlink traffic from the receiver side, we set an upper-bound on rwnd as:
DL_CAP= max{throughput×RTT,MSS} (5) wherethroughputis the target throughput assigned by the control
plane. When throughput is very small, DL_CAP is set to MSS to avoid totally blocking theflow. In our implementation, we add a new socket option, DL_CAP, to allow applications to dynamically specify the upper-bound on the advertised receiver’s window size at runtime.
It’s noteworthy that the receiver will obtain the required down-link throughput after one RTT since the sender receives the new advertised rwnd after RTT/2 and then spends RTT/2 to deliver the new packets to the receiver. When RTT is large (e.g., 1 second), the receiver should use the estimated future throughput to set DL_CAP.
4.5 CoAST Performance Guarantee
The primary goal of CoAST is to schedule the last-mile traffic to ensure that the total traffic demand does not exceed the network capacity. For scalability, CoAST is designed as a distributed system that only schedules the traffic under its control. A natural question
is whether the CoAST design meets its goal. Here we present a theoretical analysis to answer this question.
CoAST uses an iterative control protocol between a market proxy and a set of UE proxies to schedule the traffic. This control protocol allows CoAST to minimize the maximal throughput offlows under its control over time. Formally, we have the following theorem:
THEOREM 1. With the interaction interval,δ, approaching 0, CoAST approaches the optimization goal defined in Formula 2.
Its proof can be found in Proof 1 of the Appendix. As CoAST minimizes the maximal throughput offlows under its control, it also reduces the maximal throughput of allflows including those background traffic. Formally, we have the following theorem:
THEOREM 2. Assumeni=1thi(t)andthb(t)are independent
random variables. Witht→+∞, the expected value of the peak
throughput obtained by using CoAST approachesmaxt
n
i=1thi(t)+
maxtthb(t).
The proof can be found in Proof 2 of the Appendix. Thus, when the number of UEs that uses CoAST is large enough, CoAST can significantly reduce the overall peak traffic.
5. DEPLOYMENT AND IMPLEMENTATION
In this section, we discuss various ways in which CoAST can be deployed on a real network and describe our prototype implemen-tation.5.1 Deployment
CoAST proposes two new functions to be added to the cellular network: a UE proxy for each mobile device and a market proxy for each cell sector. The UE proxy interacts with mobile applica-tions running on the UE to collect their delay constraints and al-locates bandwidth to them. The market proxy aggregates demand information from all the UEs in a cell and sets the prices. UE and market proxies communicate with each other to exchange demand and pricing information. The network elements on which these functions are deployed determines both the information available to CoAST and the changes needed to the network. We consider three deployment options and their merits.
Clean Slate:The market proxy for a cell and the UE proxies for all UEs in the cell are hosted in the cell’s eNodeB. Mobile appli-cations directly communicate their requirements to their UE proxy through extensions to the 3GPP RAN control plane (via mobile OS APIs to expose these extensions). The UE proxy directly controls bandwidth allocations through the eNodeB scheduler. Because the market proxy also resides on the eNodeB, it has full access to cell utilization information when setting prices and no latency between the UE and market proxy. The market proxy can also compare re-ported traffic and real traffic to detect price manipulation. While this represents the cleanest and most functional design, it requires changes to the 3GPP protocol to exchange demand and price in-formation, to eNodeBs, and to the mobile OS, and thus may be difficult to deploy.
Incremental: The UE proxy is deployed on the mobile device
as a daemon process, while the market proxy is deployed by the network provider as a new network element in the packet core. The UE proxy interacts with mobile applications through user library calls for collecting delay constraints and allocating bandwidth (via a controlled socket abstraction). Interaction between the UE and market proxy for exchanging demand and price information oc-curs using the normal cellular network data plane, through a well known UDP port and a special destination IP address that points to
the market proxy for the current cell. This configuration imposes higher latency between the UE and market proxies, but because the market proxy is deployed by the network provider, it can be made as low as possible. Also, the market proxy may be given access to real-time traffic information through a private interface to the eNodeB as well as the provider’s charging and data metering sys-tems [21]. Thus, it provides most of the benefits of the clean slate design while being easier to deploy - 3GPP protocols or eNodeBs do not have to be extensively modified on the provider side, while the UE proxy can be implemented as a user space library without modifying the mobile OS on the UE side.
Over-the-top:The UE proxy is deployed as a library on the UE
just as in the incremental design, but the market proxy is deployed as a third-party service on an external cloud server, possibly even on an application-by-application basis. E.g., a large video stream-ing provider may have its own market proxy that serves to smooth only its own traffic within a cell and improve the performance for its own users. In this design, when a mobile device connects a cell, its UE proxy uses the cell ID tofind the IP address of the corre-sponding market proxy through standard DNS mechanisms. UE and market proxies exchange information through UDP as in the incremental design, but the third party nature of the market proxy precludes the market proxy from basing its pricing decisions based on real-time traffic information (e.g., it cannot lower prices during periods of low utilization to incentivize more aggressive transfers) or from actually providing real monetary incentives to users. How-ever, the design requires no modification to any cellular network elements, or to the mobile OS, and thus is the easiest to deploy.
Due to its ease of deployment, we chose the over-the-top design for our prototype. However, the goal of this paper is to evaluate the feasibility of CoAST and quantify its benefits and costs instead of advocating a particular deployment choice. Our evaluation will hold irrespective of the design chosen.
5.2 Prototype Implementation
We implemented market proxy on a Linux system with a dual-core 2.53 GHz CPU and 4GB of RAM. The market proxy divides time into 1-second slots and dynamically sets the prices for future 30 time slots. Every 100ms the market proxy collects the traffic demands for the future 30 time slots from all mobile devices that connect to it. Then it updates the prices based on the aggregated traffic demand and sends the new prices to all the mobile devices.
Ideally the market proxy should reside on a cell-level network element like the eNodeB in a 4G LTE network or the RNC in a 3G network where it can also monitor the traffic over the cell. How-ever, because we have no access to such network elements, we have to run the market proxy on a remote server whose RTT to the mo-bile devices through a 4G LTE network is 57ms on average. Since the RTT between the market proxy and UE proxies is much smaller than their interaction interval (i.e., 100ms), the functionality of the control plane will not be affected.
We implemented the UE proxy on Android 4.1. It is imple-mented as an Android application collecting delay information from mobile applications and the prices from the market proxy and as-signing throughput caps to the mobile traffic. To dynamically con-trol the downlink traffic from the receiver side, we also patched the Android kernel to add a new socket option, DL_CAP, to limit the maximal throughput of the TCPflows at runtime.
5.2.1 Communication and Computation Overhead
The traffic demands and prices are the only data exchanged be-tween the UE proxy and the market proxy. In the current imple-mentation, we use 2 bytes for the traffic demand and 1 byte for the
price in each time slot. Therefore, each UE proxy uploads 60 bytes and downloads 30 bytes from the market proxy in every round. Since they exchange information every 100ms, the control over-head in this case is 600 Bytes/s in the upload direction traffic and 300 Bytes/s in the download direction in the worst case. The over-head is much lower in reality because of two reasons. First, the UE proxy will exchange information with the market proxy only if some communication-intensive applications (e.g., video stream-ing) are running. Second, compared with the high traffic volume of those target applications, the extra communication overhead of CoAST is negligible. As the experiment in Section 6.2 will show, CoAST only leads to 0.07% extra traffic.
The computation overhead is also very low. The market proxy updates the prices by solving a projection problem. Its computa-tional complexity isO(κ)whereκis the number of time slots (30
in our implementation). The UE proxy needs to solve an optimiza-tion problem that minimizes the cost under the delay constraints. As we discretize time into time slots, the maximal number of delay constraints for aflow isO(κ). The optimization problem can be
solved by graduallyfinding the minimal cost for each constraint. Therefore, its computational complexity isO(f ×κ2×log(κ)),
wheref is the number of concurrentflows. On an old Motorola
ATRIX smartphone with Android 2.3, it takes less than 1ms for the UE proxy to solve the problem for 100 concurrentflows.
6. SYSTEM EVALUATION
In this section, we evaluate the CoAST prototype as described in Section 5.2. We will demonstrate how CoAST improves the per-formance of mobile applications under various LTE network con-gestion states.
6.1 Experimental Setup
Our testbed is composed of 5 Linux workstations and 4 Android smartphones with 4G LTE capability. Thefirst workstation acts as the market proxy. Its average RTT to these smartphones through the LTE network is 57ms. The other 4 workstations act as the remote mobile application servers, each of which serves one smartphone. The Linux traffic control tooltcis used on application servers to control their available bandwidth. We make sure that all these smartphones connect to the same cell during the experiments by checking the cell id of their connected cell. All experiments are conducted in a residential area around midnight to reduce the im-pact of other cellular users.
CoAST is designed to improve the performance of mobile appli-cations when the LTE network is congested. We use following mo-bile streaming strategies to create different levels of network con-gestion and streaming behavior. The evaluation for other types of mobile applications (e.g. web browsing) will be presented in Sec-tion 7. Wefind that the streaming strategies impact the distribution of mobile traffic and how they interact with each other in CoAST.
• All-at-once: strategy aggressively transfers data from the
server to the client as fast as possible. This strategy is usu-ally used by some audio streaming [22] and video streaming applications on some specific phones [28].
• Pacing: strategy controls the download throughput at the
“steady state” after initial buffering. This strategy is widely used in video streaming services such as Youtube, Hulu, and Netflix [10].
• Bundling: strategy is proposed to reduce the energy
con-sumption of video streaming applications [28]. It divides
0 5 10 15 20 25 30 0 500 1000 1500 2000 2500 3000 Time (second) Throughput (kB/s) Stream 1 Stream 2
(a) Native LTE network
0 10 20 30 40 0 500 1000 1500 2000 2500 3000 Time (second) Throughput (kB/s) Stream 1 Stream 2 (b) CoAST
Figure 7: The interaction between two video streams
the entire stream into several large chunks and aggressively transfers each chunk periodically.
We use two metrics to evaluate the impact of CoAST on mobile users:
• Buffering time:It is a direct measure of the user experience for streaming applications. We consider both initial buffering period and rebuffering period in the steady state.
• Energy consumption: The energy consumption of video
streaming is primarily caused by the device screen in the “on” state and the LTE network interface. For fair compar-ison, we use the LTE energy model that calculates energy consumption based on traffic traces [15].
6.2
The Reduction of Buffering Time in Video
Streaming
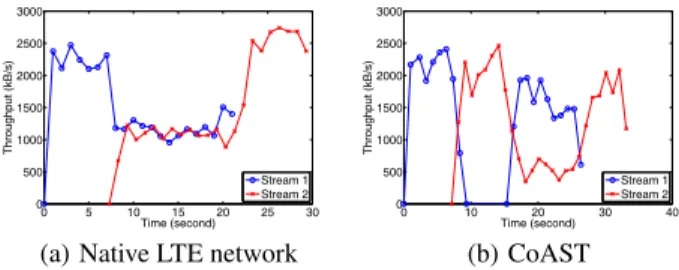
Wefirst demonstrate the basic mechanism through which CoAST enables collaborative traffic scheduling via a simple two-device video streaming experiment. Let the two devices start streaming two HD videos at time 0s and 7s, respectively. Both of them use the all-at-once strategy. The LTE cell is the only bottleneck of both streams.
Figure 7 plots the throughputs of two streams for the native LTE network and CoAST cases. In the native LTE case, stream1 is un-aware of the traffic demand of stream2 and, thus, continues down-loading data from its server even after stream2 starts. Therefore, the initial buffering period for stream2 is twice as long as that of stream1. In CoAST, when stream2 starts at 7sec with an empty buffer, it tries to download aggressively, thus causing the market proxy to increase prices due to the increased demand. Because stream1 has a relatively full buffer, it is less willing to pay the in-creased price than stream2, and thus delays its traffic. After some time, when stream2 has buffered enough data for playback, it re-duces its willingness to pay higher prices, and thus begins delaying its data more. In the meantime, stream1 has already played back a portion of data in its buffer and becomes more aggressive to meet its delay constraints. Due to this cooperative inter-play between the UEs — the UE with full buffer deferring its download in fa-vor of the UE with empty buffer— the buffering time of stream2 is reduced by 50% while that of stream1 is not affected.
By exchanging traffic demands and prices between the UE prox-ies and the market proxy, CoAST incurs a total of 47.5 kB extra traffic in the experiment. Compared with the total download traffic (i.e., 64 MB), CoAST only incurs a 0.07% communication over-head.
6.3 The Impact of Network Congestion
Next we evaluate the impact of traffic demand on CoAST per-formance by varying the stream bitrate from 400 kb/s (i.e., average Youtube bitrate [11]) to 3200 kb/s while keeping the number of400 800 1600 3200 0 2 4 6 8 10 12 Bit rate (kbps)
Reduced buffering time (%)
(a) The reduced buffering time
400 800 1600 3200 0 100 200 300 400 500 600 Bitrate (kb/s) Energy (J) Native CoAST (b) Energy consumption
Figure 8: The impact of taffic demand on CoAST performance
All−at−once Pacing Bundling 0
20 40 60 80
Reduced Buffering Time (%)
(a) The reduced buffering time
All−at−once Pacing Bundling 0 100 200 300 400 500 600 Energy (J) Native CoAST (b) Energy consumption
Figure 9: The impact of streaming strategies on CoAST perfor-mance
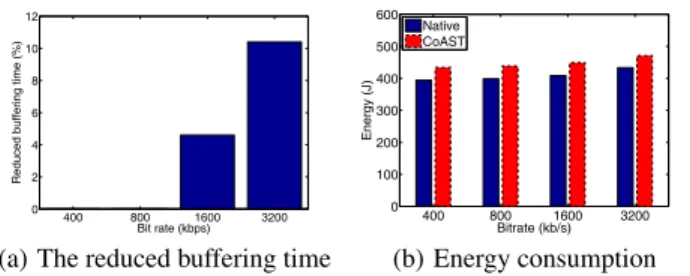
streams unchanged. We randomly start 4 streams within 30 sec-onds. The length of each stream is 3.33 minutes, i.e., the median Youtube video length [11]. The upload bandwidth of servers are unlimited, i.e., the LTE cell is the only bottleneck. Each experi-ment is repeated 3 times with different random seeds. The average values are reported.
Figure 8 plots the reduced buffering time and average energy consumption of the smartphones. It is clear that the benefits of CoAST start increasing with the increase in traffic demand (i.e. bi-trate in the experiments). When the bibi-trate is 3200 kb/s, CoAST is able to reduce buffering time by more than 10% on average. It is exactly the design goal of CoAST, i.e., to reduce the impact of increased mobile traffic on user experience.
Figure 8(b) also shows that CoAST increases the energy con-sumption by less than 8% in all the experiments. More importantly, with the increase in traffic demand, the extra energy consumption is even smaller (e.g. 7% for 3200 kb/s case). The increase in energy consumption is caused by longer streaming time in CoAST. Note that energy consumption is based on the assumption that there is no background traffic. Otherwise, CoAST will incur even smaller energy consumption overhead.
6.4 The Impact of Streaming Strategies
Finally we evaluate the impact of streaming strategy on the per-formance of CoAST. The stream bitrate is 3200 kb/s. Other pa-rameters are the same as previous experiments. The experiment results are shown in Figure 9. When the all-at-once strategy is used, CoAST reduces buffering time by 66%. However, it also increases the energy consumption significantly if the entire video is downloaded. Compared to the pacing strategy, CoAST incurs similar buffering time and slightly more energy consumption in the bundling strategy.7. TRACE-DRIVEN EVALUATION
In this section, we demonstrate the potential benefits of CoAST by using trace-driven evaluations of real-world cellular traffic traces from a large US mobile network operator.
7.1 Experimental Setup
We implement CoAST on a packet-level simulator, ns-3 [3], which supports the simulation of LTE networks. The network is com-posed of an eNodeB, a remote server and multiple mobile devices. The market proxy is installed on the eNodeB, while the applica-tion servers are installed on the remote server. All mobile devices connect to the same eNodeB during the experiments. We use the default parameters for all the experiments.
Traffic traces:We identify the top 100 heavily-loaded cell sectors in our cellular traffic dataset and evaluate how CoAST reduces their peak throughputs within 1 day. For each cell, we generate theflows for Youtube video streaming and web browsing as follows.
• YouTube video streaming:We identify allflows from Youtube
servers to the mobile devices in the cellular traffic dataset. But onlyflows whose size and duration are large enough (i.e., size > 100 kB and duration > 10 s) are treated as streaming flows. Since we don’t have video information (e.g., bitrate, video length) in our dataset, we use the empirical models from [11] to generate the video profile for eachflow. The pacing strategy is used to control the stream.
• Web browsing: Wefirst identify all web traffic using port
number 80. If twoflows between the same source and des-tination start within 5 seconds, they are considered as be-longing to the same browsing event. Using this method, we obtain a set of browsing events with their start time instants. Since the dataset doesn’t contain the identity of the web page, we randomly pick one of the top 500 Alexa websites for each browsing event.
Metrics: We compare CoAST against the native network using
the following metrics:
• Peak reduction: This is the most important metric because
the goal of CoAST is to reduce the peak cell throughput. It is defined asP eaknative−P eakCoAST
P eaknative .
• Discount: A key promise of CoAST is that mobile users
will also benefit from CoAST and, thus, be willing to use it. We useDt−Da
Dt to denote the user benefit, whereDtis the
amount of transferred data,Dais the amount of accounted
data.
• Overhead: We also analyze if CoAST causes any overhead,
including energy consumption and RRC signaling overhead [14].
We acknowledge that our trace-based evaluation has some limi-tations. First, there is no system feedback. By scheduling the traf-fic better, CoAST may cause mobile users to use more data and, thus, increase the peak traffic. However, our experiments cannot capture this phenomenon. Second, the user behavior in using ap-plications is not available. For video streaming, the user may skip ahead or pause the video. For web browsing, the user may quickly scroll down in the webpage. These user behaviors impact the delay constraints of the corresponding traffic and, thus, affect the perfor-mance of CoAST.
7.2 Experimental Results
7.2.1 Video Streaming Experiments
Wefirst perform simulation-based video streaming experiments using 100 heavy-loaded cells for 1 day. In all experiments we only consider Youtube video streams. As shown in Figure 10, CoAST
0 20 40 60 0 0.2 0.4 0.6 0.8 1
The Reduction on the Peak Throughput (%)
CDF
(a) The Peak Reduction
0 20 40 60 0 5 10 15 20 25
Average Reduction on the Peak Throughput (%)
Average Discount (%)
(b) Discount
Figure 10: The performance of video streaming supported by CoAST on various sectors.
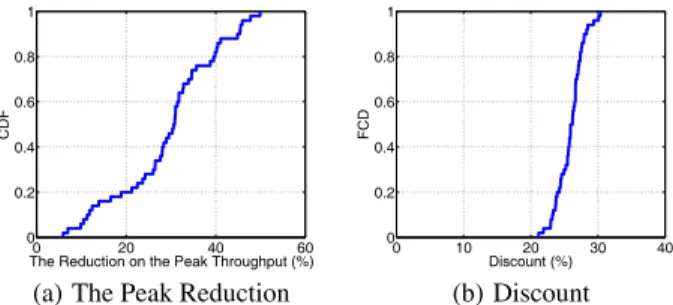
successfully reduces the peak throughput for all cells. We also ob-serve the following phenomena. First, the peak reduction ranges from 5% to 55% for different cells, as shown in Figure 10(a). More than 30% cells reduce their peak by 30%. The high variation of the peak reduction among different cells is probably caused by diverse distribution of Youtube video streams among various cells. Cells with more video streams are able to achieve better performance. Second, the average discount obtained by the mobile users corre-lates with the peak reduction on the cells, as shown in Figure 10(b). Finally, none of the videos is paused during the experiments.
Next we explore how the reduced peaks actually help increase the capacity of cellular networks by examining the impact of in-creasing user demand on application level performance with and without CoAST. Specifically, we increase the users/spectrum ratio and measure how long the video streams pause waiting for more data. However, rather than increasing the number of users in a cell artificially, we increase the ratio by reducing the effective band-width (spectrum) available to a cell by a fractionα ∈ [0,1), i.e.,
Capacity =(1−α)×MaxCapacity. The average values of video pause time over 100 cells are reported for different values ofαin
Figure 11. We see that CoAST results in very little application per-formance degradation while supporting a capacity increase of up to 20% (α = 0.2). Also, for the same value of application
per-formance degradation, CoAST can support more users per unit of available spectrum. 0 5 10 15 20 25 30 35 0 100 200 300 400 α (%)
Total pause time (s)
Native CoAST
Figure 11: Comparison of video pause time for different num-ber of users with and without CoAST.
7.2.2 Experiments on Web Browsing
Web browsing is another important application that can benefit from CoAST because of its delay tolerance. Unlike video stream-ing, web browsingflows are relatively small. In this subsection, we analyze the performance of CoAST-based web browser.
First, we consider the simple scenario that all cellular traffic are web traffic. For each browsing event, we randomly choose one of
0 20 40 60 0 0.2 0.4 0.6 0.8 1
The Reduction on the Peak Throughput (%)
CDF
(a) The Peak Reduction
0 10 20 30 40 0 0.2 0.4 0.6 0.8 1 Discount (%) FCD (b) Discount
Figure 12: The performance of web browsing supported by CoAST on various sectors.
the top 500 Alexa websites in the “news” category. We report the results for the 100 heavy-load cells in Figure 12.
As expected, CoAST-based web browser reduces the peak through-put for all cells. Like in video streaming experiments, the peak re-duction varies significantly among cells, ranging from 6% to 50%. However, different from video streaming, CoAST-based web browser helps more than 55% cells achieve more than 30% peak reduction. In addition, as shown in Figure 12(b), the average discount obtained by the mobile users ranges from 22% to 31%, which is more than video streaming case. This is because web browsingflows are usu-ally very small and are able to take advantage of the variation in price. 0 20 40 60 0 0.2 0.4 0.6 0.8 1
The Reduction on the Peak Throughput (%)
CDF
(a) The Peak Reduction
0 10 20 30 0 0.2 0.4 0.6 0.8 1 Discount (%) CDF Video Streaming Web Browsing (b) Discount
Figure 13: The performance of both video streaming and web browsing supported by CoAST.
Next, we evaluate the scenario in which both video streaming and web browsing use CoAST to schedule their traffic. Video streaming and web browsing are the most important mobile appli-cations, accounting for more than 70% mobile traffic. The experi-mental results are plotted in Figure 13. In this more realistic sce-nario, CoAST helps all cells to reduce their peak throughputs. We also plot the discount obtained by video streaming and web brows-ing in Figure 13(b). Web browsbrows-ing is still able to obtain higher discount than video streaming.
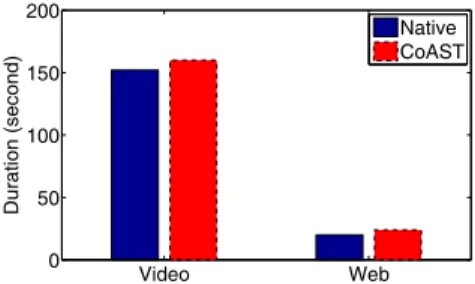
In Section 6, we noticed that CoAST slightly increases the en-ergy consumption in some scenarios. This is because by delaying mobile traffic, mobile devices need to keep the network interface active for longer duration, resulting in extra energy consumption. To analyze the overhead of CoAST, we assume that the mobile de-vice is initially in the RRC_IDLE state, and there is no other traffic on the mobile device. We use the RRC state model [15] to ana-lyze the overhead. For both video streaming and web browsing, the mobile devices always stay at the RRC_CONNECTED state when using these applications. Thus, CoAST does not introduce extra RRC state transitions. However, CoAST does keep cellular interface alive for slightly longer duration and, thus, consumes a little more energy. Figure 14 shows that in CoAST, the mobile
de-Video Web 0 50 100 150 200 Duration (second) Native CoAST
Figure 14: The time duration at RRC_CONNECTED state for video streaming and web browsing.
vices stay slightly longer in the RRC_CONNECTED state than the native case.
7.2.3 The Impact of Partial Deployment
CoAST reduces the peak throughput by rescheduling the traffic of mobile devices under its control. The number of participating mobile devices will impact the CoAST performance. In this sub-section, we evaluate the performance of CoAST when only a por-tion of mobile devices support it.
50 60 70 80 90 100 0 10 20 30 Participation Rate (%) Peak Reduction (%)
Figure 15: The impact of partial deployment on CoAST per-formance.
In this set of experiments, we randomly selectr% mobile
de-vices to support CoAST, wherervaries from 50 to 100. The video streaming application is used in the evaluation. Each experiment is repeated 10 times with different random seeds. We report the average value of all the 100 cells.
The experimental results are shown in Figure 15. It’s clear that the participation rate has significant impact on the CoAST perfor-mance. Whenrreduces from 100 to 50, the average peak reduction decrease from 27% to 8%. We also observe that the slope of the curve decreases with the increase of thervalue. This is because
the peak value of the background traffic will be higher when the participation rate is low. Thus, according to Theorem 2, the peak reduction achieved by CoAST will be much lower. This set of ex-periments indicate the importance of increasing the participation rate in CoAST.
To analyze whether partial deployment will impact the user expe-rience of early adopters or non-adopters, we compare the buffering time of streaming applications in the above experiments and that in LTE networks. The buffering time of each stream in both scenarios are the same in all experiments. This is because CoAST tries to sat-isfy the delay constraints of all adopters. When the network is not very congested, their delay constraints can be easily satisfied. In contrast, when the network is persistently congested which is un-common in our dataset, adopters behave the same as non-adopters,
i.e., downloading as fast as possible without rescheduling their traf-fic.
Therefore, the partial deployment will primarily impact the peak reduction with little impact on the user experience of mobile appli-cations.
7.2.4 The Impact of Design Choices
In this subsection, we evaluate the impact of CoAST parameters and network factors on the performance of CoAST.
0 100 200 300 400 500 600 700 0 5 10 15 20 25 30
The Interaction Interval (ms)
Peak Reduction(%)
Figure 16: The impact of interaction frequency between UEs and the market proxy.
In thefirst set of experiments, we analyze the impact of the inter-action frequency between the UE and Market proxies. We change the interaction interval (i.e.,δ) from 50 ms to 700 ms, while other parameters are kept unchanged. The video streaming application is used in the evaluation. We report the average value of all the cells. The experimental results are shown in Figure 16. When the in-teraction interval is less than 100 ms, CoAST achieves similar per-formance in terms of peak reduction. As the interval increases from 100 ms to 500 ms, the average peak reduction slightly drops from 27% to 24%. When it further increases to 700 ms, the obtained peak reduction is quickly reduced to 15%. This is because the con-trol plane of CoAST utilizes an iterative protocol that gradually op-timizes its performance in each iteration. When interaction interval is too large, it is hard for the system to converge to the optimal so-lution. On the other hand, increase in interaction frequency results in more communication overhead. From our experiments, wefind that 100 ms is a good choice as it achieves good tradeoff between performance and overhead.
0 20 40 60 80 100 0 10 20 30 40
RTT between UE and Market Proxy (ms)
Peak Reduction (%)
Figure 17: The impact of the delay between UEs and the mar-ket proxy. The interaction interval is 100 ms.
In the second set of experiments, we analyze the impact of the distance between the UE and market proxies. We vary the RTT between them from 10 ms to 90 ms. The results are reported in Figure 17. We observe that the RTT between UE proxy and market proxy has very small impact on peak reduction. This indicates that CoAST can still achieve good performance even if it is not possible
to deploy the market proxy in cellular network elements close to the end user devices, like eNodeB in LTE or NodeB in 3G networks.
8. DISCUSSION
In this section, we discuss how the mechanisms proposed by CoAST interact with other existing and proposed mechanisms in the RAN.
3GPP quality of service: The LTE specification provides a QoS model based on Quality Class Indicators (QCI) [5]. A UE may create bearers with one of up to 9 QCI classes, each with a differ-ent priority (diffserv), packet delay budget, loss rate, and bitrate guarantee. Many cellular providers today reserve QCI only for managed services (e.g., IMS), and do not expose QCI classes to third party applications. Because CoAST is an over-the-top proto-col that can operate without any support from 3GPP infrastructure, it is applicable even on networks which do not expose QCI. Fur-thermore, QCI provides a static and inflexible partitioning of ap-plications into a small number of priorities. It is not sufficient for scenarios presented by both our examples — streaming and web browsing — in which thesameapplication requires different QoS and delay tolerance at different times, depending on the context. Furthermore, any non-collaborative mechanism cannot coordinate behavior across multiple UEs the way that CoAST does.
Congestion aware pricing/control: Access to real-time conges-tion informaconges-tion at the eNodeBs is not exposed through 3GPP stan-dardized interfaces. Therefore, to remain independent of vendors-specific implementations, CoAST does not assume any access to the eNodeB, including information about whether there is cell con-gestion or not. Instead, it tries to continuously minimize the peaks across the applications whose traffic is managed through its APIs, independently of other background traffic. If real-time congestion information could be made available, it could easily be used to trigger when CoAST optimization mechanisms kick-in and provide improvedfidelity and price control to the market proxy’s demand estimation step. We leave this extension to future work.
RNC/eNodeB schedulers: The UMTS RNC or LTE eNodeB
have a scheduler that allocates scrambling codes (variable sized slices of the spectrum) to UEs every 2ms based on their demands, QCI, channel noise, and overall cell congestion. Beyond differen-tiation using QCI, this scheduler isapplication context agnostic. CoAST does not interfere with this scheduler because it operates at a much coarser granularity (hundreds of msec). CoAST adds an additional application aware layer of control on the top, and helps the RAN scheduler by reducing demand peaks themselves, thus re-ducing the need for the RAN scheduler to allocate less than what UEs demand. However, the RAN scheduler can have an impact on applications that use CoAST because it may restrict the bandwidth available to a UE (because of noise or congestion), and thus de-crease the amount of time an application’s data can be delayed. To solve this problem, CoAST should take the radio link condition into consideration. We leave it for future work since it requires deeper integration with the eNodeB scheduler.
Energy vs. congestion tradeoffs: Several proposals have been
made in the literature to help mobile devices save energy by batch-ing mobile traffic into short concentrated bursts and reducbatch-ing the time UE radios spend in the active state, e.g., [24, 15]. It would seem that CoAST proposes the opposite philosophy—spread out traffic to minimize congestion. However, in reality, these two mech-anisms are relatively complementary. CoAST can just as easily work with applications where data transfers occur in bursts—e.g., web browsing. All CoAST advocates is that when there is con-tention, priority be given to the traffic on which users are waiting as opposed to applications that are justfilling up their buffers. While
this can increase the amount of time needed to transfer an appli-cation’s background data, as Figure 14 shows, the increase is not substantial. An interesting future use of CoAST is for applications to increase their price based on how much available battery they have, thus prioritizing their transfers over everyone else.
Potential for price manipulation: Because CoAST’s
mecha-nisms do not force users to transfer any data after they have indi-cated their demand forecast, it is possible that malicious users may increase the price others have to pay by falsely forecasting high demands. While it is not easy to detect one-off instances of such behavior (a user’s demand may legitimately have changed), it is easy to detect systematic abuse over a period of time by statistically comparing forecasts to actual data transfers using cellular providers existing data tracking mechanisms. Abusers may then have their bids ignored in the future, thus effectively removing them from the set of CoAST managed devices. With incremental deployment, it is possible that some legitimate applications don’t support CoAST, resulting in the discrepancy between reported traffic and the real traffic. To solve this problem, the UE proxy needs to report theflow information of those adopters, while the CoAST will only monitor thoseflows.
Impact of handover: Finally, we briefly describe CoAST’s
in-teractions with mobility mechanisms, i.e., handover. UEs detect when a handover takes place by querying their baseband chip for the current cell id. They inform the market proxy for every han-dover, which then simply assigns the UE’s projected demand to the new cell and recomputes the demand for both the old and new cells. Because we expect each market proxy to cover a relatively large area (we expect one market proxy per P-GW), the number of inter-proxy handoffs are few and are handled by the UE simply reconnecting to the new market proxy.
9. RELATED WORK
The idea of time shifting traffic to reduce the peak throughput over a link is not brand new. Many ISPs use traffic sharping against bulkflows to reduce the peak of inter-domain traffic [19]. Laoutaris et al. [17, 16] proposed intentionally using diurnal variations in Internet traffic to transfer delay tolerant bulk data over the Inter-net at off-peak times. With peak pricing, these shifts can also re-duce cost. Recently, Ha et al. [12] applied the idea of medium-to-long time scale shifting to cellular networks and proposed a time-dependent pricing mechanism, TUBE, to motivate mobile users to shift some cellular traffic sessions from peak time to off-peak times in exchange for lower prices. CoAST is fundamentally different from TUBE in many aspects. First, TUBE utilizes medium-to-long time-scale variation of the background traffic and thus are only suit-able for applications that can tolerate substantial delays. Second, CoAST requires no involvement of mobile users, while TUBE re-quires user change their behavior. Third, CoAST also has a data plane to