Improvement of salt raw material procurement and inventory
planning at Bitung
Indri Hapsari, D Natalia Prayogo, C M Geraldo Liembath
Industrial Engineering, University of Surabaya Email : [email protected]
Abstract The aim of this study is to integrate demand forecast, determine the quantity of raw
material requirements, and select the best supplier for the salt production process accurately. The steps start from demand forecasting, continue with supplier selection based on some criteria, and comparison between percentage of inventory costs and percentage of total costs in existing and proposed methods. After changing the period, the smallest error was achieved from moving average with 5 periods. The forecasting result was converted to raw materials in one period. Using Analytical Hierarchy Process, some supplier criteria like price, quality, service and delivery will give the total priority value of supplier A 0,356, supplier B 0,170, supplier C 0,249, supplier D 0,133, and supplier E 0,092. Supplier A became a selected supplier. The proposed method could decrease the percentage of stock out costs from 79,49% to 30,95%, but the percentage of saving cost increase from 20,35% to 68,62%. In total, the proposed method will save Rp2.587.609 or 28,61% from the existing method for six months. 1. Introduction
As main commodity, salt industry must guarantee the sufficiency of salt manufacturing as an important part to satisfy the customers. It is started with ordering the right amount and right time of raw material for production. In the opposite, lack of raw material will harm the business. Even though the salt manufacturing process is simple, the lack of raw material will delay the production process, moreover it will reduce trust from the customer, and increase the order cost because raw material must come in a short time, like backorder costs or penalty fees for the lateness. Supervision of raw material inventory must be done to make the company more efficient in spending costs and being able to arrange the supply of raw material to avoid the lack or exceed stock. This objective can be achieved by selecting good suppliers. The networking system in supply chain will be stronger with better supplier performance that will lead to mutual trust and mutually beneficial cooperation between the two parties. To get a good supplier, there is a supplier selection process to reduce risk and maximize buyer satisfaction.
Since the salt policy have implemented by the Minister of Maritime Affairs and Fisheries, Susi Pudjiastuti, supply of raw materials from outside the island has been regulated tighter. As a result, the number of suppliers that can send raw material to the company is due by shipping permit problems. This rare supply will lead to bigger problem, so the company must rearrange the order schedule to make sure the raw material will come on time. The conventional company usually does not have a standard procurement plan to determine the optimal quantity and order time, so it also leads to the lacks supply, lost sales, and lost the consumer demand. This research will help the company to determine suppliers through several criteria, so the selected suppliers can fulfil the demand in right quantity and in right time. This objective will give minimum total costs because it has less stock out and over stock.
2. Literature Review
The push supply chain was known as the built-to-stock model. This process was developed so products were manufactured in anticipation of customer needs. The idea was that the inventory could be built cost effectively and delivered against potentially known demand. On the subject of demand or demand forecasting, the increase or decrease will have a serious effect on the replenishment side of the fence. The effect of the demand velocity will certainly have an influence the amount of inventory
required. However, the confidence level variance of the demand is far more important to the inventory policy than the actual demand number [1].
Demand planning or forecasting, is what companies do when they attempt to answer this question. And yet it is remarkable how little attention companies in general give to forecasting and how little thought goes into designing a process that will yield the best possible result. Without good information about demand variability, companies are left to make critical decisions about what customer service levels to target and how to reasonably meet these targets on the basis of hunches or rules of thumb. The typical steps in the forecasting process are obtain or update historical sales (in units) of the item, cleanse the historical sales to remove noise due to predictable events, apply a statistical method to the historical sales to obtain a forecast, review the statistical forecast and adjust based on information not reflected in the historical sales, and review and publish the final unconstrained forecast and forecast--accuracy metrics [2].
The major reason for managing inventory is to reconcile the following potentially conflicting objectives between maximizing customer service and maximizing the efficiency of purchasing and production. Goods may be purchased in greater quantities than are needed in order to achieve cost efficiencies in purchasing or transportation. When goods are purchased in this way, some inventory may result. In manufacturing, long production runs (large lot sizes) of a single product are usually much more efficient than short runs. Independent demand models are methods to manage items whose demand is influenced by customer demand or demand from outside of the company control. Independent demand systems are used to determine levels of finished goods inventory. This method is used by retail, wholesale and manufacturing companies. Fixed Reorder Quantity Inventory Model is independent demand model places a “fixed order quantity” on a predetermined time schedule (daily, weekly, etc.). The actual order quantity will vary from order to order based on how many units have shipped. A maximum inventory level is established based on experience, budget or targeted inventory levels. The order quantity will be the difference between what was used during the period and the maximum (targeted) inventory. In this model a fixed quantity is established, usually using the Economic Order Quantity (EOQ) formula. The fixed order quantity is placed every time the inventory reaches a predetermined order point. This order point is set at a level whereby there is sufficient inventory to cover the demand from the time material is ordered from the supplier until it is received in the warehouse [3].
Large quantities will give lower ordering costs. If we buy a larger quantity of an item less frequently, the ordering costs are less than buying smaller quantities over and over again. In the opposite, the costs of holding the item for a longer period of time will be greater. Inventory is basically divided into raw materials, finished goods, and work-in-process. Raw materials is used to produce partial products or completed goods. Finished product is product that is ready for current customer sales. It can also be used to buffer manufacturing from predictable or unpredictable market demand. In other words, a manufacturing company can make up a supply of toys during the year for predictably higher sales during the holiday season. Work-in-process (WIP) is the item that is considered to be WIP during the time raw material is being converted into partial product, subassemblies, and finished product. WIP should be kept to a minimum. WIP occurs because of such things as work delays, long movement times between operations, and queuing bottlenecks [4].
3. Research Methods
Literature study is needed as basic theories and concepts. The literatures can be obtained from books, journals and articles from the internet. The topics that are studied are purchasing, forecasting, supplier selection, inventory management, and decision making. The data collection in this study was done by interviewing the owner and some employees and doing observation in that company. Primary data has been obtained from direct interviews with company owners about company history, organizational structure, job description, factory operational standards, type and quantity of products produced, reduction of raw materials to be processed, lost sales, employee salaries, company facilities, and
performance of suppliers. The secondary data is obtained by purchasing raw materials and information about suppliers.
After data collection, the next step is processing the data and analysing the results, with the following steps like calculate total cost of initial inventory method for 6 months and analysing it, do the back-forecast demand for 6 months using data histories. Moving average will be used with 3 until 6 periods to find the smallest MSE. It will continue with supplier selection based on certain criteria and find the best supplier using Analytic Hierarchy Process. This method is used because it can combine several criteria and find the best supplier. Then we will calculate order quantity and safety stock based on forecast using probabilistic model. The order quantity must follow the supplier’s regulation for order limitation. In probabilistic model, it treats demand as uncertain and there is possibility to stock out. To cover this problem, the probabilistic model will measure for the safety stock during lead time. We also measure Reorder Point, total cost for 6 months, and compare total costs of the initial and proposed method and analysing it. The conclusion of this research will give the company suggestion about quantity and time to order to minimize the total cost.
4. Results and Discussion
The calculation of the inventory fraction based on company assets is as follows:
Bank deposit interest = ± 5.9%/year ≈ 0.492%/month = 2.95%/6 months
Fixed employee salary = (Rp 3,000,000 + Rp 2,200,000)/month = Rp 31,200,000/6 months Warehouse Operating Costs = Rp. 700,000/months = Rp.4,200,000/6 months
The value of raw materials in the warehouse
= 25,000 kg /month x Rp. 3,500/kg x 6 months = Rp 525,000,000/6 months The inventory fraction of the warehouse goods
= (31,200,000 + 4,200,000)/525,000,000 = 0.0674 ≈ 6.74% /6 months
Inventory fraction (F) = 2.95% + 6.74% = 9.69% /6 months
Inventory fraction is come from interest of bank deposit and inventory fraction of the warehouse goods.
Requirement per day during January were 853.98 Kg. Initial inventory was 5,000 kg. Order was assumed made on the 1st of the month, and the order quantity was 25,000 kg per order. Example of calculations during January 2018 is as follows.
The value of the stockout cost per unit lost is as follows.
HPP = Direct Material Cost + Direct Labor Cost + Overhead Cost = Rp 3,500/kg + Rp 360/kg + Rp 237.12/kg = Rp 4,097/kg
Stockout Cost per lost unit = Rp 6,140 - Rp 4,097 = Rp 2,043 per kg lost
The total inventory cost of the company consists of purchasing costs, order costs, inventory costs and stockout costs for 1 period (6 months). The amount of raw material needs for one period is converted from the number of consumer demand (pack units) to kilograms raw material.
After knowing and analysing inventory, the calculation of the total cost can be done in the following way. Total cost = purchase cost + order cost + inventory cost + stockout cost
= Rp 525,000,000 + R. 15,120 + Rp 1,840,082 + Rp 7,187,969 = Rp 534,043,171/6 months
After the initial method total cost has been calculated, the proposed method is needed as a comparison with the initial method in order to find out which method is better. The first step in determining the total cost in the proposed method using consumer demand forecast. From the data plot, the demand pattern is random because demand data tends to fluctuate around the average value
without showing a clear pattern. By using Minitab 16 software, the most appropriate forecasting method to use is the moving average and single exponential smoothing. The method that is finally used is a moving average with 5 periods length because it has the smallest MSE value. The demand ratio for product A and product B is 1: 5. After finish product’s demand every month is converted into raw material for 6 months, there are 153,953.90 kg that will be needed to order.
The difference in the proposed method compared to the initial method is that there is a safety stock and reorder point to anticipate consumer demand so that it can be fulfilled. The calculation is based on the Service Level that is applied by the company. The company use Service per Demanded Unit it is known the unfulfilled demand quantity. The Q value is obtained from the demand forecasting results per month which is converted to Kg units. By using the MSE value of 21,916,777 (from demand forecasting), the calculation of the Z value is as follows.
SLU = 1 - (E (M> B)) / Q
For normal distributions, expectation values for shortages or E (M> B) are: E (M>B) = σE(Z)
The Z value obtained is equal to 0.859. After getting the Z score, the safety stock for a lost sales company can be calculated in the following way.
E (M> B) = σSS + Z = 0.859 × 0 .921,916,777 + √21,916.777 × 0.1082 = 4,527.98 kg
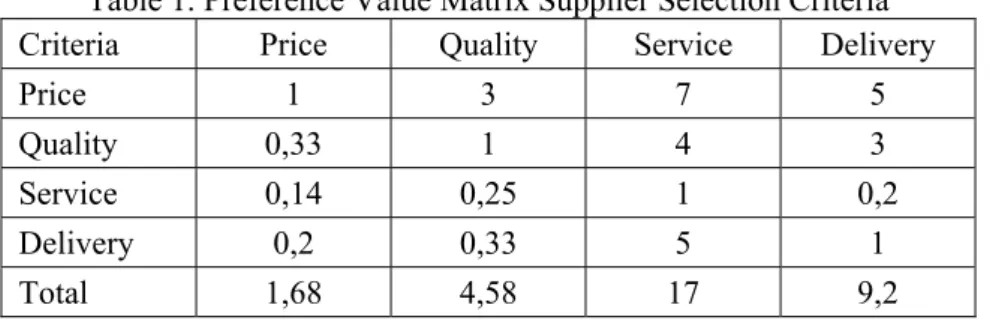
So, the size of the safety stock that must be prepared by the company is 4,527.98 Kg. Safety stock is a stock to anticipate the demand uncertainty that occurs during the lead time and to prevent lost sales. The company initially ordered raw materials at supplier A, because they have a good relationship for a long time. Decision making will be done by the Analytical Hierarchy Process or AHP method [5]. After identifying the criteria in the previous sub-chapter, the company weighted the importance of each criterion. After that the company will give weight to each supplier for each of the criteria. The criteria that is used in AHP is as Table 1.
Table 1. Preference Value Matrix Supplier Selection Criteria
Criteria Price Quality Service Delivery
Price 1 3 7 5
Quality 0,33 1 4 3
Service 0,14 0,25 1 0,2
Delivery 0,2 0,33 5 1
Total 1,68 4,58 17 9,2
After normalizing, the next step is to determine the priority weight or Eigen Value by multiplying the criteria preference value with the Total Present Value of each criterion. The next step is to
calculate the max λ value, and the result is 4,269. A Consistency Index or CI is needed to ensure that
the ratings and perceptions given are consistent. The CI values obtained were then converted into inconsistency ratios by dividing them by random index (RI). The random index value is determined based on the value of n. The comparison between CI and RI values is also called Consistency Ratio or
CR. CI has value 0.09 and CR is 0.1. Because the result of CR "≤" 0.1, a consistent assessment can
proceed to the next calculation and the data above does not need to be changed or corrected again. Furthermore, the company gives weight to each supplier alternative based on the criteria discussed earlier and compares it with other alternatives in the table. After that the values in each column will be added up. After adding up, the value of each entry or cell in the table will be divided by the sum of the column values to obtain the normalized matrix. In the normalization table, the value in each row will be summed and divided by the amount of data in that row (the value is equal to the number of alternatives). The result of the division is the TPV value for each alternative. The whole calculation is
the same as the calculation done to obtain the TPV value on the criteria. Determination of TPV in each criterion for each supplier functions as an approach to replace supplier real data that is not owned by the company and can help companies to find out the best supplier in each criterion. The next step is to add the multiplication value of TPV in the criteria table with TPV in the supplier table (in each of the criteria). The sum value is called Final Priority Value.
Examples of calculations are as follows.
Total Price Weight (supplier A) = 0.437 × TPV Price criteria = 0.437 × 0.55 = 0.241
Final Priority Value = ∑ "Total Weight of Supplier A" = 0.241 + 0.064 + 0.004 + 0.047 = 0.356
Total Priority Value for supplier A was 0.356; B supplier of 0,170; supplier C of 0.249; D supplier is 0.133 and E supplier is 0.092. Supplier A is chosen to be the supplier of the company's raw materials because it has the highest priority value.
After knowing the number of needs during one period and choosing the best performance supplier, the next step is to calculate the Fixed Order Quantity of the salt raw material. The aim is to find out the optimal number of orders of raw materials that companies should do to suppliers. The calculation is as follows:
FOQ = Q* = = 1.502,71 kg ≈ 1.503 kg
But the consideration is the minimum order amount that the company can do in supplier A is 15,000 kg (the smallest container size). Q * value of 1.503 kg means the most optimal number of orders to minimize the total cost, but in fact the order can only be done on a quantity of 15,000 kg (minimum size of supplier A order). Reorder point is the point of reorder that the company must plan. Reorder point calculations are based on average demand during lead time or M and safety stock.
= (lead time / number of working days in 6 months) × R= (7/180) × 151,954 kg = 5,909.32 kg After is obtained, the size of the reorder point can be calculated by adding to the safety stock that has been calculated previously.
B = + SS = 5,909.32 kg + 4,527.98 kg = 10,437.3 kg
Thus, reorder point will be done when inventory in the warehouse reaches 10,437.3 kg. The company uses the same supplier in the proposed method, so there is no change in the purchase price of raw materials even though there is a change in the number of purchases. After knowing and analysing the proposed inventory from January to June 2018, the calculation of the total cost can be done in the following way.
Total cost = purchase cost + inventory cost + safety stock cost + stockout cost
= Rp 577,500,000 + Rp 27,720 + Rp 4,430,074 + Rp 1,997,768 = Rp 583,955,562/6 months
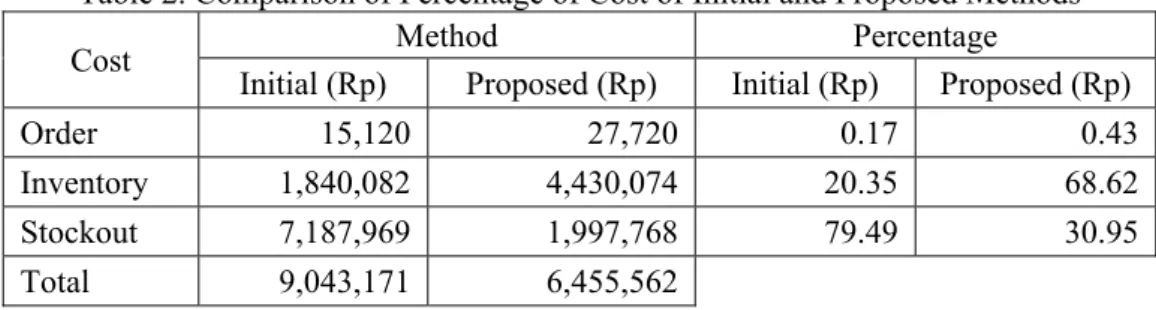
Once calculated, the total cost from January to June 2018 for the proposed method is Rp 583,955,562. Whereas the total cost in the initial method is Rp 534,043,171. Results that differ between the initial method and the proposed are due to different purchase quantities as in Table 2, can be compared based on the order costs, inventory cost and stockout cost.
Table 2. Comparison of Percentage of Cost of Initial and Proposed Methods
Cost Method Percentage
Initial (Rp) Proposed (Rp) Initial (Rp) Proposed (Rp)
Order 15,120 27,720 0.17 0.43
Inventory 1,840,082 4,430,074 20.35 68.62
Stockout 7,187,969 1,997,768 79.49 30.95
Total 9,043,171 6,455,562
5. Conclusions and Recommendations
The method used to forecast demand from January to June of 2018 is the Moving Average with length 5, because it has the smallest MSE value. Based on forecasting result, the need for production raw materials every month is 25,325.65 kg, so that the total requirement for one period or six months is 151,954 kg.
Based on the value of the TPV, the order of importance of the criteria is price, quality, delivery, and service. During January to June 2018 the company ordered raw materials at supplier A. Inventory cost efficiency of each method is seen from its percentage to total cost (without purchase costs, because it is a fixed cost and the result depends on the amount of raw material purchases), and the result of the proposed method stockout cost percentage decreases from 79.49% to 30.95% but the percentage of savings costs increases from 20.35% to 68.62% because the proposed method has safety inventory to anticipate demand. The difference becomes benefit for the company because the reduction in stockout costs is greater than the addition of the cost of savings, the saving is Rp2,587,609 during January to June 2018 or 28.61% of the initial method total cost.
The contribution of this paper is a procedure to integrate among finish product forecasting, raw material ordering, and choosing the best supplier. All steps will guarantee an efficient total cost that it is developed by inventory, order, stock out and safety stock cost. In addition, companies must begin to pay attention and improve procurement planning and production of raw materials. Improvements can be initiated by predicting consumer demand to determine the time and quantity of ordering of raw materials. Another step that can be applied is to determine and provide safety stocks to anticipate consumer demand. For further research, the scope can be expanded to all types of products. In addition, sales data used as a reference for forecasting demand is real data and should be longer in duration (more than or equal to two years) to minimize errors in forecasting.
6. References
[1] Davis, Robert A., 2013. Demand-Driven Inventory Optimization and Replenishment: Creating a
More Efficient Supply Chain, Wiley.
[2] Feigin, G., 2011. Supply Chain Planning and Analytics: The Right Product in the Right Place at
the Right Time the Right Product in the Right Place at the Right Time, Business Expert Press.
[3] Viale, J. D., 1996. Basics of Inventory Management: From Warehouse to Distribution Center,
edited by Christopher Carrigan, Course Technology Crisp.
[4] Muller, M., 2011. Essentials of Inventory Management, AMACOM.
[5] Saaty, T. L., & Vargas, L. G., 2012. Models, Methods, Concepts and Applications of the Analytic