Worcester Polytechnic Institute
Digital WPI
Interactive Qualifying Projects (All Years) Interactive Qualifying Projects
May 2017
Inquiry in Developing Trading Systems for FOREX
and Equities Trading
Dereck Arthur Pacheco Worcester Polytechnic Institute Michael Bahnan
Worcester Polytechnic Institute Sanjay Batchu
Worcester Polytechnic Institute
Follow this and additional works at:https://digitalcommons.wpi.edu/iqp-all
This Unrestricted is brought to you for free and open access by the Interactive Qualifying Projects at Digital WPI. It has been accepted for inclusion in Interactive Qualifying Projects (All Years) by an authorized administrator of Digital WPI. For more information, please [email protected].
Repository Citation
Pacheco, D. A., Bahnan, M., & Batchu, S. (2017).Inquiry in Developing Trading Systems for FOREX and Equities Trading. Retrieved from
Inquiry in Developing Trading Systems for FOREX and Equities Trading An Interactive Qualifying Project
Submitted to the Faculty of Worcester Polytechnic Institute
In partial fulfillment of the requirements for the Degree of Bachelor Science
Report prepared by: Michael Bahnan
Sanjay Batchu Dereck Pacheco Conducted from
October 25, 2016 to May 2, 2017
Professor Hossein Hakim and Michael Radzicki of Worcester Polytechnic Institute
1: Acknowledgments
On behalf of Sanjay Batchu, Michael Bahnan, and Dereck Pacheco, the IQP team would like to acknowledge the time and effort spent by Professor Radzicki and Hakim to create and organize this IQP. In addition, we would like to recognize the assistance they provided in teaching the team the fundamentals of economics, and trading. We also greatly appreciate the support and guidance they gave us during the duration of this IQP, which has enabled us to complete this project with the highest standards of excellence. The team would also like to recognize Worcester Polytechnic Institute due to their continuing support of the IQP project, thus enabling the team to broaden their horizons and gain knowledge of the financial industry. Finally, we would like to recognize TradeStation Inc. for allowing us to develop our system using their platform and further educating us on the financial industry.
2: Abstract
The purpose of this Interactive Qualifying Project is to scientifically develop a trading system that increases profitability and maximizes return on equity when compared to passive investing methods such as index funds. The goal of any trading system is to decide when to enter and exit trades based on fundamental or technical analysis of the underlying asset being traded. This project used three different trading systems that focused on trading foreign currencies as well as equities. The first strategy is based on value investing and focuses on equities where the “true value” of a stock is found by using fundamental analysis. The next system used is based on the CANSLIM method of stock screening that uses specific parameters to find stocks that have potential for high growth. The third system focused on currencies and used technical analysis as a basis for creating entry and exit conditions.
3: Table of Contents
1 Acknowledgements 2
2 Abstract 3
4 Introduction & Research Overview 7
4.1 Problem Statement 7
4.2 Statement of Problem Importance 7
4.3 Brief Summary of Literature 9
4.4 Conclusions 11
5 Trading & Investing 12
5.1 Trading Vs. Investing 12
5.2 Financial Market Theory 13
5.3 The Four Main Asset Classes 13
5.3.1 Equities 13 5.3.2 Bonds 15 5.3.3 Currencies 17 5.3.4 Commodities 19 5.4 Stock Exchanges 20 5.5 Derivatives 22 6 Trading Systems 23
6.1 What is a Trading System? 23
6.2 Trading Platforms & Brokerage Accounts 23
6.2.1 Trading Platform Basic Idea 23
6.2.2 Types of Trading Platforms 24
6.2.3 Brokerage Account Basic Idea 24
6.2.4 Types of Brokerage Accounts 25
6.3 Data Sources 27
6.3.1 Where Assets Are Traded 27
6.3.2 Specialists & Market Makers 27
6.3.3 How Assets Are Traded 28
6.4 Stock Investing Styles 29
6.4.1 Value Investing 29
6.4.2 Growth Investing 31
6.4.3 Hybrid Systems 32
6.5 Trading Styles & Strategies 33
6.5.1 10 O’Clock Bulls 34
6.5.2 Moving Average Strategies 34
6.5.3 MACD Strategy 35
6.5.5 Ichimoku Kinko Hyo Strategy 36
6.6 Difference Within Trading Styles 38
6.7 Time Frames 38
6.7.1 Scalp Trading 39
6.7.2 Day Trading 40
6.7.3 Swing Trading 40
6.7.4 Intermediate and Long Term Position Trading 41
6.7.5 Active Investing 42
6.8 Manual Trading Vs. Automated Trading 43
6.9 Fundamental Trading Vs. Technical Trading 44
6.10 Personal Objectives of Trading Systems 45
6.11 Fundamental Law of Trading Systems 46
6.12 Trading System Rules 47
6.12.1 Entry Rules 47
6.12.2 Exit Rules 48
6.12.3 Position Sizing Rules 50
6.12.4 Types of Orders 51
7 Optimizing and Analyzing Systems 52
7.1 Optimization 52
7.2 Expectancy, Expectunity, System Quality 54
7.2.1 Expectancy 54
7.2.2 Expectunity 55
7.2.3 System Quality 55
7.3 Modern Portfolio Theory 56
7.3.1 Alpha 57
7.3.2 Beta 58
7.3.3 Standard Deviation 59
7.3.3 Sharpe Ratio 59
8 Dereck Pacheco’s System 62
8.1 Overview 62 8.2 Literature Review 64 8.3 Methodology 65 8.4 Entry Rules 67 8.5 Exit Rules 68 8.6 Results 69 8.7 Conclusion 71
9 Sanjay Batchu’s System 72
9.1 Overview 72
9.1.1 Problem Statement 72
9.2 Literature Review 73
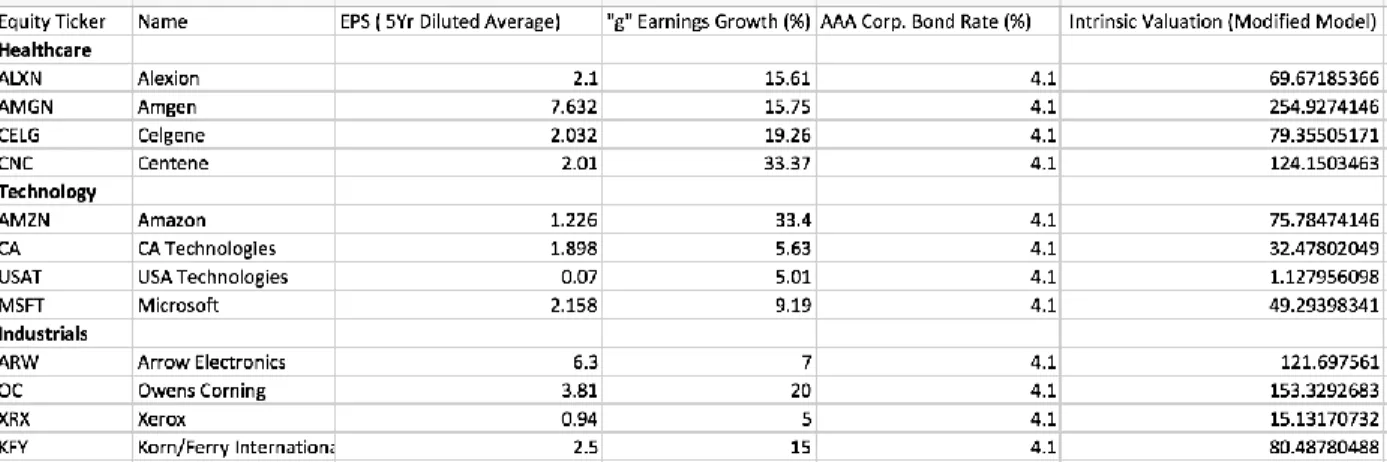
9.3 Equities Selection Methodology 76
9.4 Calculating Intrinsic Value 80
9.5 Exit Rules 86
9.6 Overall of Results 87
9.7 Evaluating System Performance 91
10 Michael Bahnan’s System 95
10.1 Overview & Literature Review 95
10.2 Methodology 98 10.3 Entry Rules 99 10.4 Exit Rules 101 10.5 Overview of Results 101 10.6 Conclusion 106 11 Compilation of Systems 107 12 Works Cited 109
13 Appendix A Tables & Figures 114
14 Appendix B Trades & Codes 120
14.1 Dereck’s Data 120
14.2 Sanjay’s Data 139
4: Introduction & Research
Overview
4.1 Problem Statement
Trading and investing have become increasingly important to common Americans with the end of pension plans and the integration of the 401k into the American way of life. Besides retirement, people trade and invest for other reasons such as extra income or as a profession. With the creation of computer technology in the financial services
industry, trade systems and strategies are increasingly becoming the key to increasing the return on capital. There are two main problems this project aims to solve. The first major problem is most people are passive investors who mainly invest passively and do not actively manage their investments. Another problem is that most strategies are not based on science or economics, thus cannot be analyzed in a scientific manner. These two problems lead to loss in potential return on capital and leave most investors in a weakened position compared to other investors in the market.
4.2 Statement of Problem Importance
“It’s so easy, even a baby can do it” (E-Trade, 2008). One might recognize this slogan from the baby commercial first broadcasted during Super Bowl XLII.
easy and rewarding. Sadly, such notion is not the case. Due to false advertising like this, individuals become blind and fail to comprehend the correct way of trading. In order for someone to be successful in this profession, they must begin with an open mind. Also, they must prevent themselves from being easily swayed by publicity, and the conceptions brought forth by others. From above, we’ve distinguished between the two kinds of traders, passive and active. A passive trader is one who invests in indexes or exchange-traded funds without managing them. In contrast, active traders manage their own ship. They are committed to beating the market by implementing methods and techniques collected from past experiences. Here are some important aspects to think about for beginning traders.
“There's no point in trying to beat the market through active investing” (Kahler, 2016). The previous citation serves as propaganda for men and women who wish to spend their hard earned money investing passively. What they don’t understand, however, are the wide varieties of issues that come with passively trading. These issues are of the utmost importance and one should know them before entering the world of trading for the first time. First of all, since investing passively requires the holder to invest without anticipating performance, they are relying heavily on the market. For example, when one chooses to invest passively in The Dow Jones Industrial Average (DJIA) index, they are buying as many funds as they can to replicate that index. Heavy reliance on the market is required because brokers aren’t managing these accounts. Hence, if the stock market average is down, the passive trader will have to ride it out hoping that it won’t continue to drop. Active traders do not have this problem. Unlike a passive trader, an active trader will manage their own funds by putting thought and attention into performance. Meaning that
they will watch for news updates, research companies, and/or implement testing strategies for investing. These tactics advocate for buying stocks when it’s low, and selling when it’s high. In the end, experienced active traders will produce higher returns and have more knowledge about the economy. This introduces the importance of our next problem, illogical trading. Just because active traders are labeled as the smarter bunch, doesn’t necessarily mean they are. Most active traders will run strategies that consider zero economic or scientific factors, which makes analyzation very difficult. The active trader alone acquires high risk just from managing his or her own accounts. However, using a strategy that one cannot analyze creates an even higher risk. This is because it makes it difficult to learn from system mistakes. When one keeps making the same mistakes, it creates a margin of error that could’ve been profitable. All in all, it is important for active traders to run analyzable strategies to achieve higher returns, so that one could be just steps closer to beating the market.
4.3 Brief Summary of Literature
Since the very first day the stock market was introduced to the world, scientists and mathematicians have devised systems and algorithms that they believe will captivate the world and elevate their profits to new heights. As of recent, an increasing number of individuals have taken these older systems and modified them to find a possible parameter or two that might make the system more efficient and therefore lead to larger profits. The team has decided to use different systems for their stocks in order to get more diversity and examine efficient of profits across different systems.
In the case of Sanjay, he used a modified version of value investing derived from Ben Graham (Scott, AAII). This made changes such as including sector leaders and employing sector rotation to increase portfolio diversity. In addition to using the Graham method of finding intrinsic value, Morningstar analyst reports were used to decide on entrance and exit strategies.
On the other hand, Michael used a system that modifies the CAN SLIM method developed by William O’Neil (O'Neil, William J. How to make money in stocks: a winning system in good times or bad). His methodology includes different parameters for enter and exit methods as well as criteria to invest into a stock. He used a stock scanner to enter in the CAN SLIM parameters that William O’Neil deemed in his theory, but
modified it by leaving a few out as well as adding other criteria that he believed would lead to greater profit. implemented two different approaches to trading. They were automated and manual. Each approachutilized the philosophy of Charlie Wright in his book Trading as a Business. Wright believed that successful trading systems result from well-structured strategies including entry and exit rules, as well as money management principles. Indicators such as simple were researched for these approachesStatisticians have used the SMA indicator since 1901 (McClellan, 2010), which set the foundation for future indicators. The RSI indicator was developed by J. Welles Wilder and was further explained in his book New Concepts in Technical Trading Systems. Finally, Gerald Appel and his discovery of the MACD, was publicized in his book The Moving Average
Convergence Divergence Trading Method. Through Charlie Wright’s philosophy these indicators were assorted in each approach in search for profitable results.
4.4 Conclusions
It is clear that investing is accessible to more people than ever and the number of investors continues to grow at a rapid rate every year. Most investors who invest on a casual basis are passive investors who do not monitor their investments on a regular basis. In order to combat this problem, trading systems based on scientific data need to be developed in order to increase return on equity and improve investor’s mindset. Through the use of these ideas, our team was able to observe that when these systems utilized properly they can generate returns that exceed the market.
5: Trading & Investing
5.1 Trading Vs. Investing
Most people believe that trading and investing are similar and many get confused on the definition between trading and investing. Investors and traders both use the financial markets to gain wealth but do so using different methods. Investors use the market to gain wealth gradually by compounding assets and returns over time. Investors also believe that prices of their assets will rebound during downturns and thus hold their assets for long periods of time. Most investors also focus more on fundamental analysis and management data rather than specific price movements and technical chart analysis. In contrast, traders use the financial markets on a short term basis and frequently buy and sell their assets in order to outperform the market. Investors usually settle for small returns based on market movements but traders believe that by following the mantra of “buy low sell high” they can beat the returns provided by the market. Traders use mostly technical analysis to track asset prices to determine when to buy and sell assets.
In essence traders and investors both use the financial markets to further their financial goals. Investing carries less risk than trading but leads to lower returns over time as there are periods of time the price of assets changes over time. Traders buy and sell assets to avoid these price changes and maximize returns as much as possible.
5.2 Financial Market Theory
The difference between trading and investing is a well-studied concept in finance and is based on two theories founded by Nobel Prize economists Robert Shiller and Eugene Fama. Robert Shiller is the creator of Behavioral finance theory, which believes that the market contains inefficiencies that can be exploited by those with enough knowledge of the market in order to increase potential returns. In contrast Eugene Fama believes that markets are efficiently priced and that there are no inefficiencies that can be exploited for increased returns. This theory believes that the best way to obtain returns from the market are to simply invest in index funds that track market prices and simply allow the returns to compound over time.
5.3 The Four Main Asset Classes
Whether one classifies themselves as an investor or a trader, they will most likely be trading four main classes of financial assets. The four main asset classes include, Equities, Bonds, Currencies, and Commodities. In this section each asset is analyzed for its benefits and drawbacks as well as the time period in the business cycle in which the asset as the highest volume.
5.3.1 Equities
The equity market is usually the one that most investors and traders are most common with and includes most of the companies that people know about such as Apple, Google, Amazon, and Tesla. Companies enter the equity markets by offering the public
stock in themselves via an IPO or an Initial Public Offering which begins the process of being sold on one of the two large exchanges in the United States the NASDAQ or NYSE (New York Stock Exchange). Usually equities are bought by major financial institutions when the economy is in a bullish cycle as equities carry a relatively higher risk than some other classes of assets.
When trading equities, it is very important to understand the difference between an investor and a trader. As equities are extremely regulated, there are many tax regulations regarding the buying and selling of equities. If one is simply classified as an investor, they have to catalog each individual trade as well as pay long term capital gains tax on any gains made from their investments. With regards to liquidity of the market, the stock market is extremely liquid and transactions of most stocks are completed within microseconds.
Unlike other assets, due to the volatile nature of equities within the business cycle margin requirements are extremely high when compared to other assets such as currencies. This due to the fact that there needs to be a level of trust between the broker and client when borrowing cash on margin to purchase stocks. In addition, if the market has sudden dips, the client can lose an interminable amount of money and may not be able to pay off the margin when necessary.
The actual process of creating a brokerage account to trade equities is extremely dependent on whether one is classified as an investor or trader. If a person is classified as an investor they usually pay a commission to a brokerage firm and must pay a fee for each trade made. The entry requirements for investors are very little, as equities are the most notorious class of financial assets and thus are heavily advertised by most brokerage firms.
In contrast, since traders have high amounts of capital to trade with most brokerage firms will offer traders low commission amounts for each trade and make their money from volume. If one is a trader for a large firm which has a seat on each of the exchanges, then there is no broker is involved and one can trade directly on that exchange.
There are many factors that need to be considered before investing or trading including margin, liquidity, commissions, taxes and etc. These requirements make equities
complicated to trade on a regular basis as a trader thus opening the window for traders to specialize in other assets such as currencies, futures, bonds or commodities.
5.3.2 Bonds
Bonds can be considered the opposite of stocks as they represent debt repayment while stock shares are essentially claims on the company’s profits and also allow for voting rights on major decisions. Stocks are priced based on the company’s potential for increased profits in the future while bonds are priced based on the company’s ability to repay its debts. A portfolio using traditional methods of investing consists of a mix of bonds and stocks in order to diversify risk, as bonds are usually more conservative than stocks. Thus, most bonds are issued by governments and corporations in order to borrow money in order to fund expansions or perform capital investments. They play a large role as an alternative to banks as they decentralize the lending process and allow for large amounts of people to become lenders.
There are four main types of bonds present on the bond market and are bought and sold by investors and traders. One of the safest types of bonds are government bonds and they are classified as sovereign which means that these bonds obtain value by that nation’s
ability to raise taxes and print notes of currency. Debt offered by developed nations such as those in Western Europe or the United States are considered essentially risk free because they have strong credit histories and are stable nations. On the other hand, some developing nations have considerably increased chances of risk due to decreased stability and an increased chance of not repaying the debt. Government bonds are usually rated by the three main rating agencies that also rate corporate bonds.
Besides sovereign bonds of nation-states, local municipalities also sell bonds called “muni bonds” that are used to fund infrastructure projects and other capital intensive projects such as new schools or libraries. These bonds are riskier than sovereign bonds since municipalities cannot print their own currencies and thus have the potential to go
bankrupt. However, the interest paid on these bonds to investors is usually tax-exempt at the federal, state, and local levels. Thus investors who want to make returns that are better than simply holding cash without increasing their tax burden may use municipal bonds.
Besides government, corporations are the other main issuer of bonds in the market and are preferred by investors who want to obtain higher yields. Corporate bonds have higher yields due to the fact that a corporation simply has a higher chance of default than a governmental entity and this is directly reflected in the yield offered. Corporate bonds are divided by length into different categories just as those issued by the government. Short term bonds usually have a maturity rate of less than 5 years, intermediate bonds mature between five to twelve years and long term bonds mature after twelve years. Corporate bonds are also rated by the three agencies in a similar manner to that of government bonds and are done by the same companies: Moody’s, Fitch, and Standard and Poor’s.
Corporations can offer normal bonds with a variety of interest rates and maturity dates, but they can also issue special bonds called convertible bonds. Convertible bonds are unique in that investors or traders can convert these bonds into stock at a certain date in the future based on a pre-determined conversion rate.
Regarding taxation, there are some basic rules regarding tax regulations on income from bonds. The fixed income gained from the quarterly interest payments are considered normal income and are taxed based on the numerous income brackets. However, if the bond appreciates in price and is sold, then the income gained from that transaction can be considered capital gains. This is an important factor due to the fact that tax laws play a large role in determining asset allocation for investors and traders.
Bonds and equities can be considered two sides of the same coin in the sense that bonds represent an entity’s ability to pay its debts and equities represent an entity’s ability to obtain profit in the future. Both of these assets play similar roles during trading or investing as they have similar brokerage requirements. One issue with both of these classes of assets is the fact they are tradable only on exchanges, which have defined sessions and cannot be traded at night or on weekends. Thus investors and traders may also choose other assets in order to mitigate tax liability or reduce losses via commissions. (Investopedia, Staff)
5.3.3 Currencies
Trading currencies is also considered FOREX trading due to the fact that trading or investing currencies is simply buying money in different countries. FOREX trading is sometimes seen as being too complicated or hard to enter, but it is actually extremely
simple due to the fact there are minimal regulations as well as the fact that the market is extremely liquid. The New York Stock Exchange is one of the biggest exchanges in the United States where equities are sold and it pales in comparison to the FOREX spot market that has a liquidity value of 1.5 trillion USD. A fundamental notion of FOREX trading is that the price of a country’s currency is related to the condition of its economy relative to other countries.
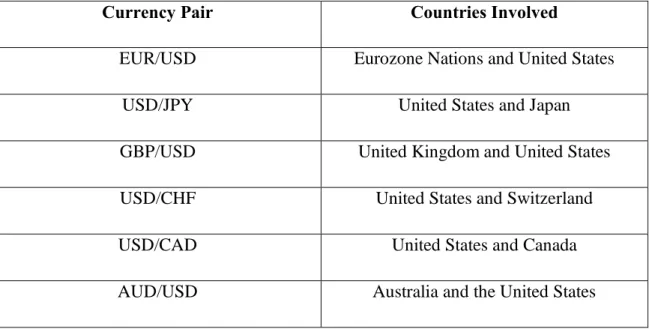
Most traders and investors choose to trade six main currencies as these nations have the most liquid currencies on the spot market. They are the USD (US Dollar), EUR (Euro), JPY (Japanese Yen), GBP (Great British Pound), CHF (Swiss Franc), CAD (Canadian Dollar), and AUD (Australian Dollar). When purchasing currency, one is actually buying one currency and selling another, which creates the basis for a currency pair. Most investors and traders use only the major currency pairs, which are shown in the table below.
Table 5.3.3A: Major Currency Pairs
Currency Pair Countries Involved
EUR/USD Eurozone Nations and United States
USD/JPY United States and Japan
GBP/USD United Kingdom and United States
USD/CHF United States and Switzerland
USD/CAD United States and Canada
When compared to other asset classes such as stocks or bonds, there are few margin requirements when trading on the currency markets. In addition, the spot market has tremendous amounts of liquidity with regards to the major currency pairs in the table above. The limited margin requirement is due to limited regulations of the FOREX market as well as the fact that FOREX trading is extremely decentralized. Many traders and investors in the currency market trade at margins such as 50-1, which means that they can trade fifty dollars worth of currency for every single dollar they spend. Thus, one only needs to use two thousand dollars in order to purchase one hundred thousand dollars’ worth of another foreign currency.
Like bonds currencies are traded on the OTC (Over the Counter) market that means that independent buyers and sellers make transactions based on market information. This means that there are limited commission costs as there is no need to fund large
exchanges or expensive brokerages, which enables a large amount of traders and investors to join the market.
5.3.4 Commodities
Most financial instruments are electronic in nature and represent monetary value yet they do not usually have any connection to tangible assets. However, the commodities market is an amalgamation of four main sectors of physical goods that can be traded in a market environment. The four main categories or sectors of commodities are the energy sector, metal sector, livestock sector, and the agricultural sector. The commodities market relies on rigid standards to ensure global transactions and ensure trust in the system. In
addition, trading commodities is one of the purest forms of economics possible today as pricing is based largely on supply and demand.
In the United States, there are numerous exchanges participating in the transaction of commodities and usually each exchange specializes in certain commodities, which simplifies transactions. The largest exchanges in the United States are listed below: · The CME Group
· Intercontinental Exchange · Kansas City Board of Trade · The London Metal Exchange
The CME Group operates the Chicago Mercantile Exchange that trades mainly agricultural products as well as wood pulp and timber products as well. The ICE or Intercontinental Exchange is another exchange based in the United States and trades futures and options on commodities such as Agriculture, Crude Oil, Crude Oil products, Electricity, and Natural Gas. Investors and traders can also purchase contracts on metals such as Aluminum, Steel, and Nickel through the London Metal Exchange.
(Investopedia, Staff)
5.4 Stock Exchanges
A stock exchange is a market where stock buyers and sellers trade stock in various companies across one or more of the several exchanges throughout the United States. The exchange allows individuals to liquidate their stocks, while allowing others to trade for these stocks and vise versa. Often individuals wonder when to enter/exit the market or
how to gage how well the market is doing. And to answer simply, it truly depends on the company or industry that an individual is looking to invest in. Each sector and company peaks at different points and profits can be made at different times for different
companies. A company could have an upward trend, where each one of its stocks gains more value at the specific time, while another company could downward trending at the exact same time and that is the nature of the market. In another instances, a stockholder could experience what is known as trading sideways, which means that the current stocks for this specific company is experiencing neither an upward nor downward trend and rather an oscillating trend between the two.
Now although there is no simple to track the entire market as a whole, there are certain ways to gage the performance of the top companies for each sector and the top companies in general. Simply put, indexes are these collections of stocks that measure a portion of the entire stock market. Of course the largest and most known index is the Dow Jones Industrial Average (DJIA), which accounts for 30 of the largest and most dependent companies in the US. Another well-known index is the Standard and Poor’s 500 (S&P 500), which covers 500 companies that are compiled together based on its market size, liquidity and industrial sector. The S&P 500 is neck and neck with the Dow Jones for the best overall indicators of the position of the market and with both of these indexes in place, it is the job of a mutual fund manager to beat it! (Staff, Investopedia. “Index Investing: The Standard & Poor’s 500 Index)
When the stock exchange goes live each morning, a battle begins between the bulls and bears of the market with each side trying to pull the market in their direction while making the other side go in the opposite direction. Often, stockholders must view charting
volume, new high/lows and advance/decline indicators in order to see which direction the prices of the market will travel. Without these necessary indicators, traders would be lost in the market and unable to know whether stocks are on the upward trend and reaching new highs or selling stocks and reaching a new low.
5.5 Derivatives
Another dimension of the stock exchange are these legal agreements called contracts. Now there are different kinds of contracts but the main two are futures and options. A future’s contract, first off, is an agreement to buy or sell a chosen commodity at a set time and price in the future. An individual can buy these contracts in everything from metals to oils and usually the contract is sold before the product is set for delivery. On the other hand, an options contract is an agreement between the buyer and seller that clearly states that when the shares or commodities reach a preset price then the option seller will fulfill their portion of the trade if the buyer wants to perform a call option and buy the shares or a put option to sell them.
6: Trading Systems
6.1 What is a Trading System?
After one gathers an overall view of the ideas underlying trading and investing, they should begin the process of determining how to implement them within the market. In general, the most common approach the average investor idolizes is the use of trading systems. “A trading system is simply a group of specific rules, or parameters, that determine entry and exit points for a given equity” (Kuepper, 2004). Developing a
successful system could be time consuming depending on your expertise in the market. In some cases, one must acquire years and years of data to establish accurate readings, while others use modern technology to back test their methods, strategies, etc. just by looking at day-to-day trends. These systems could either be monitored manually for the hands on approach, or automatically for traders willing to conform their rules into the language of code. All in all, coming up with a working trading system is in no way, shape, or form a simple undertaking.
6.2 Trading Platforms & Brokerage Accounts
6.2.1 Trading Platform Basic Idea
Preceding the events of creating any system of trades, one must be conscious of the trading platform being used. “A trading platform is a software through which investors and traders can open, close and manage market positions” (Investopedia, 2010). Basically,
it’s a software provided by different trading companies, also known as brokerage firms, that allow investors to implement their systems, make trades, and manage their accounts.
6.2.2 Types of Trading Platforms
There are many different kinds trading platforms in our world today. Most of them offer unique format and easy accessibility functions, such as mobile apps to trade on the go, tools and alerts to advocate trading analysis, and even customization features to fit the organizational needs of each client. Some platforms specifically cover one asset, while others have the ability to trade multiple asset classes. For example, OANDA Fx is a trading platform strictly used for currency trading. Other platforms like TradeStation, Ameritrade, and Scottrade all offer different trading capabilities for assets like options, equities, stocks etc. Even though this falls to be true, each trading company has been categorized overtime as to what asset their platform best fits. Traders come to this conclusion by looking at every factor a platform has to offer, such as responsiveness, reliability, data security, trade commission, account minimums ($$), automated trading, and even promotional events. Other differences between trading platforms lie within their structures. Meaning each platform comes with their own friendly-user interface, as well as guidelines that will hopefully help their client’s trading to be fluid and simple. In the end, no matter what trading platforms have to offer they all perform the same job.
6.2.3 Brokerage Account Basic Idea
As previously noted, trading platforms are offered by trading companies call brokerage firms. A brokerage firm is a financial institution, similar to a bank, which
facilitates both buying and selling of financial assets for each of their clients. So whenever one trades on an online system, they are an account holder of a brokerage firm. “A
brokerage account is an arrangement between an investor and a licensed brokerage firm that allows the investor to deposit funds with the firm and place investment orders through the brokerage” (Investopedia, 2017). In other words, when one decides to invest in a brokerage account they are entrusting a broker relay their investment orders within a timely manner.
6.2.4 Types of Brokerage Accounts
When opening this account, the first question to be asked is the type of account to utilize. There two different types of brokerage accounts to choose from, cash or margin.
Advantages/Disadvantages of a Cash Account
According to Investor.gov, “A cash account is a type of brokerage account in which the investor must pay the full amount for securities purchased”, meaning a broker cannot lend you money to pay your account expenses, such as commission on
transactions. This could serve as a disadvantage because traders with little income, who can’t increase position size, will struggle to gain a higher profit. Advantages of
implementing a cash account include not having to take as many risks. There is less risk because you are avoiding the chances to be indebted with the brokerage firm. If a trader has substantial debt within a margin account, they face the risk of the account being frozen. While the margin account is frozen, a cash account could still be trading while taking full advantage of new market positions.
Advantages/Disadvantages of a Margin Account
On the other hand, “A margin account is a type of brokerage account in which your brokerage firm can lend you money to buy securities, with the securities in your portfolio serving as collateral for the loan” (Investor.gov, 2017). Just like any other loan, interest costs will be encountered, especially when you buy securities on margin. Other costs that are factored in consist of the fees/commissions. Also known as a brokerage fee, these commissions are charged by the company to conduct transactions between buyers and sellers. These fees are either built into the trades, or charged separately. Whatever the case may be, fees could be a flat rate, a percentage of the transactions, or even a
combination of both. In addition, there are many pros and cons with using a brokerage account. First of all, most of the pros and cons formulate from using margin accounts. The best advantage that meets the eye is having the ability to increase your purchasing power. For example, if one has very little money invested in the market but can predict outcomes, that person could increase their quantities leading to higher returns. However, for the average person who isn’t too familiar with the process, this approach could serve as a disadvantage. “Alexandra Lebenthal, president and CEO of Lebenthal & Company, says she wouldn't recommend that the average investor buy stocks on margin, noting that there is already a risk built into investing because you don't know for sure if the company is going to do well or even stick around” (Fox Business, 2012). Basically, Alexandra is saying that if stock prices were to drop, then greater losses would succumb to those who traded marginally due to interest payments and commission. In addition, not only could a broker freeze an indebted trader’s account, they could even shut it down and sell the open items to cover the shortfall.
6.3 Data Sources
6.3.1 Where Assets Are Traded?
The 4 Asset Classes Common Exchanges to Use
Equities *New York Stock Exchange (NYSE)
*National Association of Securities Dealers Automated Quotation System (NASDAQ)
Bonds *Citigroup BIG
*Barclays Capital Aggregate Bond Index *Merrill Lynch Domestic Master
Commodities *New York Mercantile Exchg. (NYMEX)
*New York Board of Trade (NYBOT) *Chicago Board of Trade (CBOT) *Chicago Mercantile Exchg. (CME)
Currencies *Oanda Fx
*Thinkorswim (TD Ameritrade) *Forex.com
*MB Trading (MetaTrader) Table 6.3.1
6.3.2 Specialists & Market Makers
First of all, whenever someone trades, they are moving their money through market makers. What are market makers? Exactly what you think; they essentially make the market. According to Investopedia, “A market maker is a broker-dealer firm that assumes the risk of holding a certain number of shares of a particular security [asset] in order to facilitate the trading of that security”. Within market makers lie the members who make them up. For example, in a stock exchange the acting market maker is known as a specialist. Specialists’ work together to ensure the market stays liquid by holding stock inventory, posting bid/ask prices, and managing trades. Without market makers and their players, there would essentially be no means to trade because no one is there to facilitate the people trying to invest as well as stepping in when the times get tough. In other words, if large movements occur in the market, then it is up to the acting market maker to sell off
their own inventory until the gap between supply and demand narrow. This is just one example of how members like specialists thrive to keep the market liquid. Since a lot of people are involved in the market, all market makers must be labeled as large institutions. The most common market makers in our world today are brokerage firms. As previously noted, brokerage firms provide sale and purchase solutions in order to keep the markets running smoothly. One can now begin to see how all these aspects tie into each other.
6.3.3 How Assets Are Traded
Secondly, it is also important for newly found traders to understand how different assets can be traded. One could be “in the pits” of a trading floor hollering out bids and offers, while some could be in the comfort of their own home trading electronically. Back when the market first began, trading in the pits was generally the only method of trade. Due to the technical advances of modern society, the approach has slowly digressed and been replaced by electronic trading. However, it’s always nice to know about the
foundation that changed the way people invest. Open Outcry Pits
This fading method is formally known as the “Open Outcry” technique. When the outcries take action, one may not be able to think. The uproar of verbal bids and offers just take over the atmosphere. Hand signals are also seen as tool for brokers to deliver
important information from one another. In order for one to understand the process of how trades are made from the pits, they can refer to the following citation. “A contract is made when one trader cries out that they want to sell at a certain price and another trader
complicated ordeal for traders who are not used to such environment, which is why the popularity of electric trading has begun to grow within firms.
Electronic Trading
Essentially, it increases the rate of making trades, while providing cheaper means of business. Savings are a result from the exclusion of human error. According to
Yieldbroker, “Automation of pre-trade and post-trade data processing reduces the risk of re-keying error and streamlines settlement procedures – reducing costs”. Another reason for the sudden gross in popularity is because of its convenience. Most people never had the time to pick up a phone to order trades, but now anyone has the option to turn to any mobile device and trade on the go. In addition to the technological side, it eases the ability to check for news updates on the fly. This advocates for smarter trade decisions, as well as higher returns if executed correctly.
6.4 Stock Investing Styles
When the topic of conversation is how to properly invest in stock mutual funds, all investing styles are funneled into the styles of value investing, growth investing or a hybrid system of the two, in order to create a portfolio. Individuals will argue which of these methods is the “correct” way to invest in stocks, but each of these approaches have seen their fair share of success.
6.4.1 Value Investing
Value investing, a style of investing in stocks that trade for less than their intrinsic value, attract investors who believe the market is undervalued and is overly hyped by the
news, both positively and negatively. What is an undervalued stock? Well for different investor it can be a wide range of factors and ratios, but the simplest way to describe it is
“Undervalued stocks come about through investor irrationality. Typically, value investors seek to profit off this irrationality by selecting stocks with lower-than-average price-to-book ratios, lower-than-average price-to-earnings ratios and/or higher dividend yields”(Buffet, Investopedia). The numbers are then cross-examined with the intrinsic value, which the investor uses to properly assess whether he/she wishes to enter the market depending on whether the investor estimates around present earnings or future growth. In addition, value investors also refer to the concept of “margin of safety,” which basically dumbs down to the principle that they must purchase the stocks at a low enough equity, in order to account for an error in the estimated value of the stock.
Warren Buffett, often referred to as the godfather of value investing, brought forth this idea of intrinsic value, which is an assessment of what are these stocks really worth based on their future earnings power. The intrinsic value of a company by Buffett’s assessment estimates their future owner’s earnings then reveres their discounts back to the current market. This process is referred to as “bond math” and is combined with a “moat,” which is a company with an overwhelming advantage over the competition in the market, in order to give Buffett, the necessary information to value all the stocks and eventually invest in them.
The advantage to using value investing, first off, is the potential for lucrative profits due to the face that these stocks are bought at such discounted prices, which makes the potential to make a great deal of money even higher. In addition, because the stocks are bought at such low rates, the risk to lose large sums of money is lower. The value
investor must also research stocks that are on the turnaround or stocks projected to climb in the near future, which steers them away from hype or hot tip stocks.
On the other hand, some of the disadvantages include “value trapping” which basically means running the risk that the stocks will do well and then have the unfortunate situation of not being able to sell those stocks and therefore tying up his/her capital. Another disadvantage is the fact that a value investor may run the risk of buying a stock that continues to decline in value instead of gain value. In addition, another disadvantage includes the rollercoaster ride the value investor would need to be on before they make profits. Some of these stocks may take years before they turn around and the investor makes a significant profit to sell.
6.4.2 Growth Investing
Growth investing is a style of investing based on the growth of the investor’s capital with a focus on investing in stocks that are estimated to have large earnings based on companies that are projected to be above average in their respected industry or the market as a whole. And that is also one of the biggest differences between these value and growth investing because growth investors buy stocks that are trading higher than their intrinsic value with the hopes that it will grow increasingly higher from its current value. When a growth investor runs through their criteria for a specific company they often measure it along the lines of “whether a company has strong historical earnings growth. Aside from this, they also look into a company's forward earnings growth,
and whether the asset has the potential to double in five years”(Staff, Investopedia. “Growth Investing.”).
A great example of growth investing is the CAN SLIM method created by William O’Neil, which is a system that selects stocks based on a seven-part criteria that states when a stock fulfills all of these criteria, it is poised for their biggest gains. Later in this document, one of the authors, Michael Bahnan, will discuss his use of the CAN SLIM method and elaborate on the method and how he modified it to see success through his own stocks.
The advantages of growth investing include its focus on attractive or hot companies with above average growth and earnings, its more rapid success in investing in these stocks than the overall market and investors are exposed to booming companies that continually evolve and grow within the market.
The disadvantages of growth investing include its high risk and volatility, lack of dividends due to most of these companies reinvesting their money earnings, and the fact that some of these values are much higher than the market because they are projects that may never come to be.
6.4.3 Hybrid Systems
Hybrid systems on the other hand are just as it sounds because it is a combination of both value and growth investing. A great example of a hybrid system includes a GARP strategy, which on Investopedia is defined as “the GARP strategy is a combination of both value and growth investing: it looks for companies that are somewhat undervalued and have solid sustainable growth potential. The criteria which GARPers look for in a
company fall right in between those sought by the value and growth investors.” The balance GARP traders look for in a stock versus what value and growth investors look at separately are shown in the diagram below.
Figure 6.4.3A
(Staff, Investopedia. “Stock-Picking Strategies: GARP Investing”)
6.5 Trading Styles & Strategies
If one is a novice in the trading industry, investing their hard earned money is quite intimidating. Most of the time, the problem lies within the puzzling strategies offered by trading platforms. These strategies make up the technical analyses that were briefly discussed earlier in the report, fundamental and technical. Analysis tactics such as trend following strategies, stop & reverse strategies, volatility expansion strategies, and specialized strategies all provide means of relief when hoping for higher returns. First of all, trend following strategies continue to thrive while being one of the best long term trading methods.
6.5.1 10 O’Clock Bulls
The 10 O’clock Bulls is also a fine strategy to undertake when in the market. The founder, Goeff Bysshe, created this system to predict daily support and resistance barriers. Bysshe experimented with the most volatile parts of the day, and concluded that the locations of these barriers are found during the first thirty minutes of each session. Specifically, the highest high and the lowest low are assigned to the trendlines of resistance and support respectively. “Breakouts” occur when the prices shoot over the resistance. Bysshe inquires that if these breakouts are highly volatile, then the trend will continue to grow. Software called “HotScans” by MarketGauge, is also a large contributor for making it easier to detect unusual volume patterns, which in turn points out the right stocks to trade.
6.5.2 Moving Average Strategies
Moving average strategies are quite popular for investors. From simple to
exponential moving averages, there are many different combinations a trader could use to predict market trends. For this project, our manual system implements simple moving averages for visual keys of trend shifting, while the automated system uses a double crossover simple moving average strategy. A simple moving average is displayed by taking each bar’s average price and creating a line connecting the prices. Traders believe that when the line begins to belly indicates a trend shift. A crossover strategy also
identifies market trends but is more concise by advocating a trader’s decision to either to enter, or exit the market. Figure 6.5.9A below displays an example of a double moving average crossover strategy. The idea behind it is that one of the lines shows long-term
market trends, while the other portrays short-term trends. When both are applied, the indication to buy an asset would be when the short average crosses the long average from below. In order to sell, a trader would watch for the opposite.
Figure 6.5.2(Source: Investopedia.com)
6.5.3 MACD Strategy
MACD is an acronym for Moving Average Convergence Divergence. It is a tool that also recognizes bullish or bearish by showing the differences between the closing price of the fast and slow exponential moving averages (EMAs). It’s similar to simple moving averages due to the fact that it's essentially the average of a price over a certain period of time. Fast EMAs are typically considered to be used on a 12-day time frame, whereas slow EMAs usually represent 26-day time frames. The answer from the difference of the two is then plotted over the “signal line”. A standard signal line is put into play so a trader can realize when to enter the market. The signal line is standard because it normally represents a nine-day period. Generally, when the MACD falls below
the signal line indicates a time to sell, whereas when the MACD rises above the signal line indicates a time to buy. This strategy was served as a foundation to the manual trading system that will soon be discussed.
6.5.4 RSI Strategy
The RSI is also an acronym, but is also known as the Relative Strength Index. It is a momentum indicator that compares total gains and losses over time. This measures speed and change of price movements of a security so that overbought and oversold
conditions can be identified. When an asset is overbought or oversold, a shift in the market is bound to happen. RSI values range from 0 to 100, with overbought assets typically being above 70 and oversold asset being under 30. The data for the up and down periods are computed over the course of 14 days (standard). Sudden price movements has the ability to display false signals so one should be careful and have other indicators to back it up. This strategy is also used in the manual trading system.
6.5.5 Ichimoku Kinko Hyo Strategy
The Ichimoku Kinko Hyo (IKH) strategy is known as the most profitable strategy in currency (babypips.com). It was discovered by a Japanese man named Goichi Hosoda and published in 1969. Not only predict an assets trend, but also their momentum and support and resistance points without the need of any other indicator. After creation, it was mainly used for JPY currency pairs but it still works well with others. This is a strategy many people overlook because of its complexity, but sure enough it has the ability to make one rich. The idea of having support and resistance levels, crossovers, oscillators,
and trend indicators all in one simply makes IKH the most efficient stand-alone strategy. According to babypips.com, experiments were conducted to compare the top strategies used in foreign exchange. As a result, the Ichimoku Kinko Hyo strategy had the best returns. After five years trading EUR/USD this strategy alone accumulated a total profit of $30,341, and had a 6% yearly profit (see figure 6.5.12 for results).
6.6 Difference Within the Trading Styles
Traders are always contemplating on what strategies that best suit their needs. Table 2 offers a few tips to that may help encourage the average investor trade with other styles.
Table 6.6A (Source: Wright, 2009)
6.7 Time Frames
A major consideration that needs to be taken into account when designing the correct trading system is the time frame that the system will trade on. The time frame of a trading system dictates how long the system will sustain open trades on the market. A
trading system can involve numerous amounts of time frames but some of the most common are listed below.
· Scalping · Day Trading · Swing Trading
· Intermediate Term Position · Long Term Position
· Active Investing
Each of the time frames listed above have their disadvantage and advantages and investors must choose a time frame that is best suited to accomplish their investment goals. In addition to matching goals, investors and traders must also choose a time frame that will allow them to reduce their costs as much as possible as this will optimize their return on investment.
6.7.1 Scalp Trading
Scalp trading is usually reserved for experienced traders with enough discipline to craft a strong and decisive exit strategy due to the fact that if a trade is mistimed then the trader can lose all the profits made during that session. The main method of generating profits while scalp trading is to use technical analysis to monitor small price changes and exit the trade when they are favorable. One of the biggest disadvantages of a scalp trading system is the extremely high commission costs unless one has access directly to an
6.7.2 Day Trading
The most common form of professional trading is day trading, which means that the trader or investor will always end the trading session in cash and close all open
positions. Day trading comes with many advantages and disadvantages that can affect both investors and traders.
One of the main benefits of closing positions at the end of the day is that one can simply relax after the trading session and there is no need to worry about losing money on an open position. Besides ease of mind after the trading session day trading can also allow one for increased profits because intra-day movements can be quite large which can provide large amounts of profits.
Although day trading has large benefits it also presents significant downsides for traders and less proficient investors. One of the main tenets of day trading is that one should have a “risk” portion of their liquid assets that they are willing to lose on any day without significant grief. Although day trading enables career freedom and mobility, it is an extremely unpredictable source of income and is also extremely stressful as markets can be extremely volatile.
6.7.3 Swing Trading
Swing trading is similar to day trading except that swing traders hold their
positions for longer periods of time in order to take advantage of price fluctuations within the market that are not possible to capture during intra-day trading. Swing trading involves both fundamental and technical analysis to find indicators that can detect an upcoming price swing.
When compared to day trading, swing trading requires a more conservative position sizing method due to the fact that holding positions overnight exposes the trader to increased risk. This is especially important when trading on margin as large losses can wreak havoc on a trader if there is a margin call.
In essence, swing trading can be beneficial due to the fact that it has a larger potential profit and can be done over long periods of time, which allows for traders to develop a more sophisticated trading strategy. However, it can also be risky due to the fact that it creates longer-term exposure to risk from the market as positions are held open for longer periods of time. In addition, swing trading places one at risk to lose more capital than initially thought due to the fact that price swings can be more volatile than those that occur during intra-day trading.
6.7.4 Intermediate and Long Term Position Trading
Intermediate Position Trading is a method used when the market displays long-term price signals rather than excessive fluctuations. The goal of position trading is to find the trend and hold positions in stocks that are following this trend and keep the position open until the trend subsides. The main advantages of position trading are limited commission costs as well as increased gains due to the larger price changes that occur during a trend period. Another advantage of position trading, is that there is no need to constantly monitor stocks as small fluctuations can be ignored as long as a general trend is still developing.
Some of the disadvantages of position trading include the reduction in liquid cash, and the need to perform fundamental analysis on specific stocks in order to find ones that match the targeted trend. When trading based on long or intermediate positions traders
also need to consider whether or not their capital can be tied up in open positions for long periods of time.
6.7.5
Active Investing
Active investing or active management is a portfolio management strategy that dictates that the investor used different strategies to choose unique stocks rather than simply choose an index fund that gives returns that match the market. One of the fundamental tenets of active investing is the belief that there are inefficiencies in the market that one can exploit via some additional piece of data or knowledge. Active investing is a long-term method that relies on choosing undervalued stocks via methods such as ratio analysis, DCF analysis, sector analysis, and, macroeconomic trend analysis. Active investing has numerous advantages, with the chief one being the ability to obtain returns that exceed the market. In active investing, returns are derived from exploiting inefficiencies in the market that directly opposes the efficient market theory. Most active investors believe they can beat the market by choosing certain high performing sectors or dig deeper and analyze certain companies that may be undervalued or overlooked by the market. This method has numerous advantages and disadvantages that are mainly dependent on the individual trader or investor.
The main advantages of active investing are the potential for higher returns via insights on certain sectors of the market. In addition, active management of a portfolio allows an investor to limit risk due to excessive correlation between stocks in a portfolio and thus increase diversity in assets. In addition to additional diversity and the potential for additional returns that surpass the market, an investor who actively invests gains large amounts of flexibility and can choose stocks that suit his expertise and interests rather than
become satisfied with mediocre market based returns. These advantages allow for active investing to be a favored option for investors who have the time and desire to perform basic research on their investment portfolios.
There are also some disadvantages of active investing due to the fact that it is inherently carries a higher risk than simply passively investing in an index fund. The main disadvantage is the investor or investment manager needs to be proficient in the financial markets and take an active interest in researching the financial asset being traded in order to receive an actual increase in returns. Another disadvantage is that if one’s method of choosing equities or financial assets is incorrect, one can lose significantly more capital than if invested in a simple index fund.
6.8 Manual Trading Vs. Automated Trading
With the creation of trading platforms based on the internet there has been a surge in traders using automated trade platforms to make decisions regarding investments. There are two main types of traders and investors, some decide to trade their positions manually, while others decide to automate the process by programming indicators to create an algorithm that can trade positions automatically. With each of these approaches to trading, one must balance the benefits and the problems of each approach. The benefits of
automated trading include the ability to maintain trade discipline, gather large amounts of data, and the ability to trade accurately and efficiently. However, a major issue with automated systems is that they cannot adapt to rapidly changing market conditions such as massive price fluctuations or improbable events. In addition, manual traders can have increased control in their record of profits and losses as they can see patterns and decide to deviate from rigid position boundaries to boost profit and minimize losses.
6.9 Fundamental Trading Vs. Technical Trading
A major consideration during the creation of a trading system is to determine whether the system will focus on the fundamentals of the market or the technical aspect. Fundamental traders usually make trades when company events occur that move prices in either direction and tend to employ a buy and hold strategy. In addition to focusing on company events, fundamental investors may also research a company’s financial statements, management reports, corporate governance structure, and historic or future earnings reports in order to obtain a clear picture of the company’s value.
In contrast to fundamental investors who look towards a company’s future as an indicator of growth, technical traders and investors gather large amounts of information on the price history of companies to determine future price movements. The main premise of technical trading and investing is the use of numerous price indicators such as the moving average to make decisions on whether to enter the position. However, the sheer quantity of indicators for a given market makes it extremely difficult to choose several broad
indicators, which makes a trader use different indicators for each sector. In addition, it is a common notion that past performance of assets do not indicate future performance, thus most investors do not use technical indicators as final decisive factor but rather use it as a screening tool for further analysis. Alongside the moving average several key technical indicators include the RSI (Relative Strength Index), support, resistance, pattern analysis, trends, and opening/closing prices.
Investors and traders use both technical and fundamental trading methods to enter and exit positions as each method has benefits and disadvantages. A trader who trades on mostly short term positions is most likely to use technical analysis as it can provide insight
on a position in a short period of time. In contrast, longer-term investors use fundamental trading strategies as it can provide more gains in the future than simply trading based on historic pricing indicators.
6.10 Personal Objectives of Trading Systems
When investors and traders design trading strategies and systems they have some concrete objectives, they desire to be fulfilled. These objectives vary based on each individual investor and trader based on their desire for either short or long term profits.
Long term traders and investors design trading systems that usually require
minimal time commitments, high profit factors, sector robustness, and high annual return. The minimal time commitment objective is valued because most long-term investors have other passions or desires they would rather devote their time too rather than
micromanaging their portfolio such as most day traders. The profit factor of a system is a universally vaunted objective and it determines whether a system is effective at generating return for a trader or investor. A profit factor of above one signifies that the system does not lose money and generates positive return. Sector robustness is an essential objective of long-term systems as market sector conditions can be volatile over long periods of time and thus sector diversification minimizes the effect of sector losses on the entire portfolio. Another key objective of a long-term system is the high annual return, due to the fact that the risk-free rate for a long-term portfolio is directly tied to the risk free rate of the S&P 500, which is currently at around 9%. In essence, if a trading system does not achieve an annual return of over 11% (inclusive of fees and expenses) it does not generate a
noticeable return for the investor or trader as one can simply invest in an index fund and achieve the risk-free rate.
In contrast to long-term traders, short-term traders must consider different objectives that more closely align with their goals. The objectives of many short-term investors revolve around a high winning percentage, low drawdown, low market exposure, minimal holding period, and the profit factor. The profit factor is also essential to short-term traders as it signifies the profitability of the system. As is the case of a long-short-term system, a profit factor of above one signifies that the system can generate a positive return on investment. A high winning percentage is important in a short-term system due to the fact that it allows for the maximization of returns in the face of the high commission costs associated with rapid trading systems. Short term investors also prefer to minimize their exposure to the market as well as have low draw-downs in order to minimize their losses since the market can be extremely volatile when trading in short time periods such as minutes or even seconds. The desired objectives of a trading system play a major role in deciding which trading strategy to utilize for an investor or trader.
6.11 Fundamental Law of Trading Strategies
When designing trading systems, it is important to realize that it is impossible to achieve all desired objectives as stated by the fundamental law of trading strategies. The main tenet of this law is that as the profit factor increases or the trade ratio declines, the necessary winning percentage of the system or strategy increases in proportion. Due to this requirement, a trader or investor can avoid losses and set a desired winning percentage as long as the individual realizes that this will have an effect on the profit factor and trade ratio of the system as a whole. (Radzicki Topic #5 Slide 19)
6.12 Trading System Rules
Any trading system design is inherently a simple amalgamation of various rules that must be executed in a certain order to obtain the desired result. A proper trading system or strategy should contain the following components: entry rules, exit rules, loss rules, position sizing rules, order type rules and stock screening rules.
6.12.1 Entry Rules
Entry rules are a key component of a trading system as they determine the frequency with which the system trades on the open market. Trading frequency directly corresponds to commission costs as costs rise alongside an accompanied increase in trading frequency. When generating entry rules for a trading system it is important to be broad in terms of choosing indicators and triggers in order to minimize the risk of missing large market movements. For example, if there are too many entry rules one may miss a large price swing in a certain equity due to the fact that the system may have not entered the position since all entry rules were not met.
There are two types of main entry rules: set-up rules and trigger rules. The goal of set-up rules is to discover favorable conditions in the market that can increase return on an investment position. These rules can be based on a variety of factors such as
Macroeconomics, Global Events, or Sector Rotation. Rules that are generated based on macroeconomics require that the trader be actively participating in the econ
omic calendar and understand basic macroeconomic theory. When generating rules based on world events, an investor must pay acute attention to news of global events. For example, if there is conflict in the middle east oil prices may rise which can signal an entry point into the energy sector. If using sector rotation to generate entry set-up rules,