Copyright © UNU-WIDER 2011 1
Carol Newman, Department of Economics, Trinity College Dublin, 2John Rand, University of Copenhagen, and 3Finn Tarp UNU-WIDER and University of Copenhagen, corresponding author: [email protected].
This study has been prepared within the UNU-WIDER project on Learning to Compete: Accelerating Industrial Development in Africa, directed by John Page.
UNU-WIDER gratefully acknowledges the financial contributions to the project by the Finnish Ministry for Foreign Affairs and the Swedish International Development Cooperation Agency—Sida, and the financial contributions to the research programme by the governments of Denmark (Royal Ministry of Foreign Affairs), and the United Kingdom (Department for International Development—DFID).
ISSN 1798-7237 ISBN 978-92-9230-416-4
Working Paper No. 2011/49
Industry Switching in Developing
Countries
Carol Newman
1, John Rand
2and Finn Tarp
3September 2011
Abstract
Firm turnover (i.e. firm entry and exit) is a well-recognized source of sectorlevel
productivity growth across developing and developed countries. In contrast, the role and
importance of firms switching activities from one sector to another is little understood.
Firm switchers are likely to be unique both from newly established entrants and exiting
firms that close down. We build an empirical model that examines switching behaviour
based on data from Vietnamese manufacturing firms during the period 2001–08. Our
diagnostic shows that switching firms have different characteristics and behaviour as
compared to entry and exit firms. They tend, inter alia, to be labour-intensive and seek
out competitive opportunities in labour-intensive sectors in response to changes in the
market environment. We also show that resource reallocations resulting from switching
form an important component of productivity growth.
Keywords: firm dynamics, sector switching, efficiency, Vietnam
JEL classification: D21, L6, O14
The World Institute for Development Economics Research (WIDER) was established by the United Nations University (UNU) as its first research and training centre and started work in Helsinki, Finland in 1985. The Institute undertakes applied research and policy analysis on structural changes affecting the developing and transitional economies, provides a forum for the advocacy of policies leading to robust, equitable and environmentally sustainable growth, and promotes capacity strengthening and training in the field of economic and social policy making. Work is carried out by staff researchers and visiting scholars in Helsinki and through networks of collaborating scholars and institutions around the world.
www.wider.unu.edu [email protected]
UNU World Institute for Development Economics Research (UNU-WIDER) Katajanokanlaituri 6 B, 00160 Helsinki, Finland
Typescript prepared by Lisa Winkler at UNU-WIDER
The views expressed in this publication are those of the author(s). Publication does not imply endorsement by the Institute or the United Nations University, nor by the programme/project sponsors, of any of the views expressed.
Acknowledgements
We are grateful for productive and stimulating collaboration with staff associated with
the Central Institute of Economic Management (CIEM) and the Institute of Labour
Science and Social Affairs (ILSSA) in Hanoi, Vietnam. Thanks are due as well to
participants at the 2007 and 2011 Nordic Conferences in Development Economics.
They provided useful comments and suggestions on earlier drafts and motivated the use
of data that has only recently become available. Financial support from Danida in
carrying out this research is also appreciated.
1 Introduction
In the literature on firm turnover, any firms that leave a particular sector are, with one major exception covering US manufacturing plants (Bernard et al., 2006), classified as exit firms.1
This is so, even if some firms in reality do not close down but switch production to a different sector. Similarly, new entrants include both genuinely new firms and firms previously operating in other sectors.2
This is surprising given that switchers are likely to be different both from other firms entering and those which exit. Moreover, if sector switchers are more productive than other firms, then new entrants may be accredited with contributing to productivity growth to a greater extent than they actually do.If switching firms do have different characteristics to ‘real’ entry and exit firms and are motivated by different factors, then understanding this dynamic is important for understanding the potential effect of changes in the external environment on productivity.3
We present a basic conceptual framework along the lines of Ericson and Pakes (1995), which outlines the process through which firms decide to enter, exit or switch sectors. This behavioural framework is used to make predictions about the potential drivers of firm dynamics, and in particular firm switching behaviour. We consider how firm turnover might be affected by the observed characteristics of sectors and exogenous shocks such as regulatory changes and trade liberalization and what this might mean for productivity.
Motivated by our theoretical predictions, we empirically explore the factors associated with the type of switching behaviour observed and compare them to those related to entry and exit in a case study for Vietnam, using census data for the period 2001–08. We also measure the importance of industry dynamics for productivity growth and identify the component of productivity growth that is due to the reallocation of activities across broadly defined sectors. Accordingly, a core aim of this paper is to diagnose the extent to which differences exist between entry, exit, and sector switching firms. We rely on estimations of firm level revenue productivity measures for sub-sectors of the manufacturing sector, and use these productivity measures to establish the contribution of (i) firm turnover, and (ii) sector switching versus ‘real’ entry and exit, to productivity growth. Throughout the analysis, particular focus is given to the role of trade liberalization and deregulation.4
1 For an overview of this literature see Caves (1998), Bartelsman and Doms (2000) and Tybout (2000). 2 It may also happen that firms, which change ownership form or location in one year are classified as exit
firms and as entry firms the next year, see for example Aw et al. (2001).
3 Another recent area of literature analysing firm dynamics and productivity growth has focused on changes in the product mix by surviving firms as the main channel of productivity growth, see for example Bernard et al. (2009; 2010), Goldberg et al. (2008) and Eckel and Neary (2006).
4 A large literature points to a variety of relevant mechanisms through which trade liberalization can impact positively on productivity growth, see for example Melitz (2003) and Pavcnik (2002). For analyses of the extent to which deregulation induces resource reallocations within an industry see Eslava et al. (2004), Olley and Pakes (1996), and Stiroh and Strahan (2003).
Section 2 presents the conceptual framework used to organise our empirical model. Section 3 presents the empirical approach while Section 4 describes the data. Empirical results are put forward in Section 5 and Section 6 concludes.
2 Behavioural framework
The seminal literature on the evolution of industry and industry dynamics does not consider the possibility that firms may choose to reallocate resources into new sectors to maximise profits or to avoid exiting the industry. Yet, the general line of thinking in the contributions by Dunne et al. (1988; 1989), Jovanovic, (1982), Dixit (1989), Hopenhayn (1992), Ericson and Pakes (1995), and Olley and Pakes (1996) can be relied on to predict the probability of a firm switching its main production activity. Such extension is a key aim of this paper, and to motivate and organise our empirical investigation, we set out a behavioural framework departing from Ericson and Pakes (1995).5
Accordingly, we assume that there are two sectors in an industry and that in each sector there are a large number of price-taking firms, facing the same market structure and producing a homogenous output. Firms differ both in terms of their productivity ( ) and their expectations about future market conditions (Ω), both in their sector and in the other sector in the industry. We assume that the objective of each firm is to maximise the expected value of current and future profits. Profits ( ) will depend on the firm’s choice of inputs, their productivity, and market conditions.
Firms pay a sunk cost of entry into sector j ( ) and will enter if | ≥ .6 Each
period, a firm decides to exit or switch production to a different sector, before deciding how much to invest. Firms continue to produce if the expected value of future profits exceeds the termination valuation of the firm ( ). In evaluating future profits the enterprise considers the profit that is attainable in its sector (sector j) relative to the profit that could be achieved in
the alternative sector (sector s).
The firm will switch to sector s if the expected profits from producing in this sector, less the
sunk cost of switching ( ), are greater than the expected profits from continuing to produce in sector j plus the termination value of the firm, that is | ) − > | ≥ .
Given that switching firms have incurred sunk costs when initially setting up production, we expect the sunk costs of switching to a different sector to be less than the sunk cost facing new entrants into that sector.7
5 Olley and Pakes (1996) and Pavcnik (2002) use a similar conceptual framework to help inform their empirical investigations without deriving a full theoretical model.
6 A class of models on the evolution of industry assume that prior to commencing production firms are unaware of what their individual productivity draw will be but will learn this information upon entry (Jovanovic, 1982). Firms will ‘learn-by-doing’ and will improve their productivity and profitability in each period. In this way the evolution of the firm and the industry depends on the initial unobserved productivity draw. In what follows, we assume that productivity evolves as a first order Markov process, which is consistent with this idea.
7 Switching costs could be interpreted as a depletion of capital stock due to, for example, certain machinery or equipment becoming obsolete. Investment in new machinery or equipment, however, would be considered an investment that adds to the firm’s capital stock.
Firms may also face a shock to productivity as a result of switching activities which they will take into account in making their decision. Profit will depend not only on the firm’s productivity relative to other firms in the sector, but also on market conditions in that sector. We assume that market conditions are not fully observed by the firm but are anticipated with varying degrees of success depending on the characteristics of the firm and on the observed (by all firms) sector characteristics. Conditional on continuing production, the firm chooses inputs. We assume that labour is fully flexible and so the firm’s only input choice at the beginning of each period is how much to invest in accumulating capital ( ).
In sum, the firm’s choice of (i) whether to produce; (ii) which sector to produce in; and (iii) what level of inputs to use will depend on the firm’s expected profit. This depends on productivity relative to firms in both the same and other sectors, and the firm’s level of uncertainty about future market conditions in its own sector versus alternative sectors in the industry.8
The incumbent firm has three options: (i) exit and accept the termination value; (ii) invest in sector j; or (iii) invest in sector s for a sunk cost . The Bellman equation for the firm’s
problem is given by equation (1).
, ) = , sup , − + , , sup , ) − ) − + , ) |Ω ,Ω (1) where is the cost of investment in capital. Capital accumulates in equation (2) as follows:
= 1 − ) + 1 − + ) − )
(2) where = 1 if the firm switches from sector j to sector s in period t+1.
As in Olley and Pakes (1996) and Hopenhayn and Rogerson (1993) we assume that productivity evolves according to an exogenous Markov process. The solution to this problem generates an equilibrium strategy for firm decisions to exit, switch and invest, which defines the market structure of the industry.9
In addition, the following key predictions emerge:
i. Switchers will be less productive than incumbents. They face a sunk cost of switching and the information they have regarding their productivity and market conditions will be more specifically related to the sector in which they produce prior to switching.
8 Pavcnik (2002) notes this is consistent with an imperfectly competitive market structure where firm choices are dependent on the actions of other firms in the industry.
9 Ericson and Pakes (1995) prove the existence of a Markov Perfect Nash Equilibrium for the case where there is one sector in the industry. We assume that an equilibrium exists within the framework sketched here and use the theoretical predictions to help inform our empirical analysis.
ii. Switchers will be more productive than exits. They too would have exited if their expectations about future profitability (which depends on productivity) were less than that of exit firms.
iii. The extent to which switchers will be more or less productive than entrants is ambiguous. Switchers will have greater knowledge of both their productivity potential and general market conditions and so are likely to have a higher level of productivity than entry firms. However, this will depend on the productivity draw of the entry firm which is assumed to be unknown a priori. The sunk costs of switching will be below
those of entrants.
iv. Firm switching depends on observed sector characteristics relative to those of other sectors. This is so given that expectations about future market conditions play an important role in the decision to switch and exit.
3 Empirical approach
3.1 Empirical model
The empirical model for our diagnosis of how firms differ in their probability of switching is given in equation (3), which is followed by a set of general observations and information on how we estimate productivity. We turn to detailed discussions of the various firm-specific, sector-specific, and industry-specific characteristics associated with firm entry, exit and switching in subsequent sub-sections.
ℎ_ =
, ⁄ , log ) , , , ,
, ⁄ , log , , , , , ,
, , ,
(3) where is the productivity of firm i in sector j in period t; ⁄ is the capital stock of
firm i in period t; log ) is the log number of employees of firm i in period t; is a
dummy indicator for whether the firm i is state-owned in period t; is a dummy
indicator for whether the firm i is foreign-owned in period t; is a dummy
indicator for whether firm i produces more than one product in period t; is the dispersion
in productivity in sector j in period t; ⁄ is the average capital/labour ratio of sector j in
period t; is the average size of firms in sector j in period t; is the concentration
ratio in sector j in period t; is the concentration of foreign-owned firms in sector j in
period t; is the concentration of state-owned firms in sector j in period t; is the tariff
rate in sector j in period t; is the level of exports of goods from sector j in period t; are
firm-specific fixed effects; are sector-specific fixed effects; are time dummies; and are province fixed effects to control for differences in the location of firms. The inclusion of sector-specific effects controls for any time invariant unobserved differences across sectors that may influence the decision of firms within those sectors, while the inclusion of time dummies controls for general shocks that affect all sectors equally.
We note that the decision to switch into a sector, the decision to exit and the decision to enter are all modelled in a similar fashion, and highlight that the inclusion of firm-specific fixed effects eliminates any time invariant unobserved heterogeneity influencing firms’ decisions to enter, exit or switch sectors. As such the identification of the effect of the firm-specific effects (included in the model) comes from the within-firm variation in firm characteristics. It is possible that some time varying factors remain unobserved and so the (i,t) indexed
variables are endogenous to firm behaviour, and hence to the switching, entry and exit outcomes. Consequently, we are careful not to claim that our results are causal.
We use an index number approach to estimate total factor productivity for firms in each sub-sector of the manufacturing sub-sector. This approach is similar to that of Aw et al. (2001) who estimated productivity differentials for Taiwanese manufacturing firms.10 Productivity is
measured relative to a reference point which we take as the mean level of productivity in a given sector and year.11 In order to analyse changes in productivity over time we chain link
this productivity differential to changes in the reference level of productivity from year to year.
The index is given in equation (4), and we highlight that the TFP measure is sector-specific. This means that the productivity of a firm is compared—in any given time period—relative to the average productivity of the sector.12
∑∑
∑
∑
= = − − = = − ⎟ ⎠ ⎞ ⎜ ⎝ ⎛ − ⎟ ⎠ ⎞ ⎜ ⎝ ⎛ + + ⎟ ⎠ ⎞ ⎜ ⎝ ⎛ − ⎟ ⎠ ⎞ ⎜ ⎝ ⎛ + − ⎟ ⎠ ⎞ ⎜ ⎝ ⎛ − + ⎟ ⎠ ⎞ ⎜ ⎝ ⎛ − = t k m __________ mjt ________ mjt _______ mjt ____ mjt k m _________ mjt mijt _____ mjt mijt t _________ jt ________ jt _______ jt ijt ijt X ln X ln s s X ln X ln s s Y ln Y ln Y ln Y ln 2 1 1 1 1 2 1 2 1 2 1 τ τ ω (4)where Yijt measures output of firm i in sector j year t; Xmjit measures the amount of input m
used by the firm; and smjit measures the expenditure of the firm on input m as a share of the total expenditure of the firm.
We use firm-specific productivity scores to compute a measure of productivity for each sub-sector in each year in equation (5).
∑
= = n i ijt ijt jt w wpr 1 ω (5) where∑
∑
= = ⎟ ⎠ ⎞ ⎜ ⎝ ⎛ = n i n i ijt ijt ijt y y w 1 1 .10 We only have access to data on the value of inputs and output, so cannot pursue estimating physical productivity measures as suggested in Foster et al. (2008). We acknowledge that our revenue based productivity measure may—as is the case in most previous studies of enterprise dynamics and productivity—confound true efficiency with prices, elasticities and scale economies.
11 We also perform a robustness check where we use the maximum productivity in the sector as the reference point.
12 We consider both 2-digit and 4-digit levels of aggregation. The 4-digit level of aggregation is complicated by the fact that new 4-digit sectors emerge over the course of the sample period, which prevents linking to the reference productivity level year-on-year. Where this occurs we use the reference productivity level for the 2-digit sector as a whole. The reduced sample which does not use this correction yields very similar results (available on request).
In line with for example Olley and Pakes (1996), this weighted productivity measure can be decomposed as shown in equation (6) into the average unweighted productivity level of each sub-sector
∑
= = n i ijt jt n 1 1 ωω and a term which captures how the allocation of resources within a sub-sector in any given year contributes to productivity.
(
)(
)
∑
= − − + = n i jt ijt jt ijt jt jt w w wpr 1 ω ω ω (6) 3.2 Firm-specific factorsOur behavioural framework suggests that productivity is critical to firm decision-making since firms evaluate their expected current and future profits on the basis of their own observed productivity level. As such we expect the firm’s productivity level to be a first significant factor affecting its decision to stay in production, switch sectors or exit production altogether.13 Arguably, entry firms are—as already suggested—likely to be less productive
than switchers and incumbents, since they face higher sunk costs than switchers and have less knowledge and expertise, and we expect incumbents to be more productive than switchers for similar reasons.
Second, capital accumulation is a key mechanism for increasing profitability. This suggests that capital-intensive firms should increase profitability over time and so should be less likely to exit and more likely to enter as the industry evolves. Bernard et al. (2006) find that US firms’ capital labour ratios are an important determinant in the decision to switch sectors with capital-intensive firms switching to more capital-intensive sectors in response to exposure to competition from labour-intensive countries. In the case of Vietnam where labour-intensive firms arguably have a comparative advantage, we do not expect firms in labour-intensive sectors to have a higher probability of exit.
Third, the link between firm size and probability of survival has long been established as important,14 and this link could impact the firm’s decision to switch sector, with larger firms
potentially finding it more difficult to retrain employees. To capture this possibility we include the size of the firm in terms of the number of employees.
Fourth, we believe that ownership structure influences firm decision-making in Vietnam, even when firm productivity, capital intensity and size are controlled for.15 The political hierarchy still present in Vietnamese state-owned enterprise (SOE) management structures is
13 Given that there are difficulties in comparing productivity levels across sectors we also consider where the firm ranks in the productivity distribution as an alternative measure.
14 The age of the firm is also an important predictor of firm survival, but our data do not identify this characteristic. In any case, the inclusion of firm-specific fixed effects controls for any initial differences in the survival or switching probability of firms attributable to differences in age at the start of the sample period.
15 Choices are involved in classifying firms by ownership type and there are ‘grey’ areas involved in distinguishing between state and foreign-owned firms. This is unavoidable in the type of analysis pursued here. As regards mergers these are very limited in number as this process is just starting in Vietnam. As such merging is of no quantitative significance to our results. In most mergers and acquisitions firms kept at least one business registration licence and one tax code registration. This means that one firm stays in our data as an incumbent and the rest of the merger firms exit. Note also that mergers and acquisitions are often followed by sector switch.
likely to limit inter-sector dynamics. SOEs are expected to switch sector less frequently as a result. At the same time, the ongoing reform/privatization process has led to the dismantling of many SOEs, so we might expect a positive association between state ownership and firm closure. Foreign-owned enterprises, or enterprises with some foreign participation, are also expected to be more ‘locked into’ specific sectors due to legal constraints.16 With further
reform of the investment law-making it easier for foreign firms to enter the Vietnamese market it is likely that a positive association between foreign ownership and entry and potentially switching behaviour will emerge.
Fifth, the recent attempts by Bernard et al. (2010) and Goldberg et al. (2008) at explaining productivity-enhancing reallocations through changes in the product mix suggest that multi-product firms will be in a better position to multi-product churn (drop inefficient multi-products to produce more efficient products) in response to changes in the economic environment.17
These firms may be in a better position to seek productivity-enhancing reallocations from within their product mix rather than through sector switching.18
3.3 Sector-specific factors
A range of sector-specific measures are considered in establishing the competitiveness of the sector relative to other sectors in the industry.
First, higher levels of average productivity would make it more difficult for firms to compete. Due to difficulties comparing productivity across sectors we also consider a unit-neutral measure of productivity namely the dispersion in the productivity distribution. It is easier to survive in sectors with a larger dispersion in productivity given that low productivity levels are tolerated. Accordingly, we expect that firms are less likely to leave and more likely to enter sectors with a wider dispersion in the productivity distribution.
Second, the average capital intensity of the sector, as measured by the capital/labour ratio, may be influential. While Audretsch (1991) found that firm survival is much less likely where there is a high capital-labour ratio, Bernard et al. (2006) found that firms switched into more capital intensive sectors when exposed to competitive pressures from imports into labour intensive sectors.
Third, the average size of firms within the sector may affect the firm switching-in decisions. The larger the size of the firms in a sector the more difficult it is for entry and switching firms to compete given the economies of scale already enjoyed by incumbents. As such we expect firms to enter or switch into sectors where firms are smaller on average.
Fourth, the sector concentration ratio (CR), measured here as the ratio of the accumulated revenue of the four largest firms to total revenue in the sector, is likely to be influential given
16 Until recently, foreign and domestic investors were governed by two separate laws: the Law of Foreign Investment and the Law of Domestic Investment. A new investment law came into effect in July 2006 (CIEM, 2006). This law aims at equalizing opportunities for domestic and foreign investors.
17 Bernard et al. (2010) find that changes in product mix are a potentially important channel for resource reallocation in the US with firms exhibiting a large degree of product churning (dropping inefficient products to produce more efficient products) in response to changes in the economic environment. In a developing country context, Goldberg et al. (2008) find that changes in firms’ product mixes in response to regulatory reforms had an important effect on productivity growth in India during the period 1989 to 2003. 18 The difficulties in measuring the productivity of multi-product firms are highlighted by Bernard et al.
that it is a proxy for the degree of sector competition. Siegfried and Evans (1994) document that a high CR may strengthen collusion efforts among incumbent firms and increase the likelihood of behaviour to prevent entry and maintain higher expected profits. In contrast, Audretsch (1991) has shown that a high CR helps the survival rates of new entrants in the short run. On balance we expect that a high CR reduces firm incentives to move out of (i.e. exit or switch out of) a given sector and is indicative of barriers to entry that prevent firms from entering or switching into a sector.
3.4 Industry-specific factors
Changes in exogenous conditions may ‘shock’ the behaviour of enterprises leading to different productivity outcomes. Examples include sudden shifts in consumer preferences affecting demand, supply shocks driven by changes in industry structure due to policy reform, new or refined production technologies and trade liberalization. All of these events affect product profitability and are thus likely to affect firm allocation decisions in accordance with our behavioural framework.
We consider explicitly the possibility that trade liberalization, in the form of a tariff reduction (TR), leads to the exit of low productivity firms or the switching of firms to sectors that remain protected. Given that trade liberalization may lead to more opportunities on export markets we also hypothesise that more productive firms will switch to sectors where these opportunities emerge (EX).
It is in the case of Vietnam also of interest to explore the impact that deregulation in the form of privatization of SOEs and the opening up of the market to entry by foreign-owned enterprises may have had on the manufacturing industry.19 Where an entire industry is
undergoing deregulation as is the case in Vietnam, a significant amount of productivity-enhancing reallocations are likely to take place. We expect the dominance of state enterprises (SR) (state-owned enterprise share of total sector output) to play a role in exit and switching decisions. Preferential treatment of SOEs makes it difficult for non-state enterprises to compete and may force more efficient non-state firms to exit (or decide not to enter highly SOE concentrated industries).
At the same time, during the ongoing transition from a planning to a market economy the SOE share of material inputs bought at market conditions may, as suggested by Jefferson and Rawski (1994) in the case of China, increase the attractiveness of highly SOE concentrated industries for smaller (private) enterprises acting as producers of intermediates for SOEs. Another dimension is that the deregulation of SOEs may increase competition in a sector due to the decline in the level of protection and barriers to entry and may induce firms to switch to other sectors.
Similar arguments apply when considering the dominance of foreign enterprises (FR) (foreign enterprise share of total sector output). Aitkin and Harrison (1999) emphasise that preferential treatment of foreign-owned firms may distort competition and force (equally
19 Olley and Pakes (1996) found that the restructuring of the telecom industry in the USA involved significant entry and exit with post-deregulation productivity improvements being mostly attributable to the reallocation of capital toward more productive firms. Similar results have been found for other sectors such as the US banking sector, for example (Stiroh and Strahan, 2003). Elsava et al. (2004) find that market reforms lead to reallocations away from low productivity firms to high productivity firms resulting in aggregate productivity gains.
efficient) domestically owned counterparts out.20 However, one reason why governments
grant special treatment is to promote technology transfer, and new products and/or production processes introduced by foreign firms may indeed spill-over to domestic firms. Diffusion can also occur through labour turnover, so a high presence of foreign enterprises in a particular sector may attract domestic firms. In sum, whether FR is positively or negatively related to sector switching and firm exit depends on which of the above effects dominate (competition versus technology transfer).21
4 Data
Our data originate from the 2001–08 Enterprise Surveys collected annually by the General Statistics Office of Vietnam and include the population of all registered enterprises with 30 employees or more and a representative sample of smaller firms.22 We include all firms
whose main enterprise is in the manufacturing sector.23 Our sample therefore includes almost
31,000 firms.
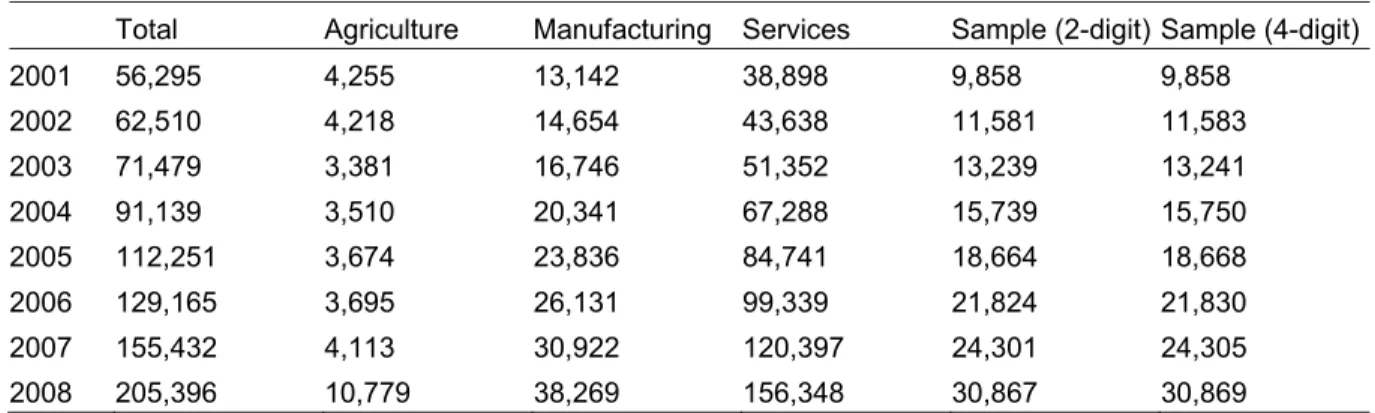
Table 1 presents the numbers of firms included in our dataset in each sector in each year and the sample of manufacturing firms used in our analysis for which a complete set of information is available.24
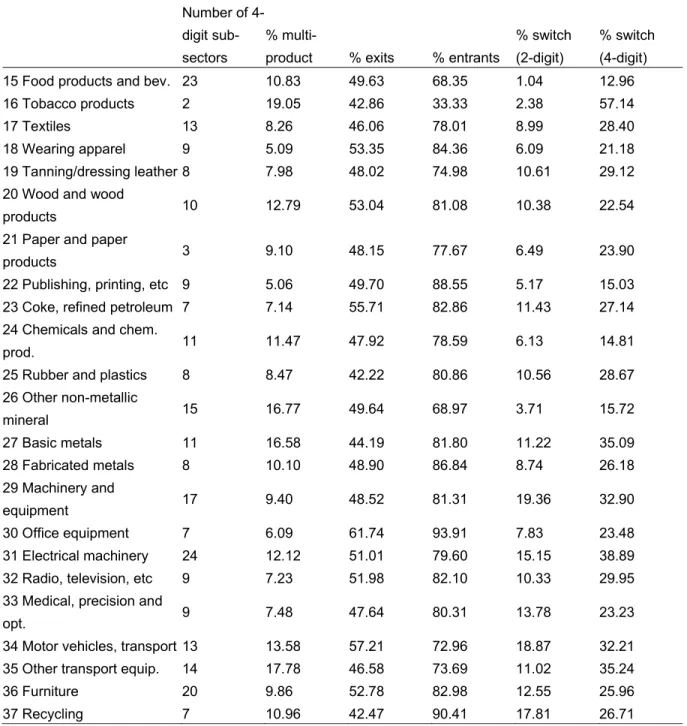
Table 2 illustrates the extent of diversification within the manufacturing sector. First, we present the number of 4-digit sub-sectors within each 2-digit sector which varies considerably across sectors. We do not have data to examine product diversification at the 6-digit level, as in Bernard et al. (2010) and Goldberg et al. (2008). However, we can tell whether firms produce more than one product and find that between 5 to 17 per cent of manufacturing firms do so. For these firms diversification across product mix is a potential source of productivity growth that we cannot capture in our analysis.
We use both 2-digit and 4-digit classifications of economic activity and switching behaviour in our analysis. While Bernard et al. (2006) focus exclusively on 4-digit switching we find that for Vietnam a large amount of switching occurs, even at more aggregated levels. Table 2 highlights the significant extent of enterprise dynamics within each 2-digit manufacturing sector. This is consistent with much of the existing literature on firm dynamics which finds a
20 Evidence for Venezuela suggests that once sector-specific effects are controlled for, domestic firms perform worse as foreign dominance in a sector increases (Tybout, 2000).
21 Foreign enterprises may also create a basis for domestically owned firms to produce intermediate inputs as in the case of SOEs. Therefore, inter-industry spillovers from FDI may occur. Javorcik (2004) finds evidence of backward linkages for Lithuania while Alfaro and Rodriguez-Clare (2004) find similar evidence for Venezuela, Brazil and Chile.
22 Trade and tariff data are from the World Integrated Trade Solutions database. Trade data at the 4-digit (2-digit) level for Vietnam with the rest of the world are taken from the UN COMTRADE database. Tariff data refer to the 4-digit (2-digit) weighted average Most Favoured Nation tariff applied to imports collected from the UNCTAD-TRAINS database for all imports into Vietnam
23 Given that only a representative sample of small firms is included it is possible that the entry, exit and switching behaviour of small firms is not fully observed. As a robustness check we also analyse firms with 30 employees or more.
24 We use both 2-digit and 4-digit classifications of economic activity in our analysis and slightly different samples are available depending on which classification we use.
positive correlation between exit and entry rates at the sector level.25 We also see a very high
level of switching behaviour at both the 2-digit and 4-digit level across sectors ranging from 1 to 19 percent of firms when switching is defined at the 2-digit level and from 12 to 50 percent when switching is defined at the 4-digit level.
To place the extent of switching behaviour in Vietnam in context, Bernard et al. (2006) found that approximately 8 percent of US manufacturing firms switched activity (defined at the 4-digit level) during 5-year periods between 1977 and 1997. The fact that switching is much more prevalent in Vietnam reflects in our assessment an evolving industrial sector where new opportunities emerge due to deregulation and trade liberalization, as well as due to ongoing structural transformation. The extent of switching behaviour observed adds further weight to our view that the effects of switching on productivity should be decomposed from the effects due to standard exit/entry; and that a better understanding of the drivers behind switching is potentially rewarding from the perspective of designing effective economic policy.
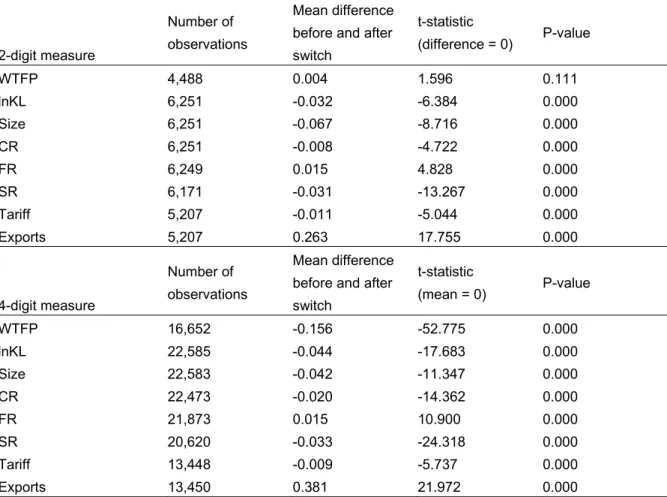
As discussed in Section 3, our empirical model includes a range of firm- and sector-specific factors. Summary statistics are provided in Appendix A1. Before proceeding in Section 5 to estimating our empirical model we explore the mean difference in each sector-specific characteristic before and after a firm switches sector to establish a priori whether there is a
clear pattern to switching behaviour in the raw data. The results are presented in Table 3. Statistically significant sector-specific differences emerge when comparing the sector characteristics of switching firms before and after they switch sectors. With the exception of sector level productivity, these differences hold when switching and sector-specific characteristics are defined at the 2-digit or 4-digit level. We also find some evidence to suggest that firms move into sectors where they are more likely to be able to compete. For example, firms switch into sectors with smaller average firm size and with lower concentration ratios. They also switch into sectors with lower levels of concentration of state-owned enterprises suggesting that firms may be pushed out of these sectors or, alternatively, find better opportunities available in other sectors. In contrast, we find that firms switch into sectors with high levels of foreign-owned enterprises that are more export-intensive. This suggests that these sectors may have better opportunities for firms.
In contrast to the Bernard et al. (2006) findings for US manufacturing firms it appears that firms switch into more labour-intensive sectors. This is consistent with the view that Vietnam has a competitive advantage in labour-intensive production and that firms are reacting to new opportunities for exports from these sectors. In contrast to our expectations we find that firms switch into sectors with lower tariffs suggesting that they are not deterred by the increased competitive pressures from imports. Finally, we find that firms switch into sectors where average productivity levels are lower, but this result only holds for the 4-digit measure of productivity and switching.
25 Dunne et al. (1988) and Disney et al. (2003) find a high level of correlation between entry and exit rates within the US and UK manufacturing industries, respectively. Roberts and Tybout (1996) find similar evidence in a developing country context.
5 Empirical results 5.1 Productivity growth
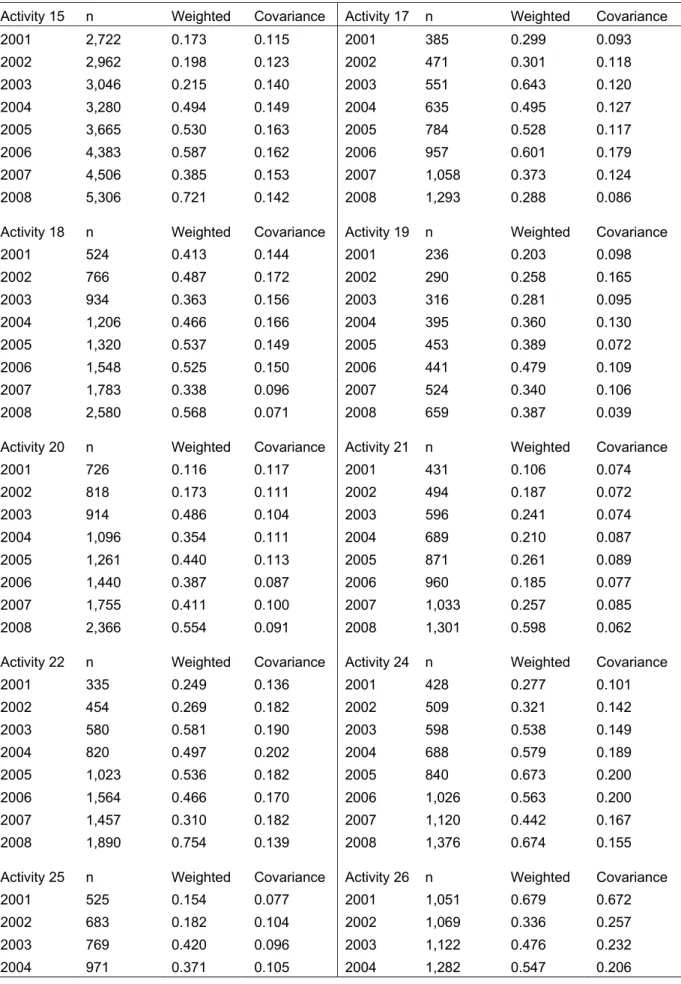
We first estimate productivity for each sub-sector of the manufacturing industry.26 Table 4
presents the trend in productivity by sector from 2001 to 2008 computed using the index number approach outlined in Section 3.27 The contribution of firm turnover (including firm
exit, entry and switching) to productivity is captured by the covariance between output and productivity. It is clear that the reallocation of market share from less to more productive activities is an important component of productivity growth. On average the reallocation component of productivity accounts for 40 percent of total productivity growth ranging from 9 to 137 percent, depending on the sector and the year.28
To determine whether switching is economically important we must, next, compare productivity between incumbents, entrants, exits and switchers. This involves assessing productivity performances across sectors. This is not straightforward. Relying on productivity
levels is not appropriate given that in the construction of the productivity index firms are
positioned relative to the average within the sector, making comparisons across sectors impossible to interpret.
To overcome this challenge, we rank the productivity performance of each firm within each sector and average this ranking across the lifetime of the firm. We then perform simple t-tests of the difference between incumbent, switching, entry and exit firms in terms of their average productivity ranking. The results are presented in Table 5 for productivity estimated using the index number approach both at the 2-digit and 4-digit level. For the former measure, switching is also defined at the 2-digit level, while for the latter it is defined at the 4-digit level. Each firm in the sample is counted once for the purpose of these tests.
We find that incumbent firms rank higher in the productivity distribution than entry and exit firms on both the 2-digit and 4-digit productivity measure, and this is so both when switchers are included with incumbents and when they are excluded. We also find that entry firms rank higher than exit firms for the duration of their survival in the panel. This is consistent with the extensive literature cited above which emphasises resource reallocations involving the exit and entry of firms into sectors as an important source of productivity growth.
Our behavioural framework predicts that due to information advantages switchers will be more productive than entry and exit firms, but less productive than incumbents given that the latter will have more information about the sector they are producing in than firms that have just switched into that sector. Our results show that switchers rank higher in terms of productivity than entry and exit firms, suggesting that switching firms are indeed a separate
26 The input and output variables used in the construction of the productivity indices are summarized in Appendix A2.
27 The figures presented are computed based on a 2-digit level of aggregation but the results are very similar when productivity is first measured at the 4-digit level and then aggregated to the 2-digit level. As a further robustness check we have estimated productivity using the Olley and Pakes (1996) approach for each 2-digit sub-sector. A very similar trend in productivity and disaggregation among the components of the index is found. Missing data on investment levels leads to a reduced sample when this approach is used. The results are available on request. The magnitude of the productivity estimates is neither directly interpretable, nor comparable across sectors. The focus should be on the trend over time and the importance of the reallocation component to overall productivity growth.
important source of productivity growth. We also find that incumbents have a higher productivity ranking than switchers, consistent with our theoretical predictions.29
5.2 Switching behaviour
Having established that sector switching is important for productivity growth we focus in the remainder of the empirical analysis on exploring switching behaviour.
Our behavioural model predicts that, conditional on firm-specific productivity, profitability and other characteristics, firms will base their exit and switching decisions on their expectations about future profitability and opportunities, both within the sector they are producing and in other sectors within the industry. In our empirical model we measure these expectations using observed sector characteristics relative to those of other sectors in the industry. Accordingly, we include sector-specific fixed effects, and this approach implies that the effect of sector-specific characteristics on firms’ decisions is identified through the between sector variation in these observed characteristics. The mechanism through which sector-specific factors impact on the firm’s decision making process is through the information it provides about market conditions in one sector relative to another.
To ascertain the importance of the above factors we rely on the model given in equation (3). We first include firm-specific factors along with firm-specific fixed effects, sector, province and time controls, and next we expand the model to include sector-specific factors, reflecting the extent to which regulatory reform and trade liberalization has induced entry, exit and switching behaviour.
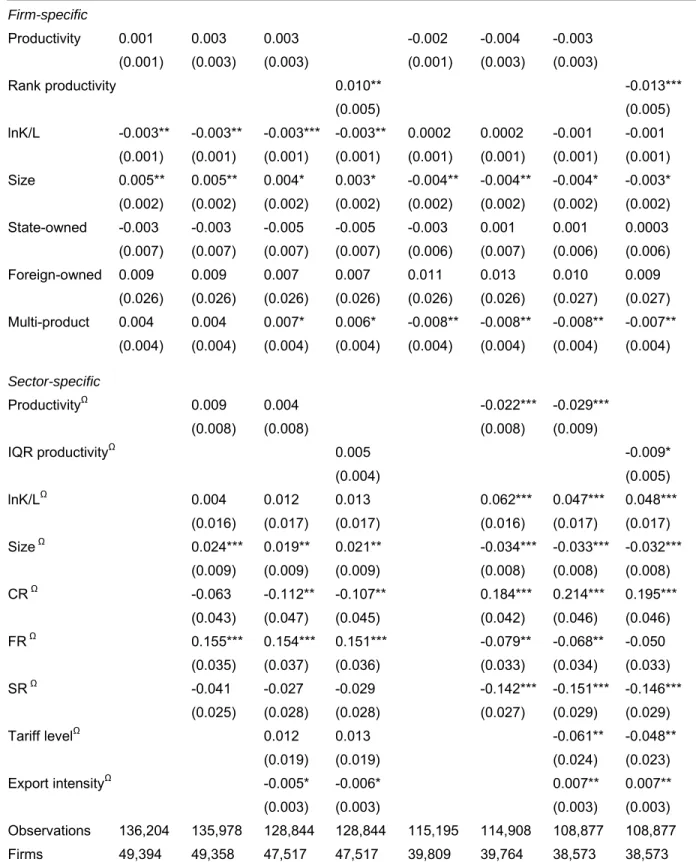
The first set of results relate to the decision of firms to switch into a particular sector. We present the results for the decision to switch out of a particular sector alongside these results since the former will identify the sector-specific pull factors affecting switching while the latter identifies the sector-specific push factors. The results for the 2-digit classifications of switching and the sector-specific variables included are presented in Table 6a while those for the 4-digit classification are shown in Table 6b.
The firm-specific factors associated with switching behaviour are largely the same, independently of whether the 2-digit or 4-digit classification is used. Switching firms rank higher in the productivity distribution of the sectors they switch into than other firms; and they rank below incumbents and other firms in the sectors they switch out of. This provides evidence that firms, which switch sectors, manage to improve their relative performance, and it suggests that our theoretical prediction seems to hold, i.e. that switching sectors to exploit profitable opportunities is a viable alternative to exiting production. It should be noted, however, that this depends on the assumption that relative productivity is a good indicator of profitability.
We also find that switching firms tend to be larger than other firms in the sectors they switch into and smaller than the firms in the sectors they switch out of.30 Given that much of the
literature suggests a positive association between size and survival probability, this finding indicates that firms switch to sectors where they are larger than other firms and therefore will
29 Comparing productivity levels across groups of firms leads to the same conclusions. Results are available on
request.
30 Dunne et al. (1988) find that firms that diversify into other industries are larger than new entrants and so are less likely to fail. Our findings are consistent with this result.
survive longer. There is also evidence in our results that switchers tend to have a lower capital-labour ratio than non-switching firms. This means that labour intensive firms are more likely to be switchers than capital-intensive firms. Moreover, there is evidence that multi-product firms are less likely to switch. This is in accordance with recent literature including Bernard et al. (2010) and Goldberg et al. (2008), which shows that multi-product firms have the potential to change their product mix in response to changing market conditions without switching sector.
The observed characteristics of sectors that are statistically important vary depending on whether switching is defined at the 2- or the 4-digit level. Focusing, first, on the 2-digit definition (Table 6a) we find that firms are more likely to switch into sectors with larger firms (on average), a greater concentration of foreign-owned firms, but lower concentration ratios in general. This is contrary to our initial expectations about the direction of the relationship between these sector-specific factors and firm behaviour presented in Section 3. We expected firms to be deterred from switching into sectors where firms are on average larger given the potential economies of scale advantage that incumbents might enjoy. However, given our earlier result that switchers are more likely to be labour-intensive firms it is not really surprising that they switch into labour-intensive sectors.
Furthermore, it was also expected that a high CR might reduce firms’ incentives to move out of a sector, but we find the opposite to be the case. That is, firms switch out of sectors with higher concentration ratios. This suggests that firms are more likely to switch into sectors that are more competitive than the ones they leave meaning that switching firms may seek out sectors that are less subjected to regulation.
Our literature review also led us to expect that firms would avoid sectors with a dominance of foreign enterprises (Aitkin and Harrison, 1999; Tybout, 2000). Instead we find that firms switch out of sectors with low levels of foreign ownership and into sectors with high levels of foreign ownership. This is indicative of a general move by firms toward more competitive sectors, and opens up for the possibility that the presence of learning spill-over effects and technology diffusion tend to make a sector attractive to domestic enterprises.
The behaviour of switching firms may also be explained, in part, by the ongoing process of structural change that took place in Vietnam over the time frame of the present analysis which opened up new competitive opportunities in many sectors. Nevertheless, Vietnamese firms are less likely to switch out of sectors with a high concentration of state ownership. This suggests that rigidities remain within parts of the manufacturing sector as a whole and prevent further productivity improvements from being realized.
Finally, in relation to trade liberalization, firms appear to switch into 2-digit sectors with low levels of export intensity relative to other 2-digit sectors and switch out of sectors with low tariff levels relative to other 2-digit sectors. This suggests that at an aggregate level firms are deterred from switching into sectors with high levels of trade exposure and choose to switch out of sectors that are more exposed to competition as a result of the ongoing process of tariff reductions. In sum, when we consider the 2-digit level of aggregation, the process of market liberalization appears to encourage firms to switch to more competitive sectors while trade liberalization has the opposite effect.
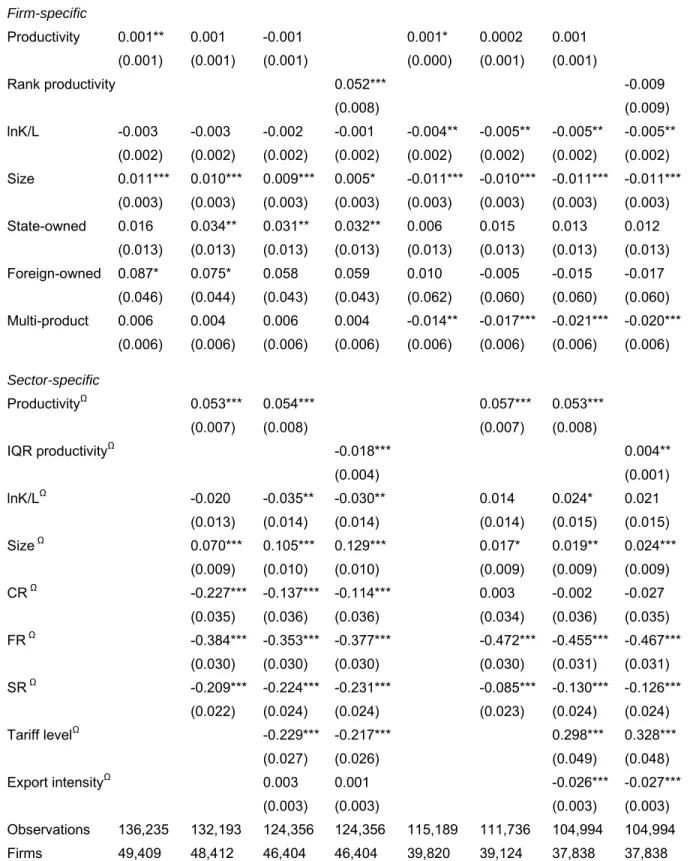
When switching is defined at the 4-digit level different sector-specific drivers emerge as being important. In particular, we find that many sector-specific factors are similar pre- and post-switching suggesting that switching at the 4-digit level is between sectors with similar characteristics. For example, firms appear to switch between high productivity sectors and
between sectors where firms are in general larger in terms of the number of employees. Given that our analysis is set in a developing country context where labour costs are relatively low, coupled with the evidence that firms are more likely to switch into sectors with low capital-labour ratios, it is not surprising that our analysis shows that firms are switching into sectors where they can potentially exploit low labour cost advantages.
In relation to the market structure variables, and in contrast to the results for 2-digit switching, we find that at the 4-digit level switching is less likely to occur in sectors with a large proportion of foreign and state-owned firms. We also observe that firms are more likely to switch into sectors with low concentration ratios meaning that they are not deterred by competition. Further support for this is the fact that we find strong evidence to suggest that firms switch into sectors with low tariff levels and out of sectors with high tariff levels and low levels of trade exposure. When considered alongside the results at the 2-digit level this means that at an aggregate level firms will make significant changes to the nature of their production to protect themselves against increased competition, while they are willing to switch to a different 4-digit sector to exploit potential opportunities that trade reform may afford.
5.3 Firm entry and exit
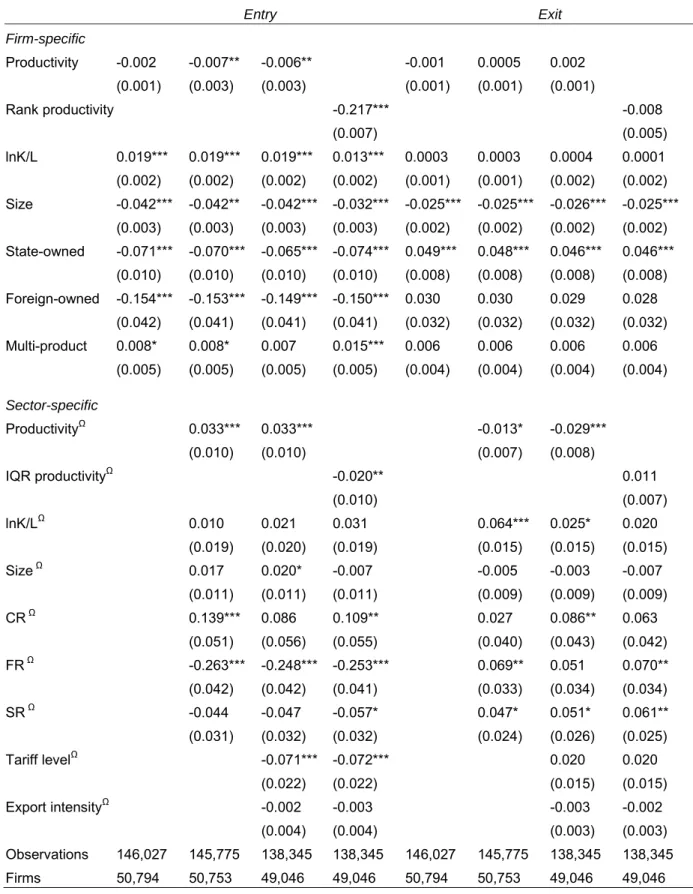
Table 7 presents the results of our empirical model describing the entry and exit decisions of firms in our data. Sector characteristics are aggregated at the 2-digit level but results are very similar at the 4-digit level.31
Dunne et al. (1988) find a significant amount of heterogeneity in the characteristics of entry firms in the US manufacturing sector. This is also the situation for Vietnam. In the case of firm-specific factors our results show that entry firms have lower productivity levels than incumbents and firms that switch into a sector. They are more capital intensive, and consistent with this observation, are of a smaller size in terms of the number of employees than other firms. Entry firms are more likely to be private domestic firms as opposed to state-owned firms or foreign-state-owned firms. This reflects deregulation of the manufacturing sector over the period of the analysis, which opened up many new opportunities for private domestic firms.
There is also some evidence that entry firms are more likely to be multi-product firms, which means that a new type of more flexible enterprise seems to have emerged over the period under study. Consistent with the literature on firm survival, smaller firms are, according to our analysis, more likely to exit production. Exit is associated in a statistically significant way with state ownership, rooted in the ongoing reform process discussed by CIEM (2003). It is clear from this analysis that the firm-specific characteristics of entry and exit firms are very different from those of switching firms.
In sum, our entry and exit results are consistent with the existing literature on industry evolution, but our expanded analysis identifying switching as separate from exit and entry points to a dimension that has so far gone completely unexplored in developing country contexts.
Further differences are embedded in sector-specific characteristics. Our results show that firms are more likely to enter sectors with high concentration ratios, which is consistent with
the Audretsch (1991) finding that a high CR may help the survival rates of new entrants in the short run. Meanwhile firms are also less likely to enter sectors with a high concentration of foreign-owned firms, consistent both with our finding for switching firms (4-digit) and the idea that preferential treatment of foreign-owned firms may distort competition deterring domestic firms from entering into sectors with a high foreign presence, as suggested by Aitkin and Harrison (1999) and Tybout (2000). Finally, we find that firms are less likely to enter sectors with high tariff levels, meaning that barriers to entry may exist in these sectors. 5.4 Robustness checks
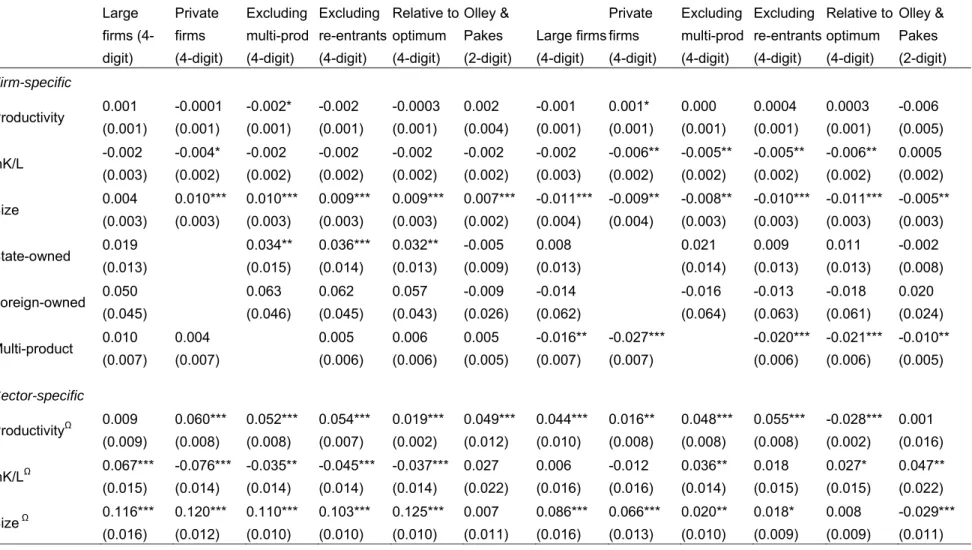
First, we consider a sub-set of data focusing in particular on large manufacturing firms (above 30 employees) for which we have a full population of firms. Second, we consider a sub-sample of private firms. Third, we exclude all multi-product firms given that measuring productivity is complicated for firms that produce more than one product. Fourth, we exclude firms that exit and re-enter the sample. Fifth, we consider two alternative measures of productivity, as discussed in Section 3, namely an index number approach based on a relative measure of productivity, which compares firms with the best producing firm in a sector, and a measure constructed using the Olley and Pakes (1996) semi-parametric approach to productivity measurement. The results for these six alternative specifications are presented in Table 8.
The most consistent findings across all specifications are that switching firms (i) have a lower capital labour ratio than other firms, (ii) are larger in terms of number of employees, (iii) are unlikely to be multi-product firms, (iv) switch between high productivity sectors,32 (v) are
more likely to switch into sectors with low capital to labour ratios,33 and (vi) are more likely
to switch into sectors with low tariff levels and out of sectors with low levels of export intensity.
6 Conclusion
The point of departure of this paper was the observation that while sector switchers are likely to have different characteristics and behaviour from ‘real’ exit and entry firms, this has never been studied and established empirically in developing country contexts. Arguably, this is an important omission in the existing literature on firm dynamics, and our understanding of the productivity impacts of firm turn-over and resource reallocations at both firm- and sector levels.
To help motivate and frame our empirical investigation of switching we adapted a behavioural framework based on Ericson and Pakes (1995), and proceeded to identify a list of key predictions about the productivity impact of switching. We also specified our detailed empirical model.
Data for our case study, focusing on sector switching in the manufacturing sector, originate from the 2001 to 2008 Enterprise Surveys collected annually by the General Statistics Office
32 One exception to this is when productivity is measured relative to the benchmark of the best performing firm. In this case our results suggest the firms switch out of low productivity sectors into high productivity sectors.
33 The only exception to this finding is for the sub-sample of large firms which are more likely to switch into high capital intensive sectors.
(GSO) of Vietnam. On this basis we have been fortunate to distil a unique panel dataset covering a very large number of manufacturing firms, including almost 31,000 firms for which complete information is available.
We found solid evidence that the reallocation of resources within and across sectors accounts for a significant proportion of total productivity growth in the Vietnamese manufacturing sector in the period studied, but also that firm switchers make an important contribution to these reallocations. They are indeed more productive than both entrants and exits, and firms which switch sector improve their productivity ranking on average, while entry firms rank lower in the productivity distribution.
Our analysis also revealed that switching firms have different characteristics to entry and exit firms and appear to be motivated by different sector-specific factors. For example, switching firms have a lower capital to labour ratio than entry firms, and firms which switch tend to be larger than firms in the sector they switch into, while entry firms tend to be smaller than other firms in the sector. Another insight is that multi-product firms are less likely to switch sectors. Deregulation and privatization induces switching behaviour at an aggregate level with firms switching into more competitive sectors, but switching at a disaggregate level occurs across similar sectors in terms of market structure. Finally, trade liberalization is positively associated with switching behaviour. At an aggregate level firms have switched from sectors exposed to trade into more protected sectors; while at a disaggregate level firms are more likely to switch into sectors with opportunities to trade.
Our analytical framework and empirical insights could, in our assessment, serve as a useful starting point for similar analyses in other developing countries and help inspire the necessary redesign of enterprise surveys across the developing world. Getting the respective contributions of entry, exist and switching firms to productivity growth right has important analytical and policy implications, but at this stage empirical evidence is almost non-existent. For Vietnam we conclude that: (i) there is a much more complex story of firm dynamics underlying the robust economic progress achieved in this dynamic East Asian economy than inherent in standard firm exit and entry explanations, (ii) firms have in practice adjusted to changing circumstances in sometimes innovative but not always easily predictable ways, (iii) government policy (including trade, information, credit, training and other support programmes as well as the development of the legal framework for business sector development) should pay careful attention to both the potential for productivity-enhancing reallocations through sector switching as well as the need to avoid that firms are motivated to switch into sectors that are not associated with comparative advantage.
References
Aitkin, B.J. and Harrison A.E. (1999). ‘Do domestic firms benefit from direct foreign investment? Evidence from Venezuela’, American Economic Review, 89(3), 605–18.
Alfaro, L. and Rodriguez-Clare, A. (2004). ‘Multinationals and linkages: evidence from Latin America’, Economia, 4, 113–70.
Audretsch, D.B. (1991). ‘New-firm survival and the technological regime’, Review of
Economics and Statistics, 73(3), 441–50.
Aw, B.Y., Chen, X. and Roberts, M.J. (2001). ‘Firm-level evidence on productivity differentials and turnover in Taiwanese manufacturing’, Journal of Development
Economics, 66, 51–86.
Bartelsman, E. and Doms, M. (2000). ‘Understanding productivity: lessons from longitudinal microdata’, Journal of Economic Literature, 38, 569–94.
Bernard, A.B., Jenson, J.B. and Schott, P.K. (2006). ‘Survival of the best fit: exposure to low-wage countries and the (uneven) growth of U.S. manufacturing plants’, Journal of
International Economics, 68, 219–37.
Bernard, A.B., Redding, S.J. and Schott, P.K. (2009). ‘Products and productivity’,
Scandinavian Journal of Economics,111(4), 681–709.
Bernard, A.B., Redding, S.J. and Schott, P.K. (2010). ‘Multi-product firms and product switching’, American Economic Review,100, 70–97.
Caves, R. (1998). ‘Industrial organization and new findings on the turnover and mobility of firms’, Journal of Economic Literature, XXXVI, 1947–82.
CIEM (Central Institute of Economic Management) (2003). Developing the
Socialist-Oriented Market Economy in Vietnam, Dinh Van An (ed.), Ha Noi, The Statistical
Publisher.
CIEM (Central Institute of Economic Management) (2006). Vietnam’s Economy in 2005 (A
Reference Book), The Publishing House of Political Theory, Hanoi.
Disney, R., Haskel, J. and Heden, Y. (2003). ‘Restructuring and productivity growth in UK manufacturing’, Economic Journal, 113, 666–94.
Dixit, A. (1989). ‘Entry and exit decisions under uncertainty’, Journal of Political Economy,
97(3), 205–08.
Dunne, T., Roberts, M. and Samuelson, L. (1988). ‘Patterns of firm entry and exit in the U.S. manufacturing industries’, The RAND Journal of Economics, 19(4), 495–515.
Dunne, T., Roberts, M. and Samuelson, L. (1989). ‘The growth and failure of U.S. manufacturing plants’, The Quarterly Journal of Economics, 104(4), 671–98.
Eckel, C. and Neary J.P. (2006). ‘Multi-product firms and flexible manufacturing in the global economy’, CEPR Discussion paper number DP5941.
Ericson, R. and Pakes, A. (1995). ‘Markov-perfect industry dynamics: A framework for empirical work’, Review of Economic Studies, 62, 53–82.
Eslava, M., Haltiwanger, J., Kugler, A and Kugler, M. (2004). ‘The effects of structural reform on productivity and profitability enhancing reallocation: evidence from Columbia’,
Foster, L, Haltiwanger, J. and Syverson, C. (2008). ‘Reallocation, firm turnover, and efficiency: selection on productivity or profitability?’, American Economic Review, 98(1),
394–425.
Goldberg, P., Khandelwal, A., Pavcnik, N. and Topalova, P. (2008). ‘Multi-product firms and product turnover in the developing world: evidence from India’, NBER Working Paper 14127.
Hopenhayn, H. (1992). ‘Entry, exit and firm dynamics in long run equilibrium’,
Econometrica, 60(5), 1127–50.
Hopenhayn, H. and Rogerson, R. (1992). ‘Job turnover and policy evaluation: A general equilibrium analysis’, Journal of Political Economy, 101(5), 915–38.
Jovanovic, B. (1982). ‘Selection and the evolution of industry’, Econometrica, 50(3), 649–70.
Javorcik, B. (2004). ‘Does foreign direct investment increase the productivity of domestic firms? In search of spillovers through backward linkages’, American Economic Review,
94, 605–27.
Jefferson, G.H. and Rawski, T.G. (1994). ‘Enterprise reform in Chinese industry’, Journal of
Economic Perspectives, 8(2), 47–70.
Melitz, M. (2003). ‘The impact of trade on intra-industry reallocations and aggregate industry productivity’, Econometrica, 71(6), 1695–1725.
Olley, G. and Pakes, A. (1996). ‘The dynamics of productivity in the telecommunications equipment industry’, Econometrica,64(6), 1263–97.
Pavcnik, N. (2002). ‘Trade liberalization, exit and productivity improvements: evidence from Chilean plants’, Review of Economic Studies,69, 245–76.
Roberts, M.J. and Tybout, J. (1996). Industrial Evolution in Developing Countries: Micro
Patterns of Turnover, Productivity and Market Structure, Oxford University Press,
Oxford.
Siegfried, J.J. and Evans, L.B. (1994). ‘Empirical studies of entry and exit: a survey of the evidence’, Review of Industrial Organization, 9(2), 121–55.
Stiroh, K. and Strahan, P. (2003). ‘Competitive dynamics of deregulation: evidence from US banking’, Journal of Money, Credit and Banking, 35(5), 801–28.
Tybout, J.R. (2000). ‘Manufacturing firms in developing countries: How well do they do, and why?’, Journal of Economic Literature, 38, 11–44.
Table 1: Panel attrition
Total Agriculture Manufacturing Services Sample (2-digit) Sample (4-digit)
2001 56,295 4,255 13,142 38,898 9,858 9,858 2002 62,510 4,218 14,654 43,638 11,581 11,583 2003 71,479 3,381 16,746 51,352 13,239 13,241 2004 91,139 3,510 20,341 67,288 15,739 15,750 2005 112,251 3,674 23,836 84,741 18,664 18,668 2006 129,165 3,695 26,131 99,339 21,824 21,830 2007 155,432 4,113 30,922 120,397 24,301 24,305 2008 205,396 10,779 38,269 156,348 30,867 30,869
Note: Sector allocation refers to enterprises’ main activity. Source: authors’ calculations.
Table 2: Sector diversification and dynamics Number of
4-digit sub-sectors
%
multi-product % exits % entrants
% switch (2-digit)
% switch (4-digit)
15 Food products and bev. 23 10.83 49.63 68.35 1.04 12.96
16 Tobacco products 2 19.05 42.86 33.33 2.38 57.14
17 Textiles 13 8.26 46.06 78.01 8.99 28.40
18 Wearing apparel 9 5.09 53.35 84.36 6.09 21.18
19 Tanning/dressing leather 8 7.98 48.02 74.98 10.61 29.12
20 Wood and wood
products 10 12.79 53.04 81.08 10.38 22.54
21 Paper and paper
products 3 9.10 48.15 77.67 6.49 23.90
22 Publishing, printing, etc 9 5.06 49.70 88.55 5.17 15.03
23 Coke, refined petroleum 7 7.14 55.71 82.86 11.43 27.14
24 Chemicals and chem.
prod. 11 11.47 47.92 78.59 6.13 14.81
25 Rubber and plastics 8 8.47 42.22 80.86 10.56 28.67
26 Other non-metallic mineral 15 16.77 49.64 68.97 3.71 15.72 27 Basic metals 11 16.58 44.19 81.80 11.22 35.09 28 Fabricated metals 8 10.10 48.90 86.84 8.74 26.18 29 Machinery and equipment 17 9.40 48.52 81.31 19.36 32.90 30 Office equipment 7 6.09 61.74 93.91 7.83 23.48 31 Electrical machinery 24 12.12 51.01 79.60 15.15 38.89
32 Radio, television, etc 9 7.23 51.98 82.10 10.33 29.95
33 Medical, precision and
opt. 9 7.48 47.64 80.31 13.78 23.23
34 Motor vehicles, transport 13 13.58 57.21 72.96 18.87 32.21
35 Other transport equip. 14 17.78 46.58 73.69 11.02 35.24
36 Furniture 20 9.86 52.78 82.98 12.55 25.96
37 Recycling 7 10.96 42.47 90.41 17.81 26.71
Note: Statistics are based on all enterprises operating in 2008 whose main output was in the manufacturing sector at some stage between 2001 and 2008.
Table 3: t-tests of differences in sector characteristics before and after switching
2-digit measure
Number of observations
Mean difference before and after switch t-statistic (difference = 0) P-value WTFP 4,488 0.004 1.596 0.111 lnKL 6,251 -0.032 -6.384 0.000 Size 6,251 -0.067 -8.716 0.000 CR 6,251 -0.008 -4.722 0.000 FR 6,249 0.015 4.828 0.000 SR 6,171 -0.031 -13.267 0.000 Tariff 5,207 -0.011 -5.044 0.000 Exports 5,207 0.263 17.755 0.000 4-digit measure Number of observations Mean difference before and after switch t-statistic (mean = 0) P-value WTFP 16,652 -0.156 -52.775 0.000 lnKL 22,585 -0.044 -17.683 0.000 Size 22,583 -0.042 -11.347 0.000 CR 22,473 -0.020 -14.362 0.000 FR 21,873 0.015 10.900 0.000 SR 20,620 -0.033 -24.318 0.000 Tariff 13,448 -0.009 -5.737 0.000 Exports 13,450 0.381 21.972 0.000
Table 4:Weighted productivity estimates and decomposition (manufacturing sample)
Activity 15 n Weighted Covariance Activity 17 n Weighted Covariance
2001 2,722 0.173 0.115 2001 385 0.299 0.093 2002 2,962 0.198 0.123 2002 471 0.301 0.118 2003 3,046 0.215 0.140 2003 551 0.643 0.120 2004 3,280 0.494 0.149 2004 635 0.495 0.127 2005 3,665 0.530 0.163 2005 784 0.528 0.117 2006 4,383 0.587 0.162 2006 957 0.601 0.179 2007 4,506 0.385 0.153 2007 1,058 0.373 0.124 2008 5,306 0.721 0.142 2008 1,293 0.288 0.086
Activity 18 n Weighted Covariance Activity 19 n Weighted Covariance
2001 524 0.413 0.144 2001 236 0.203 0.098 2002 766 0.487 0.172 2002 290 0.258 0.165 2003 934 0.363 0.156 2003 316 0.281 0.095 2004 1,206 0.466 0.166 2004 395 0.360 0.130 2005 1,320 0.537 0.149 2005 453 0.389 0.072 2006 1,548 0.525 0.150 2006 441 0.479 0.109 2007 1,783 0.338 0.096 2007 524 0.340 0.106 2008 2,580 0.568 0.071 2008 659 0.387 0.039
Activity 20 n Weighted Covariance Activity 21 n Weighted Covariance
2001 726 0.116 0.117 2001 431 0.106 0.074 2002 818 0.173 0.111 2002 494 0.187 0.072 2003 914 0.486 0.104 2003 596 0.241 0.074 2004 1,096 0.354 0.111 2004 689 0.210 0.087 2005 1,261 0.440 0.113 2005 871 0.261 0.089 2006 1,440 0.387 0.087 2006 960 0.185 0.077 2007 1,755 0.411 0.100 2007 1,033 0.257 0.085 2008 2,366 0.554 0.091 2008 1,301 0.598 0.062
Activity 22 n Weighted Covariance Activity 24 n Weighted Covariance
2001 335 0.249 0.136 2001 428 0.277 0.101 2002 454 0.269 0.182 2002 509 0.321 0.142 2003 580 0.581 0.190 2003 598 0.538 0.149 2004 820 0.497 0.202 2004 688 0.579 0.189 2005 1,023 0.536 0.182 2005 840 0.673 0.200 2006 1,564 0.466 0.170 2006 1,026 0.563 0.200 2007 1,457 0.310 0.182 2007 1,120 0.442 0.167 2008 1,890 0.754 0.139 2008 1,376 0.674 0.155
Activity 25 n Weighted Covariance Activity 26 n Weighted Covariance
2001 525 0.154 0.077 2001 1,051 0.679 0.672 2002 683 0.182 0.104 2002 1,069 0.336 0.257 2003 769 0.420 0.096 2003 1,122 0.476 0.232 2004 971 0.371 0.105 2004 1,282 0.547 0.206
2005 1,222 0.499 0.105 2005 1,425 0.587 0.206 2006 1,427 0.404 0.098 2006 1,479 0.558 0.182 2007 1,664 0.185 0.082 2007 1,641 0.462 0.187 2008 2,000 0.556 0.051 2008 2,004 0.667 0.178
Activity 27 n Weighted Covariance Activity 28 n Weighted Covariance
2001 142 0.180 0.139 2001 725 0.157 0.133 2002 185 0.299 0.130 2002 941 0.182 0.133 2003 223 0.329 0.115 2003 1,239 0.395 0.122 2004 267 0.363 0.096 2004 1,611 0.405 0.111 2005 351 0.408 0.082 2005 2,057 0.473 0.119 2006 388 0.331 0.093 2006 2,551 0.367 0.114 2007 510 0.363 0.111 2007 3,009 0.294 0.101 2008 634 0.090 0.079 2008 3,984 0.495 0.091
Activity 29 n Weighted Covariance Activity 31 n Weighted Covariance
2001 264 0.296 0.088 2001 167 0.179 0.087 2002 342 0.306 0.115 2002 195 0.110 0.118 2003 404 0.285 0.125 2003 238 0.530 0.123 2004 466 0.604 0.130 2004 316 0.673 0.207 2005 559 0.451 0.125 2005 372 0.335 0.130 2006 628 0.439 0.136 2006 398 0.204 0.132 2007 758 0.337 0.125 2007 385 0.251 0.110 2008 887 0.279 0.091 2008 498 0.764 0.076
Activity 32 n Weighted Covariance Activity 33 n Weighted Covariance
2001 76 0.280 0.109 2001 37 0.408 0.089 2002 101 0.299 0.213 2002 49 0.428 0.066 2003 125 0.471 0.206 2003 53 0.213 0.048 2004 151 0.378 0.246 2004 60 0.595 0.119 2005 169 0.664 0.201 2005 83 0.249 0.163 2006 187 0.578 0.150 2006 95 0.245 0.091 2007 229 0.249 0.133 2007 101 0.551 0.096 2008 299 0.395 0.227 2008 125 0.450 0.111
Activity 34 n Weighted Covariance Activity 35 n Weighted Covariance
2001 182 0.214 0.293 2001 250 0.358 0.184 2002 222 0.249 0.267 2002 298 0.303 0.175 2003 222 0.568 0.269 2003 344 0.521 0.200 2004 247 0.426 0.219 2004 363 0.529 0.207 2005 301 0.625 0.193 2005 452 0.587 0.195 2006 239 0.514 0.146 2006 452 0.483 0.179 2007 275 0.331 0.164 2007 558 0.483 0.195 2008 348 0.446 0.178 2008 618 0.914 0.141
Activity 36 n Weighted Covariance
2002 679 0.307 0.208 2003 901 0.618 0.130 2004 1,118 0.512 0.141 2005 1,373 0.515 0.123 2006 1,552 0.475 0.097 2007 1,793 0.405 0.110 2008 2,510 0.542 0.090
Note: Sectors 16, 23, 30 and 37 are excluded due to the small number of firms that operate in these sectors. Source: authors’ calculations.