IFPRI Discussion Paper 00838 December 2008
Aid Effectiveness and Capacity Development
Implications for Economic Growth in Developing Countries
Prabuddha Sanyal
Suresh Babu
INTERNATIONAL FOOD POLICY RESEARCH INSTITUTE
The International Food Policy Research Institute (IFPRI) was established in 1975. IFPRI is one of 15 agricultural research centers that receive principal funding from governments, private foundations, and international and regional organizations, most of which are members of the Consultative Group on International Agricultural Research (CGIAR).
FINANCIAL CONTRIBUTORS AND PARTNERS
IFPRI’s research, capacity strengthening, and communications work is made possible by its financial contributors and partners. IFPRI receives its principal funding from governments, private foundations, and international and regional organizations, most of which are members of the Consultative Group on International Agricultural Research (CGIAR). IFPRI gratefully acknowledges the generous unrestricted funding from Australia, Canada, China, Finland, France, Germany, India, Ireland, Italy, Japan,
Netherlands, Norway, South Africa, Sweden, Switzerland, United Kingdom, United States, and World Bank.
AUTHORS
Prabuddha Sanyal, International Food Policy Research Institute
Research Analyst, International Service for National Agricultural Research [email protected]
Suresh Babu, International Food Policy Research Institute
Senior Research Fellow, International Service for National Agricultural Research [email protected]
Notices 1
Effective January 2007, the Discussion Paper series within each division and the Director General’s Office of IFPRI were merged into one IFPRI–wide Discussion Paper series. The new series begins with number 00689, reflecting the prior publication of 688 discussion papers within the dispersed series. The earlier series are available on IFPRI’s website at www.ifpri.org/pubs/otherpubs.htm#dp.
2
IFPRI Discussion Papers contain preliminary material and research results. They have not been subject to formal external reviews managed by IFPRI’s Publications Review Committee but have been reviewed by at least one internal and/or external reviewer. They are circulated in order to stimulate discussion and critical comment.
Copyright 2008 International Food Policy Research Institute. All rights reserved. Sections of this material may be reproduced for personal and not-for-profit use without the express written permission of but with acknowledgment to IFPRI. To reproduce the material contained herein for profit or commercial use requires express written permission. To obtain permission, contact the Communications Division at [email protected].
Contents
Abstract
v
1. Introduction
1
2. Meaning and Scope of Capacity Strengthening: A Conceptual Framework
4
3. Theoretical Model of the Relationship between Capacity and Growth
9
4. Policy Exercises
19
5. Summary and Conclusion
26
Appendix
27
List of Figures
1. Capacity building: Conceptual framework 7
2. Dynamics of the growth rate of capital accumulation 13
3. Phase diagram for the dynamics of the growth rate of knowledge 15
4. Phase diagram for the dynamics of the growth rate of capital and technology 16 5. Phase diagram for the dynamics of the growth rate of capital and technology 17 6. Phase diagram for the dynamics of the growth rate of capital and knowledge 18
7. Increase in the rate of learning in the economy 20
8. Donor intervention when capacity of the economy is low 21
9. Donor intervention when capacity of the economy is high 22
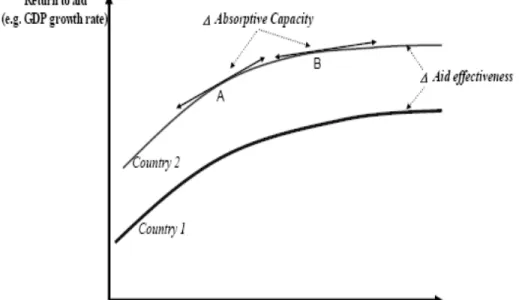
10. Aid effectiveness and absorptive capacity 23
ABSTRACT
Although adequate country capacity is considered to be one of the critical missing factors in development outcomes, a lack of understanding of how capacity contributes to economic development and of how to account for the contribution of capacity development to economic growth remains a challenge. The purpose of this paper is to provide an understanding of how capacity strengthening as an input in the development process affects economy-wide growth.
In this paper, we present a stylized model for understanding the relationship between capacity strengthening and economic growth in an endogenous growth framework. Endogenous growth theory provides a starting point for combining individual, organizational, and enabling environmental issues as part of attaining the capacity-strengthening goal. Our results indicate that although donors can play an important role in aiding countries to develop their existing capacities or to generate new ones, under certain conditions, the potential also exists for uncoordinated and fragmented donor activities to erode country capacities.
From the policy exercises, we demonstrate that improving economy-wide learning
unambiguously increases the rate of growth of output, technology, capital stock, and capacity. Moreover, a donor’s intervention has the maximum impact on the above variables when the economy’s capacity is relatively low. In contrast, donor intervention can lead to “crowding-out effects” when the economy’s capacity is moderately high. Under such a situation, the economy never reaches a new steady state. Our results not only lend support to diminishing returns to aid but also to an S model of development aid and country capacity relationship.
1. INTRODUCTION
Although the concept of capacity strengthening has regained renewed interest among international development practitioners, adequate national capacity remains a critical factor in the current efforts to meet the Millennium Development Goals (MDGs). Yet even with increased funding, development efforts will not be able to achieve their goals if attaining sustainable capacity is not given greater and more careful attention (Organization for Economic Cooperation and Development [OECD] 2006). The issue is increasingly being recognized by both donor organizations and developing countries, as emphasized in the 2005 Paris Declaration on Aid Effectiveness and Accra High Level Forum on Aid Effectiveness held in Accra, Ghana during 2008(OECD 2006).1
Capacity strengthening remains a major challenge for many developing countries. At first, it was primarily viewed as a technical assistance process, involving the transfer of knowledge or organizational models from north to south (Berg 1993). Technical cooperation and various forms of
capacity-strengthening activities have absorbed substantial funds over many decades. Although a few countries have used such funds effectively, donor efforts in many countries have produced little or even negative results in terms of sustainable local capacity. This is particularly relevant for many African economies, where, after investments of millions of dollars to improve the capacity of African governments, donors have begun to question the merits of their policies in building capacity via technical assistance (Fukuda-Parr 2003). Simultaneously, evidence suggests that development aid is highly uncoordinated and
fragmented (Dethier 2008). With 56 bilateral donors and more than 230 international organizations, there are currently about 60,000 development aid projects. The average number of donors per country almost tripled during the past 50 years (from 12 in the 1960s to 33 in recent years). The proliferation of the number of donors has created chaos in donor practices and has led to inefficient aid-delivery mechanisms (World Bank 2007). In addition, after several decades of economic crises, developing country
governments have adopted wide-ranging reform programs, often on the advice of multilateral institutions. The lack of country capacity to implement these programs, however, has been alluded to as a major factor behind the failure of the reform programs (World Bank 2005). Finally, it is now well accepted that solutions imposed unilaterally by donor agencies from outside the country cannot address the problems and concerns of many developing country governments. Thus, national governments must be willing to take “ownership” of their programs and control forces that affect the economy and polity (Wubneh 2003).
The new consensus, as expressed in the 2005 Paris Declaration on Aid Effectiveness, sees capacity strengthening as an endogenous process, strongly led from within a country, with donors playing only a supportive role. According to this idea, capacity strengthening involves much more than enhancing the skills and knowledge of individuals. Rather, it critically depends on the quality of the organizations in which individuals work. In turn, the effectiveness of those organizations is influenced by the “enabling environment” in which they are embedded. Capacity, in this view, is not only about skills and procedures, but also about incentives, organizational effectiveness, and governance. Yet, it is not clear how combining individual skills, organizational restructuring, and an enabling environment could be enhanced through an endogenous process.
Over the past two decades, several studies have used different approaches to examine the role of aid effectiveness and its implications on economic growth and other transmission mechanisms (Dethier 2008). First, macroeconometric studies have attempted to examine the role of development aid on growth and structural transformation using cross-country regressions, leading to inconclusive results (Burnside and Dollar 2000; Clemens, Radelet, and Bhavnani 2004; Easterly, Levine, and Roodman 2004; Hansen
1
This declaration rests on five pillars: (1) ownership—developing countries exercise leadership over their development policies and plans; (2) alignment—donors base their support on countries’ development strategies and systems; (3) harmonization—donors coordinate their activities and minimize the cost of delivering aid; (4) managing for results—donors and developing countries orient their activities to achieve the desired results; and (5) mutual accountability—donors and developing countries are accountable to each other for progress in managing aid better and in achieving development results.
and Tarp 2000; Rajan and Subramanian 2005; Roodman 2007).2 Second, microeconometric literature using both impact evaluation methods and randomized evaluation methods demonstrated whether aid is effective (Heckman and Smith 1995; Behrman and Hoddinott 2002; Schultz 2004). The microeconomic studies examined the average impact of a policy or program on a group of individuals by comparing them with a similar group of individuals who were not exposed to the program (Hoddinott and Skoufias 2004). Although randomization is a useful tool for assessing policies and programs, the main problem is
replication across different settings (Ravallion 2005).
Despite these soul-searching processes about aid effectiveness and its implications for country capacity from both the academic and the donor circles, the severity of the problem persists in many Sub-Saharan African countries due to a number of contradictions3 arising out of the behavior of both donors and recipients (Berg 2002). First, while more attention has focused on how aid affects economic growth, less attention has been paid to the issue of how aid has unintended negative consequences on country capacity. Second, technical assistance has been mainly donor driven, without allowing local agencies to choose and design projects and programs on their own. Third, although learning is increasingly
recognized as being central to the development process, knowledge sharing has been virtually absent in aid agencies and countries. The major impediments to on-the-job learning among host country officials and on overall administrative systems can be attributed to the donor’s narrowly defined project objectives, ambitious targets, inadequate understanding of broad policy and sector issues, and poor knowledge of the specific country environment (World Bank 1998b). Finally, in regard to ownership and participation, serious reforms are required to address the disparity in capacity between donors and recipient countries. The change to a more country-owned process is not trivial and requires that the government “owns” its strategy and that the donors “own” their independent assessments of the strategy and resulting aid allocations, with the two being notionally distinct (Rogerson, Hewitt, and Waldenburg 2004). As identified by the OECD’s Development Assistance Committee (DAC) report (2007), the principle of country ownership is about genuine collective ownership by society as whole, with political institutions at the subnational level (parliaments, civil society organizations, and the wider public) being important drivers of change. Genuine ownership requires a legal and institutional framework that ensures poor and marginalized sections of the population will be engaged in decision-making processes and can hold their governments accountable. However, at times, donors do try to use indigenous monitoring and evaluation (M&E) systems to monitor performance (e.g., against the MDGs) rather than have wholly independent assessments.
In light of the above, several questions remain: What is the optimal level of country capacity strengthening required to achieve specific economic growth targets? What conceptual approaches could help us understand the relationship between national capacity and economic growth? Under what
conditions does donor intervention improve or displace country capacity? Currently, little attention is paid to these questions in the economic development literature.
The purpose of this paper is to provide an understanding of how capacity strengthening as an input or process affects economywide growth.4 We present a stylized model for understanding the relationship between capacity strengthening and economic growth in an endogenous growth framework. The motivation is that the development literature lacks a theoretical framework for addressing capacity development issues. Currently, most studies treat human capital as individual skills. At the same time, the literature treats the organizational culture, institutional arrangements, and political processes under which
2
The Burnside and Dollar (2000) position is that aid works only when domestic policies and institutions are receptive, whereas Hansen and Tarp (2000) have found no relationship between aid and growth.
3
Van de Walle (1999, pp. 339) noted, “In most countries of the African region, the aid business is typically the second biggest employer in the local economy, surpassed only by government.” The contradictions are severe agency problems, such as moral hazard, highly asymmetrical power relations between donors and recipients, coordination failures, and inadequate attention paid to local circumstances.
4
We distinguish between capacity strengthening as an input in economic growth outcomes from capacity strengthening as the final output / outcome measure of development, restricting our attention only to the former. Although for monitoring and evaluation purposes, the latter may be more relevant, we focus on the former so we can better understand the relationship between capacity input and economic growth.
capacity strengthening operates as exogenous. Endogenous growth theory provides a starting point for combining individual skills, organizational effectiveness, and enabling environment issues as part of attaining the capacity strengthening goal.
The rest of this paper is organized as follows: In the next section, we define capacity
strengthening and emphasize its importance in development outcomes. We also provide a conceptual framework of the capacity-strengthening process and how it affects outcomes, such as higher economic growth. In Section 3, we postulate an endogenous growth model to understand how the relationship between own-country capacity resources and donor-supported capacity resources affects economic growth. We derive the relationship between growth rate of capital accumulation and growth rate of capacity, as well as the relationship between growth rate of technology and growth rate of capacity, and we examine the conditions under which a steady-state rate of capacity maintains or grows over time. We also derive the critical values that own-country capacity resources and donor-supported resources should satisfy in order for the steady-state solution to exist. In Section 4, we undertake some comparative static exercises and derive some implications of the results. First, the results indicate that an increase in learning capabilities of the host country unambiguously increases the rate of growth of output, technology, and capacity. Second, a donor’s capacity resources have significant effect on growth in places where the elasticity of output with respect to capacity resources is low to begin with. However, if the country’s capacity is moderately high to begin with, additional introduction of projects and programs by donors can lead to excessive complexity and dual salary structures—undermining country capacity and adversely affecting economic growth. Thus, our results not only lend support to the hypothesis of diminishing returns to aid but also to an S model of the relationship between development aid and country capacity.
2. MEANING AND SCOPE OF CAPACITY STRENGTHENING:
A CONCEPTUAL FRAMEWORK
Why Focus on Capacity Strengthening?
Increased interest in capacity strengthening in recent years is a response to widely acknowledged
shortcomings in development assistance over the past 50 years. For example, the dominant role of donor-led development projects with inadequate attention paid to long-term capacity issues is often cited as a critical factor in the slow progress (Canadian International Development Agency [CIDA] 2000). The 2005 Paris Declaration on Aid Effectiveness emphasizes the need for significantly enhanced support for country efforts to strengthen capacity and improve development outcomes. The declarationcalls for capacity strengthening to be an explicit objective of national development and poverty reduction
strategies. In Africa, for example, the New Partnership for Africa’s Development (NEPAD) has identified capacity constraints as the main obstacle to economic growth and sustainable development. Although a quarter of donor aid, or more than US$15 billion a year, has gone into “technical cooperation,”5
evaluation results confirm that development of sustainable capacity remains one of the most difficult areas of international development practice. Capacity strengthening has also been one of the
least-responsive targets of donor assistance, lagging behind other slow areas such as infrastructure development or improving health (OECD 2006).
The motivation behind this study arises from the contrast between the increasingly recognized importance of capacity in development outcomes and the difficulty of achieving it. Several broad
strategies can be followed, either separately or in combination, to strengthen capacity (Morgan 1998). If a simple deficiency in resources is the root cause of weak capacity, then supplying additional financial and physical resources will be beneficial. One variant of this method would be to assist in improving
organizational capabilities so they perform better in terms of obtaining its objectives. This may require providing technical assistance or training, assuming the gaps are identified to achieve better performance. A related strategy proposes promoting innovations and providing opportunities for learning and
experimentation. Much of this strategy focuses on the promotion of social capital, including collaboration, civic engagement, and loyalty. These approaches aim to encourage individuals and organizations to work better together in order to promote a holistic view of development.
Strengthening the overall organizational system for work synchronization and execution of complex tasks can enhance preexisting systems to carry out certain key functions (Morgan 2005). In this approach, organizations are seen as processing systems that change individual and system capacities into organizational results. This approach seeks to improve an organization’s overall performance by breaking down its activities, making recommendations about improvements, and then integrating these
improvements back into wider organizational performance. The role of institutions is to provide
knowledge of and access to “the rules of the game,” thus empowering certain actors to create, alter, and learn from the processes and rules that govern society. However, equating institution building with public sector reforms can be problematic, and reform of entire systems or sectors, such as agriculture, education, and health, is important for capacity strengthening (Gunnarson 2001).
The systems approach focuses more on transformation change and the best ways to achieve it. In this approach, capacity arises out of interrelationships and interactions among the system’s various elements (Morgan 2005). An all-inclusive strategy for capacity strengthening should be targeted at
multiple levels and actors, and it should include an attempt to understand the linkages among them. In this approach, capacity strengthening is a dynamic process whereby complex networks of actors seek to enhance their performance by doing what they do better, both by their own initiatives and through
5
Estimates of donor-assisted capacity development efforts suggest that more than a quarter of total net official development assistance is spent on technical cooperation. In 2004, the total amount spent by DAC members on technical cooperation with developing countries and multilateral organizations amounted to US$20.8 billion (OECD, DAC, Development Co-operation Report, 2006
interactions with outsiders (Choritz 2002). From this perspective, capacity strengthening is achieved through combining individual and collective abilities into a larger overall systems capacity.
What is Capacity Strengthening, and Why is it Important for Economic Development?
There are various definitions of capacity in the literature. For example, Berg (1993) regarded capacity strengthening as being characterized by three main activities: skill upgrading, both general and job specific; procedural improvements; and organizational strengthening. He concluded that capacity strengthening is broader than organizational development, in that it includes all types of skill enhancement and procedural reforms, which extend beyond the boundaries of a single organization.
Grindle and Hilderbrand (1995) argued that both internal and external factors influence the capacity of institutions or governments to provide basic services. The internal factors include resources, management, information systems, and finance, whereas the external factors relate to policies,
management practices, and formal and informal relationships. The focus of this definition is more on the organizational aspects of capacity.
According to Morgan (1998), capacity strengthening is a wider and holistic concept, with a close relationship between human resource development and capacity development. He contends that for capacity strengthening to be effective, it must move beyond administrative techniques so that it can be sustainable over a longer period. Thus, capacity strengthening becomes a more complex concept than specific capacity inputs. In this definition, capacity strengthening refers to the approaches, strategies, and methodologies used by national actors and/or outside interveners to help organizations and systems improve their performance.
In this paper, capacity strengthening is defined as the process of developing human resources, creating new forms of organizations and institutions, building innovative networks, and integrating country ownership in order to improve the efficiency of the learning activities (i.e., technical, organizational, institutional, and policy learning). The efficiency of these learning activities, in turn, depends on the economic and political systems, as well as on the social infrastructure and institutions. The improvement in learning activities results in better knowledge about policy processes and program
development, leading to better development outcomes. Our definition is based on two observations: (1) Country ownership is critical to development performance, and this applies to both generic capacities (such as the ability to plan and manage organizational changes and service improvements) and specific capacities in critical fields (such as health or public sector management). (2) Country ownership of policies and programs is the means to sustained development effectiveness. Ownership will not begin to emerge in the absence of sufficient local capacity (Fukuyama 2004).
Levels of Analysis
The concept of capacity strengthening and its effect on development outcomes can be understood by examining its four most important components in the context of an enabling political and economic environment, as discussed herein.
Restructuring the Value Systems. Restructuring the value systems refers to reorienting the knowledge of the decision makers so that more emphasis is given to scientific analysis and skills. The decision maker’s improved knowledge of policies and programs based on strong scientific findings will serve as an important conduit for valuable policy decisions (Wubneh 2003).
This component also emphasizes that country “ownership” needs to be treated as a process. The interactions among donors and domestic decision makers can generate either vicious or virtuous cycles of change in regard to ownership of capacity-strengthening efforts. A vicious cycle develops when donors assume leadership of a country’s policies and programs, perceiving bad results as reflecting weak capacity of the recipient country. Under such a situation, the presence of large development aid makes it difficult for the host (recipient) government to define national strategies. The local technocrats and officials know that what matters is what donors want, and thus the easiest path is to follow the advice of
the donors. In addition, higher salaries offered by donor agencies create dual salary structures and demoralizes civil services (Berg 2000). Incentives get distorted and performance of organizations in the recipient country deteriorates further from a sense of disengagement, resulting in further deterioration of country capacity.
In contrast, a virtuous circle emerges if the donor notices that the recipient is becoming serious in developing new programs and taking a lead. By encouraging country assertiveness to turn into a self-reinforcing process of empowerment, the donor can help in the recipient country’s capacity-strengthening initiatives. Over time this can lead to better development outcomes (Kpundeh and Levy 2004).
Program-based approaches (PBAs) need to incorporate the presence of vicious and virtuous cycles in aid delivery and aid relationships (Lavergne and Alba 2003). However, when certain basic conditions are met, these approaches can contribute to a process in which policy ownership is progressively built, leading to strengthening of country leadership. In contrast, piecemeal donor approaches can lead to an erosion of country capacity over time.
Developing Human Capacity at the Individual Level. Enhancing the supply of professional and technical personnel remains a key component in any capacity-strengthening initiative. However, focusing only on the spread of education and on the buildup of professional skills and knowledge is not sufficient in improving capacity, because overall system capacity constraints may come into play. Other important activities of this strategy involve capacity enhancement (absorptive capacity)
through the transfer of new ideas, techniques, and systems. New investments in training capacity, such as promoting national training organizations (both public and private), and in the institutional conditions for them to function efficiently can be important in improving performance (OECD 2006).
Donors can also play an important role in improving country capacity by focusing on demand-driven approaches that take context into account and that link the focus and design of training to an organization’s capacity-strengthening strategies. This focus essentially involves approaching capacity strengthening in an integrated manner, with individual skills and the organizational setting being created simultaneously in order to improve performance outcomes (Lopes and Theisohn 2003).
Transforming Institutional Capacity. The major objective of this strategy is in building new institutions and restoring existing ones. In the past few decades, inspired by institutional economists, clearer
distinctions have been made between institutions and organizations. For example, North (1994) defined institutions as the “formal and informal rules of the game.” Transforming institutional capacity involves changing practices and procedures in order to encourage effective utilization of resources. Because institution building involves a variety of goals, they are important to overcoming underdevelopment. One of these goals is improving public sector institutions, such as the legal systems, civil services, policy regimes, and other rules that govern the interaction between the public and private sector. To improve development outcomes, capacity strengthening requires knowledge of the “rules of the game.” For example, laws need to be changed to ensure equity among various groups.
Donors can play an important role in improving development outcomes by emphasizing bottom-up participatory processes through both social and financial intermediation sbottom-upport organizations that act as effective links or bridges between civil society and other institutions, such as government agencies. The most prominent category of support organizations during the past two decades is the
nongovernmental organization (NGO).6
The literature has emphasized advantages of improving capacity through local NGOs (Carroll 1992; Brown and Kalegaonkar 2002). Local NGOs—with their wide gamut of field experience, familiarity with local and regional conditions, better understanding of local needs, and knowledge of successful, low-cost methods—can improve development effectiveness. These organizations can also build on the institutional capacity, because they have ties up and down the ladder of interaction. These
6 International Civil Society Organizations (CSO) Steering Group Paper (2007) position paper for the Accra High Level
Forum for Aid Effectiveness held in Ghana, September 2008, emphasized the role of civil society organizations in addressing ownership, effective aid delivery, tied aid, and conditionality in the aid architecture and aid effectiveness agenda.
ties include contacts with grassroot groups at the local level as well as with individuals at the big donor agencies. In addition, NGOs play various intermediary roles in their collaboration with local groups. Regular upkeep and maintenance, as well as providing an infrastructure for development, can serve as capacity-strengthening goals, which are fundamental to developing social capital and relationships among international funding agencies, national NGOs, and local organizations.
Many NGOs have limited expertise, however, especially in financial and management areas. In addition, many NGOs work in isolation or with little communication with other NGOs. For development processes to work successfully, policymakers and donor groups should work to facilitate their activities and nurture their development. Thus, capacity building in NGOs should emphasize both top-down and bottom-up efforts.
Modifying Organizational Structure. The organizational structure of public sector institutions plays a critical role in effective capacity-strengthening initiatives. Improving organizational structure
involves developing a nation’s or institution’s human capacity through better recruitment and retention practices, effective utilization of personnel, enhancement of incentive systems, and decentralization of the decision-making process.
The main challenge remains in defining organizational performance. Whereas most official programs use measures of performance as proxies for capacities, NGOs have used a “systems” approach that avoids objectives at the outset (Watson 2006). In assessing organizational performance of NGOs, quantitative indicators need to be supplemented with qualitative assessments in monitoring and evaluating performance outcomes. Monitoring capacity development outcomes should be integrated within a
national monitoring system, even if this entails some form of loss in terms of quality or timeliness (OECD 2006).
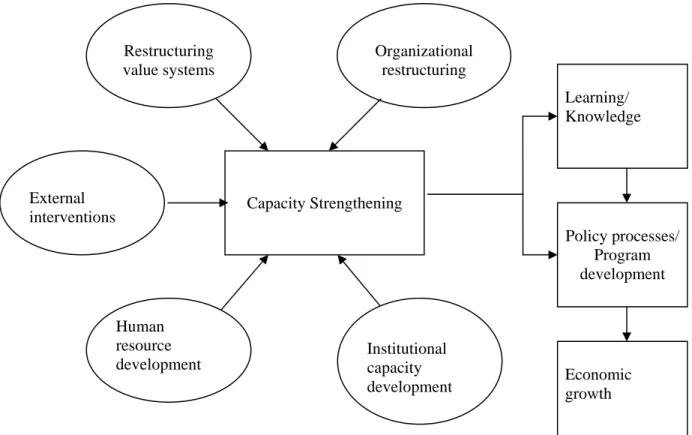
Figure 1. Capacity building: Conceptual framework
Source: Modified from Wubneh 2003
Capacity Strengthening Restructuring value systems Organizational restructuring Human resource development Institutional capacity development External interventions Learning/ Knowledge Policy processes/ Program development Economic growth
The Context of Country’s Economic and Political Environment. In the context of designing effective programs, many donor agencies are devoting more time and attention to country political economy studies. These studies can improve the operational work undertaken by donors, as it provides sufficient details of the political and economic systems, the incentive structure, and the forms of governance in developing and transition countries (Department for International Development [DFID] 2003).
The rationale for understanding a country’s economic and political environment is to think systematically about how change occurs, the power relationships among various stakeholders, and the structural and institutional factors that are behind the often-observed “lack of political will” in developing countries. First, it is important to incorporate a good political-economic environment analysis to
understand both the legacies of history and tradition and the leadership challenges that those legacies pose. For example, formal institutions that are not rooted in local culture generally fail to command society’s loyalty or to trigger local ownership (Dia 1996). Second, to the extent that donors are at the driver seat in all decision making (leading to weak accountability of the recipient), the current practices of aid will also affect the demand for capacity development in the country. Thus, addressing important questions such as “What might work here?” can improve development effectiveness implemented by donor agencies. An appreciation of the political-economic context may remind us why simple fixes or massive injections of aid may have negligible impact on capacity strengthening. The deterioration in policy processes and programs can adversely affect an economy’s learning processes / knowledge capacity, leading to negative consequences on development outcomes.
As depicted in Figure 1, priorities given by national governments to policies aiming at human resource development, such as creating new forms of organization, building innovative networks, developing better institutional structures, as part of country ownership lead to greater capacity and improve the learning processes of the various actors. The different kinds of learning, such as technical, organizational, and institutional, lead to better policy processes and programs. These programs can take various forms,7 depending on the country context. In any case, active learning through individuals and organizations can lead to more efficient learning activities and depends critically on the
political-economic environment and institutions. Thus, improving on development outcomes requires a continuous learning economy.
7
Gregersen and Johnson (2001) emphasized that policy learning—such as developing new methods for evaluating the outcomes of experiments related to learning effects, developing new forms of democratic participation in the design and
implementation of design strategies, and establishing new forms of collaboration at the regional and local levels—can form better visions about sustainable development.
3. THEORETICAL MODEL OF THE RELATIONSHIP BETWEEN
CAPACITY AND GROWTH
This section presents a theoretical model for understanding the relationship between capacity investments and growth outcomes. The model extends the framework developed by Romer (1996) and further
extended by Chen and Kee (2005).
For our purposes, let the economy comprise two sectors: a goods-producing sector and a research and development (R&D) sector. The former produces conventional output, while the latter produces new technology, which adds to the existing level of technology. Four factors of production in the economy— namely, capital (K), labor (L), human capital (H), and capacity resources (CK)8—are allocated for use in either the goods or the R&D sector. The capacity resources can be conceived of not only as sectoral programs allocated by the government for health, water and sanitation, and irrigation development (to name a few) but also as improved learning that occurs from interactions among the system of actors (firms, organizations, government, consumers, etc.) that influence an economy’s innovation performance. Capacity resource devoted to program development is a process through which values and resources are authoritatively allocated for the economy as a whole. It is a process whereby a representative government puts forward measures to accomplish some desired objectives. This process generally involves
expenditure of resources—whether in terms of extractive, distributive, or other measures. In this paper, we let
K
denote the fraction of capital stock used in the R&D sector H
denote the fraction of human capital used in the R&D sector L
denote the fraction of labor used in the R&D sector CK
denote the fraction of capacity resources used in the R&D sectorAt this point, it is not important to know how
CK is allocated (although in a more dynamic setting, how
CK is allocated can have important implications for economic growth).9
This implies the following:
(1 –
K) is the fraction of capital stock used in the goods-producing sector (1 –
H) is the fraction of human capital used in the goods-producing sector (1 –
L) is the fraction of labor used in the goods-producing sector(1 –
CK) is the fraction of capacity resources used in the goods-producing sector8
Capacity strengthening can also be understood from a production function perspective, in which overall capacity is produced as a function of individual, organizational, and enabling environment. Although this approach can provide some additional insights into the dynamics of capacity formation, we do not consider this approach in the present paper, as our main purpose is to understand how capacity is related to economic growth and under what conditions capacity leads to higher steady-state growth.
9
To the best of our knowledge, the literature has not explicitly considered who allocates capacity resources. This person or entity can be the social planner or even the donor. Feng, Kugler, and Zak (1999) provided the only model that identifies ways in which policymakers can influence the trajectory of their economies. This mechanism works mainly through choices regarding family size and investment in children. In this model, developing countries that have high levels of political capacity, that protect civil liberties, and that have low levels of political instability are most likely to develop successfully. The political factors influence development outcomes through demographic transition to a low birth rate and the incentives to invest in physical capital.
Technology has the characteristic of being nonrival. Hence, the entire level of technology (A) is used in both sectors.
Output in time t is given by
1
[(1
)
] [(1
)
] [(1
)
] [
(1
) ]
t K t H t CK t t L t
Y
K
H
CK
A
L
(1)with 0 < α < 1, 0 < β < 1, 0 < γ < 1, α + β + γ < 1.
We assume the Cobb-Douglas technology for analytical tractability. The level of innovation in the economy depends not only on the amount of capital, labor, and human capital devoted to the R&D sector but also on the capacity resources necessary to maintain and upgrade the current level of
technology.10 We assume a generalized Cobb-Douglas production function with increasing returns for the R&D sector.
.
(
) (
a) (
b) (
c)
d t K t H t CK t L t tA
B
K
H
CK
L
A
, with B, a, b, c, d, σ > 0 (2) The savings rate is exogenous and constant, and depreciation is assumed to be 0 for simplicity. This implies that.
t t
K sY , with 0 ≤s≤ 1 (3)
We treat population growth and human capital growth to be constant and exogenous, so that
. . t t t t L nL H mH ,with n, m≥ 0 (4)
The equation for motion of capacity strengthening is given by
.
t t t t
CK H CK Y , with λ,
> 0 (5) The rationale for equation (5) is derived from Glaeser, Laibson, and Sacerdote (2002), in which an individual capital investment model is used to study social capital formation. Capacity formation takes long periods, with λ denoting the learning aspects of capacity through formal education, job training, and nonformal education, while
11 denotes a parameter that captures how capacity resources devoted by an external agent (e.g., a donor agency) are utilized by the host country government for improving country capacity over time.12 We make this crucial distinction between domestic and external capacity resources, because capacity strengthening can be understood as individuals, organizations, and institutions trying to
10
For example, if a significant number of scientists and engineers move out of the country for better job prospects, then capacity resources invested in the country can erode over time, and the level of innovations may decline.
11
The implicit assumption made here is that aid is absorbed and spent by the recipient. In this case, the foreign exchange is sold by the central bank and absorbed into the economy, and the government spends the associated resources. The challenge faced by monetary authorities is to manage the real exchange rate that may result. This assumption is reasonable, unless Dutch disease is a major concern or the return to public expenditure is extremely low (Nkusu 2004).
12
We treat as exogenous to the host country’s decision to invest in capacity resources. However, in a more realistic setting, where the government seeks to maximize a utility function that depends on capital expenditures, the government’s recurrent expenditure, tax and nontax revenues, and various kinds of aid (e.g., project aid, program aid from all donors, technical assistance, and food aid subject to the government’s budget constraints), will depend on the above factors and will be endogenous (see, e.g., Mavrotas 2003). It will also depend on the country’s balance of payments situation. We assume away such complexities from the present model, because our main focus is to understand the relationship between capacity resources and economic growth.
improve capacity without external intervention. However, under the donor mandate, capacity can also be formed over time by utilizing program aid and technical assistance.
Steady-State Condition for Capital Accumulation
To derive the steady-state condition for capital (K) accumulation, we first substitute (1) into (3) to get
. 1 1 1 1
[(1
) ] [(1
) ] [(1
)
] [ (1
) ]
= (1
) (1
) (1
) (1
)
t K t H t CK t t L t K H CK L t t t t tK
s
K
H
CK
A
L
s
K H CK A
L
(6) Let C1 =s
(1
K) (1
H) (1
CK)
; then the growth of capital stock is given by. 1 1 t t t t t Kt t t t t
H
CK
A L
K
g
C
K
K
K
K
Taking logs on both sides and then differentiating with respect to time, we get
. (ln ) ( ) ( ) (1 )( ) Kt Kt Kt CK t kt At Kt g g m g g g g n g t
(7)At the steady state,
.
Kt
g = 0, and thus rearranging terms we get
*
1
* *(
)
1
1
1
K A CKg
m
g
n
g
(8)Equation (8) shows that accounting for capacity as an input into the production function, the steady-state rate of capital stock depends not only on the exogenous growth of human capital and labor force, but also on the growth rate of capacity resources. Thus, depending on the growth rate of capacity (whether it is positive or negative), the steady-state growth rate of the output will also be affected.
Steady-State Condition for Technological Growth
To derive the steady-state condition for technological growth (A), let
g
Atbe the growth rate of At. Hence. 1 a b c d a b c d t At K H CK L t t t t t t A g B K H CK L A A
Taking logs of this expression and differentiating with respect to time, we get
.
(ln
)
(
1)
At At Kt CKt Atg
g
ag
bm cg
dn
g
t
For the steady-state condition, we set
.
At
g
= 0. Upon rearranging, we obtain* * * (1 ) K CK A ag bm cg dn g
(9)From equation (9), it is evident that the growth rate of technology depends on the growth rate of capacity. Thus, endogenizing capacity resources have implications for the steady-state rate of growth of output. We will need to assume 0 ≤
≤ 1 for the existence of the steady state.Steady-State Condition for Growth Rate of Capacity
We now look at the steady-state growth rate of capacity from equation (5), as this will be the critical variable necessary for the steady-state solution to exist. Let
g
CK be the growth rate of capacity resources, defined as.
CK
CK . The steady-state condition for the growth rate of capacity must satisfy the following
equation: * * 1 * ( ) 2 2 2 C K K A g m g g n (10)
Equation (10) — the critical equation of the model, states that the growth rate of capacity depends not only on the growth rate of capital stock and technology, but also on human capital formation and its related learning, as given by the first expression on the right side of equation (10). We can thus state the first proposition of this model:
Proposition 1: For the steady-state rate of capacity to maintain or grow over time, there exists a
*
satisfying (2 –
) >
, such that if
>
*
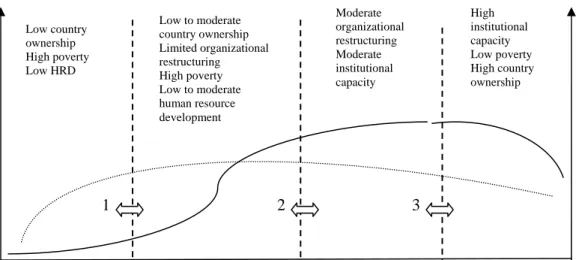
, then the economy’s capacity declines, thus affecting the economy’s steady-state rate of growth in the long run.The intuition of Proposition 1 can be understood in the following context: Suppose the economy’s capacity is really low, in that it lacks financial, human capital, and technical resources. In this case, donors can play an important role in aiding countries develop their existing capacities by providing aid, such as program aid and technical assistance. The host/recipient country can use the aid to invest in material resources, infrastructure, and human capital resources, such as education and health services. Suppose, on the other hand, that the recipient country has an existing capacity that is moderately high, but donors still try to control the projects (more project aid) until completion. As the wages and salaries in these projects are paid by donors at much higher rates than what the recipient government can afford, this process can possibly lead to “brain drain” away from the public services. If the country is in the midst of a prolonged adverse external shock, the recipient country may be forced to reduce its expenditures further. The combination of growing costs and diminished budgets can result in a gradual erosion of the recipient country’s ability to meet its basic recurrent expenditures. Aid dependence then becomes a strategy for donors to keep projects alive so the recipient government’s recurrent costs are sustained. However, through the control of projects and programs, the donors erode the country’s capacity even further.
We next look at the relationships between the growth rate of capital stock and the growth rate of capacity and between the growth rate of technology and the growth rate of capacity at the steady state.
Relationship between the Growth Rate of Capital Accumulation and the Growth Rate of Capacity
We now investigate the relationship between growth rate of capital accumulation and the growth rate of capacity in order to understand the dynamics of the growth rate of capital stock. Substituting equation (10) into equation (8) and simplifying, we obtain,
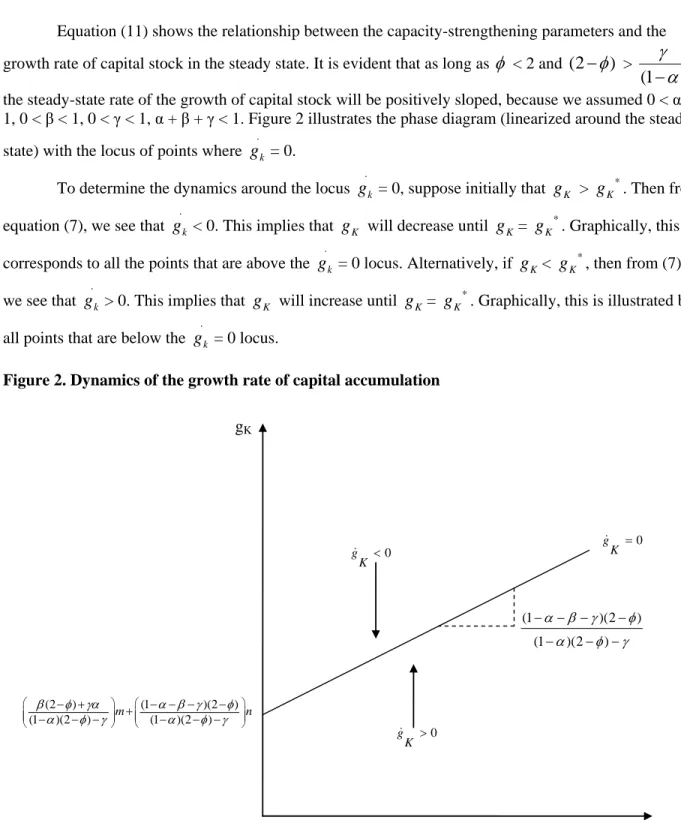
* ( 2 ) (1 ) ( 2 ) * ( ) (1 ) ( 2 ) (1 ) ( 2 ) K A g m g n (11)
Equation (11) shows the relationship between the capacity-strengthening parameters and the
growth rate of capital stock in the steady state. It is evident that as long as
< 2 and(2
)
>(1
)
,the steady-state rate of the growth of capital stock will be positively sloped, because we assumed 0 < α < 1, 0 < β < 1, 0 < γ < 1, α + β + γ < 1. Figure 2 illustrates the phase diagram (linearized around the steady state) with the locus of points where
.
k
g
= 0. To determine the dynamics around the locus.
k
g = 0, suppose initially that
g
K >g
K*. Then from equation (7), we see that.
k
g < 0. This implies that
g
K will decrease untilg
K=g
K*. Graphically, this corresponds to all the points that are above the.
k
g = 0 locus. Alternatively, if
g
K<g
K*, then from (7), we see that.
k
g > 0. This implies that
g
K will increase untilg
K=g
K*. Graphically, this is illustrated by all points that are below the.
k
g = 0 locus.
Figure 2. Dynamics of the growth rate of capital accumulation
gA gK (2 ) (1 )(2 ) (1 )(2 ) m (1 )(2 ) n (1 )(2 ) (1 )(2 ) 0 g K 0 g K gK 0
Proposition 2: There exist critical values *and * such that if (2)>
(1 )
is satisfied, then the
economy’s steady-state growth rate of capital stock unambiguously increases, improving the economy’s growth rate in the long run.
Proposition 2 states that as long as the elasticity of output with respect to capacity-strengthening resources does not come in conflict with the recipient country’s utilization of aid resources,13 then the rate of growth of capital stock will improve in the long run. For example, suppose in the first case that = 0.1 and
= 0.3, so that the ratio(1 )
= 0.14. In this circumstance, it may be worthwhile for the donor
to invest heavily in the country’s resources to improve the country’s human and organizational capacity. On the other hand, let us consider a second case, in which the elasticity of output with respect to a
country’s capacity resources is already quite high (
= 0.4). In this case, the ratio(1
)
= 0.57. Undersuch a situation, if the donor coordinates its resources so that the projects fit in with the recipient country’s policies and objectives, then effective development can be achieved.
Relationship between the Growth Rate of Technology and the Growth Rate of Capacity
We now look at the relationship between the growth rate of technology and the growth rate of capacity in order to understand the dynamics of the growth rate of technology at the steady state. Substituting equation (10) into (9) and simplifying, we obtain
* (1 )( 2 ) (1 )( 2 ) ( ) * (1 )( 2 ) (1 ) (1 )( 2 ) (1 ) A K a c b c g g m c c (1 ) ( 2 ) (1 ) ( 2 ) (1 ) c d n c (12)
Equation (12) shows the growth rate of technology in the steady state. It is evident that this rate increases in human capital, provided the following necessary conditions hold:
< 1 and (2
) >
.To see the dynamics around the locus of
.
A
g = 0, suppose initially that
g
A>g
A*
. Then from (9),.
A
g < 0. This implies that
g
A will decrease untilg
A=g
A*
. Graphically, this will correspond to all the points that are to the right of the.
A
g = 0 locus, and these points will have a tendency to converge leftward to the
.
A
g = 0 locus. Alternatively, if
g
A <g
A*
, then again from (9), we see that.
A
g > 0. This implies that
g
A will increase untilg
A =g
A*
. Graphically, this will correspond to all the points that are to the left of the.
A
g = 0 locus.
13 For example, if the recipient government plans to obtain more project aid and food inflows, this can reduce public
investment and government consumption. If the reduction in public investment outweighs the decline in government consumption, growth rates can fall.
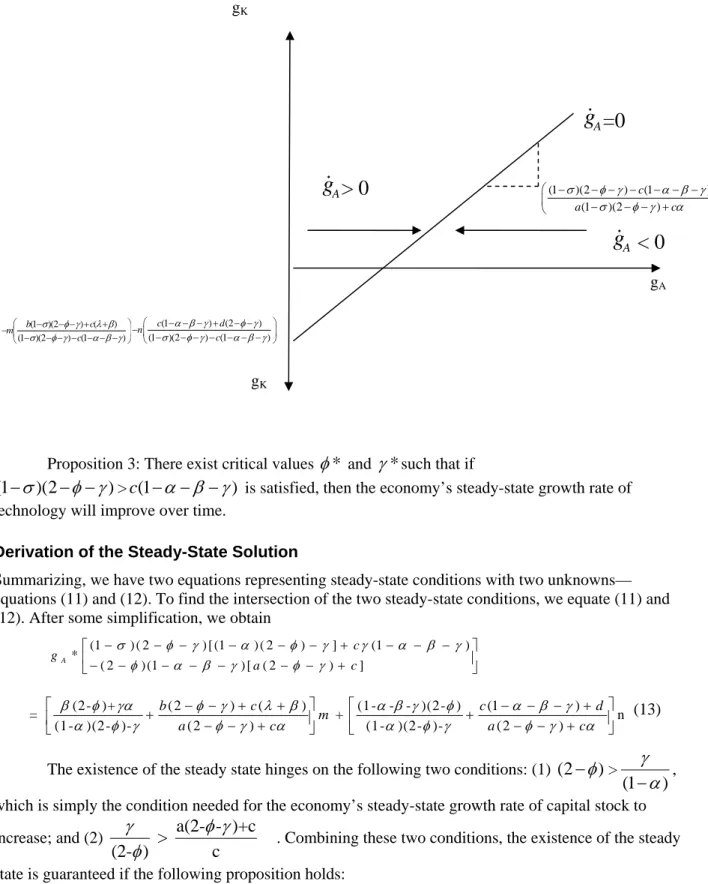
Figure 3. Phase diagram for the dynamics of the growth rate of knowledge
Proposition 3: There exist critical values
*
and
*
such that if(1
)(2
)
>c
(1
)
is satisfied, then the economy’s steady-state growth rate of technology will improve over time.Derivation of the Steady-State Solution
Summarizing, we have two equations representing steady-state conditions with two unknowns— equations (11) and (12). To find the intersection of the two steady-state conditions, we equate (11) and (12). After some simplification, we obtain
(1 ) ( 2 ) [ (1 ) ( 2 ) ] (1 ) * ( 2 ) (1 ) [ ( 2 ) ] A c g a c (2- )+ ( 2 ) ( ) (1 - - - )(2- ) (1 ) = + n (1 - )(2 - )- ( 2 ) (1 - )(2 - )- ( 2 ) b c c d m a c a c (13)
The existence of the steady state hinges on the following two conditions: (1)
(2
)
>(1
)
,which is simplythe condition needed for the economy’s steady-state growth rate of capital stock to
increase; and (2)
>
a(2- - )+c
(2- )
c
. Combining these two conditions, the existence of the steadystate is guaranteed if the following proposition holds:
Proposition 4: For the steady-state solution to exist, the critical values of
and γ must satisfy the following condition: Ag
=0
gA gK (1 )(2 ) (1 ) (1 )(2 ) c a c Ag
> 0
Ag
< 0
(1 )(2 ) ( ) (1 )(2 ) (1 ) b c m c (1 ) (2 ) (1 )(2 ) (1 ) c d n c gK*
a(2
*
*) + c
(1
)>
>
(2
*)
c
We now examine some possible scenarios.
Case 1:
(2
)
(1
)
, with
< 1First, note that the
.
A
g = 0 locus has a negative
g
K-axis intercept. From equation (11), it is evident that the growth rate of capital stock (.
k
g
= 0 locus) will have a negative intercept and a negative slope; thus, it lies below the.
A
g = 0 locus. Figure 4 illustrates the phase diagram that plots the two steady-state conditions simultaneously in the
g
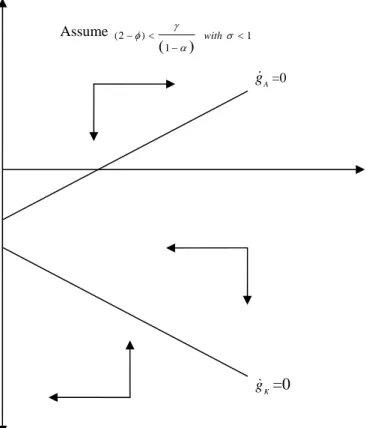
K– gA space. It can be seen that regardless of the initial point of the economy, the growth rate of technology continues to increase, whereas the growth rate of capital stock continues to decline. The economy does not reach a steady state, because the decline in the growth rate of capacity eventually affects the growth of technology and capital stock further. In this situation, there is no tendency for the economy to converge to a steady-state solution. This situation may arise when donors do not coordinate their activities in the context of a country’s goals and objectives. The proliferation of projects and procedures from lack of coordination swamp the country’s capacities and make resource management extremely difficult, which adversely affects economic growth.Figure 4. Phase diagram for the dynamics of the growth rate of capital and technology
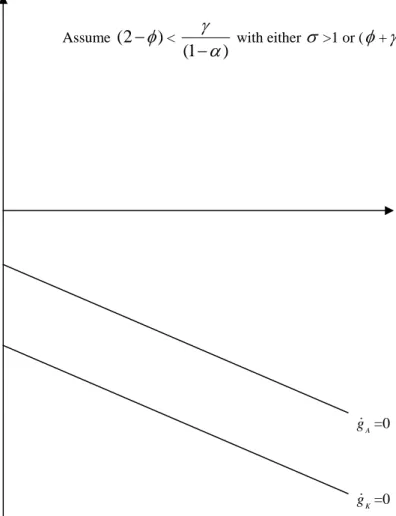
gK gA K g =0 A g =0 Assume (2 ) 1 1 with gK
Case 2:
(2
)
(1
)
, with either
> 1 or
+
> 2This is a special version of Case 1 and can be coined as the case of overcapacity. Here, the
.
A
g = 0 locus exhibits a negative slope. The dynamics are slightly different from Case 1, as both the growth rates of technology and of capital stock show steady decline. The loci are constantly diverging, leading to no intersection. The consequence is that the economy never reaches a steady state. This situation can happen when donors promote so many projects without linkages to the rest of the economy that it erodes the government budget even further. The attention of key officials is turned outward (for example, cabinet ministers spend a significant time of the year abroad), and the availability of resources for development projects depends more on relations with donors than on anything else. The presence of aid dilutes budget disciplines, with the consequence that the economy’s capacity is substantially reduced in the long run. This case is possibly the most dangerous for the recipient country in terms of new capacity formation, where both the growth rate of capital stock and of technology decline further.
Figure 5. Phase diagram for the dynamics of the growth rate of capital and technology
A g =0 gA gK K g =0 gK Assume
(2
)
<(1
)
with either
>1 or (
+
) > 2Case 3:
(2
)
>(1
)
, with
< 1This is the case for a steady-state solution to exist. In this case, the slope of the
.
k
g = 0 locus is less steep than that of the
.
A
g = 0 locus, as illustrated in Figure 6. The two steady-state loci intersect at point E. Thus, regardless of the economy’s initial point, there is a tendency for the economy to converge to point E, implying that E is a steady-state solution for the economy. We conclude that for the existence
of the steady-state solution, the following condition must hold true:
(2
)
>(1
)
.Figure 6. Phase diagram for the dynamics of the growth rate of capital and knowledge
(1 )(2 ) ( ) (1 )(2 ) (1 ) b c m c (1 ) (2 ) (1 )(2 ) (1 ) c d n c ( 2 ) (1 ) ( 2 ) (1 ) ( 2 ) m (1 ) ( 2 ) n Assume ( 2 ) 1 1 w ith (1 )(2 ) (1 ) (1 )(2 ) c a c A g =0 K g =0 (1 )(2 ) (1 )(2 ) gK gA E gK
4. POLICY EXERCISES
In this section, we consider the steady-state effects of three scenarios that could result from different development policy interventions. The first exercise14 examines what happens if the rate of learning from human capital accumulation increases exogenously, which could result from a country experiencing an increase in the number of new schools or new adult educational programs. In the second exercise, we examine the role of the recipient country in asking for more aid from the donor and doubling its
commitment to invest in capacity resources (
increasing from 0.8 to 1.6), when the elasticity of output with respect to capacity is low (we assume
= 0.1). In the final exercise, we consider a similar situation of doubling of investment in capacity resources by the recipient country, but with the elasticity of output with respect to capacity being high (we assume
= 0.35). We show that the predictions are very consistent with our theoretical model.Increase in the Rate of Learning in the Economy
Consider an exogenous increase in the rate of learning (λ) from greater human capital formation in the economy. From Figure 7, we find that an increase in λ results in decreasing the intercept of the
.
A
g = 0 locus; thus, there is a parallel downward shift from
. 0
(gA 0) to
. 1
(gA 0) . At the same time, an increase in λ results in an upward shift of the
. 0 k g locus from . 0 (gk 0) to . 1
(gk 0) . Thus, the economy moves from E0to E`1with the consequence that both the steady-state growth of technology and the growth rate of capital also increase, improving the growth rate of capacity.
The intuition for this result is as follows: First, an increase in learning results in a larger stock of human capital in the economy. Assuming that the share of human capital in the R&D sector remains unchanged, the increase in human capital resulting from an increase in the growth rate of learning leads to
an increase in the growth rate of technology, from
. A g 0 to . A g 1
. The larger growth in human capital also results in an increase in the amount of resources being used in the conventional goods-producing sector. For this sector, the larger growth of the human capital stock that arises from greater learning and from the interactions among individuals and organizations, accompanied with more rapid technological growth (from the R&D sector), leads to an increase in the growth rate of output. The rate of capital accumulation
also increases with greater output growth, which leads to a shift of the
. k g = 0 locus from . k g 0 to . k g 1 . Thus, an exogenous increase in learning leads to an increase in the long-term capacity, technology, capital stock, and output.
14
Throughout the exercises, we assume the following values of the parameters for the hypothetical economy:
= 0.3; = 0.2; γ = 0.1 and 0.35 in the low- and high-capacity levels, respectively;
= 0.8 and 1.6; = 0.6; a = 0.25; b = 0.3; c = 0.15; = 0.05 and 0.2; and d = 0.2.Figure 7. Increase in the rate of learning in the economy
Doubling of Capacity Resources When the Elasticity of Output with Respect to Capacity is Low
In this case, we assume the parameter value (as given by footnote 14) of
= 0.1. We consider the following experiment of doubling of capacity resources (i.e., increasing
from 0.8 to 1.6). The capacity of the recipient country is low in this situation. As shown in Figure 8, for the same level of α, an increase in recipient country resources devoted to capacity leads to greater learning and knowledge interactions among agents in the economy, which leads to greater human capital accumulation. The increase in humangK gA (gK=0)1 (gK=0)0 E1 E0 (gA=0)1 gA *1 gA *0 gK *0 gK *1 gK (gA=0)0