This is a repository copy of
Preferred vs neutral temperatures and their implications on
thermal comfort and energy use: Workplaces in Japan, Norway and the UK
.
White Rose Research Online URL for this paper:
http://eprints.whiterose.ac.uk/136542/
Version: Published Version
Proceedings Paper:
Shahzad, S. orcid.org/0000-0003-2425-776X and Rijal, H.B. (2019) Preferred vs neutral
temperatures and their implications on thermal comfort and energy use: Workplaces in
Japan, Norway and the UK. In: Energy Procedia. 10th International Conference on Applied
Energy (ICAE2018), 22-25 Aug 2018, Hong Kong, China. Elsevier , pp. 3113-3118.
https://doi.org/10.1016/j.egypro.2019.01.1007
eprints@whiterose.ac.uk https://eprints.whiterose.ac.uk/
Reuse
This article is distributed under the terms of the Creative Commons Attribution-NonCommercial-NoDerivs (CC BY-NC-ND) licence. This licence only allows you to download this work and share it with others as long as you credit the authors, but you can’t change the article in any way or use it commercially. More
information and the full terms of the licence here: https://creativecommons.org/licenses/
Takedown
If you consider content in White Rose Research Online to be in breach of UK law, please notify us by
ScienceDirect
Available online at www.sciencedirect.com
www.elsevier.com/locate/procedia
ć
Energy Procedia 158 (2019) 3113–3118
1876-6102 © 2019 The Authors. Published by Elsevier Ltd.
This is an open access article under the CC BY-NC-ND license (http://creativecommons.org/licenses/by-nc-nd/4.0/)
Peer-review under responsibility of the scientiic committee of ICAE2018 – The 10th International Conference on Applied Energy. 10.1016/j.egypro.2019.01.1007
© 2019 The Authors. Published by Elsevier Ltd.
This is an open access article under the CC BY-NC-ND license (http://creativecommons.org/licenses/by-nc-nd/4.0/)
Peer-review under responsibility of the scientiic committee of ICAE2018 – The 10th International Conference on Applied Energy.
ScienceDirect
Keywords: Preferred Temperature; Neutral Temperature; Griffiths Method; Thermal Comfort; Energy
1.Introduction
Finding the comfortable temperature range is important in both increasing the human comfort level and reducing the energy consumption of the building. Brager et al [1] explain that “achieving thermal monotony is highly energy intensive”. Palmer et al [2] found that through decreasing the room temperature in British houses by 1°C
ScienceDirect
10
thInternational Conference on Applied Energy (ICAE2018), 22-25 August 2018, Hong Kong,
China
Preferred vs neutral temperatures and their implications on thermal
comfort and energy use: Workplaces in Japan, Norway and the UK
Sally Shahzad
a*, Hom B. Rijal
baUniversity of Sheffield, Architecture Department, Arts Tower, Western Bank, Sheffield, S10 2TN, UK bTokyo City University, Department of Restoration Ecology and Built Environment, Yokohama, 224-8551, Japan
Abstract
This study recommends the application of “preferred temperature” rather than neutral temperature in thermal comfort studies, particularly when focused on finding the range of comfort temperatures. Currently, neutral temperature is considered as comfort temperature of the occupants in thermal comfort research. This study challenged this view and questioned the use of neutral temperature in thermal comfort studies, standard comfort zone and thermal comfort standards. Field test studies of thermal comfort were carried out on about 5,000 respondents in three distinct workplace contexts: Japan, Norway and the UK. Thermal sensation, preference and environmental measurements were collected and analysed using the Griffiths method. Preferred and neutral temperatures were compared in these three contexts and differences were observed. Overall, this study suggests that thermal preference (TP) is more likely to be a more accurate measure in assessing thermal comfort and particularly the direct implication of it in the real world context (e.g. changing the room temperature) is more likely to result in occupant comfort. It suggests that a neutral thermal sensation does not guarantee thermal comfort of the occupant, as the occupant may want other sensations than neutral (e.g. the occupant still prefers a change although feeling neutral). It is essential to recognise that non-neutral thermal sensations are considered as thermal comfort for some occupants and to include this in future research as well as the direct implication in setting the room temperature and the energy performance of the building.
3114 Sally Shahzad et al. / Energy Procedia 158 (2019) 3113–3118
approximately 16 TWh energy can be saved across the UK. Considering the larger size of an office building, occupied hours (e.g. 08:00 to 18:00) and accordingly heating or cooling requirements; to maintain the correct room temperature is essential in order to avoid unnecessary energy consumption. Many studies aim to find the optimum (range of) temperature/s that occupants find comfortable. Their results are used to improve the thermal comfort standards, to produce the standard comfort zone and finally to be applied in the workplace in setting the room temperature. Considering this direct implication, thermal comfort standards as well as the research in the field carry a great burden to enhance the human experience and accordingly the energy consumption of the building. Thus, careful consideration is required to ensure the accuracy of the findings and accordingly their applications. The comfort temperature has been often interpreted as the neutral temperature. For example, Fanger [3] used thermal neutrality to assess thermal comfort in his work. Based on the neutral thermal sensation, the ASHRAE standard introduced the boundary of indoor climatic conditions claiming over 80% of occupants will find comfortable [4]. It goes so far as using “thermoneutrality” instead of thermal comfort [3, 5]. However, Humphreys and Hancock [6] questioned the application of neutral thermal sensation vote in 2007. Their work should have been a major turning point in thermal comfort research from the assumption of considering the neutral thermal sensation vote as thermal comfort of the occupant. Although other researchers, such as Shahzad [7], [8] and de Dear [9], also criticised the application of thermoneutrality; still majority of the research in the field aim to find the neutral temperature and use it as a measure to assess thermal comfort. In this study, the comparison between the preferred temperature and neutral temperature was applied with the aim to investigate the suitability of the two measures in assessing human thermal comfort. This investigation was applied in three separate contexts.
2.Previous related work
Zhang et al [10] state that ‘the comfort literature tends to focus on neutral and optimal temperatures’. Hawkes’ [11] definition of thermal comfort is the ‘intermediate point, when neither cold nor hot’. Although ASHRAE [12] defines thermal comfort as ‘that condition of mind that expresses satisfaction with the thermal environment’ (which is not related to thermal neutrality), the ASHRAE Handbook [5] often uses “thermal neutrality” instead of “thermal comfort”. The predicted mean vote (PMV) model is most widely used in research, which is based on neutral thermal sensation vote [3]. Fanger [3] explains that ‘it is especially the relationship around the neutral point which is of interest’. More recently, Van Marken states that ‘thermoneutral zone (TNZ) is defined by physiologists as the range of ambient temperature at which temperature regulation is achieved only by control of sensible (convective and radiative) heat loss, i.e. without regulatory changes in metabolic heat production (facultative thermogenesis) or evaporative heat loss (sweating)’ [13]. The ASHRAE thermal sensation vote (TSV in Table 1) [5] and neutral thermal sensation vote on this scale are the most commonly used methods to assess thermal comfort [7]. The direct application of thermal neutrality is in setting the thermal environment in buildings, such as in ventilation [14], building design [15] and personal comfort systems (e.g. fans) [16]. Oseland et al [17] criticised the ASHRAE thermal sensation scale, as it does not indicate thermal comfort. Fountain [18] showed occupants’ desire for non-neutral thermal sensations.
Humphreys and Hancock [6] found that in 57% of the cases, occupants preferred a thermal sensation other than ‘neutral’. They found “significant differences among the respondents in the thermal sensations they desired, confirming that some characteristically preferred to feel warmer than others’. Overall, they established that “if there is sufficient adaptive opportunity, people who feel ‘slightly warm’ perhaps desire at that time to feel ‘slightly warm’, while people who feel ‘slightly cool’ perhaps desire to feel ‘slightly cool’, and so on’. They questioned the accuracy and application of the findings in the field of thermal comfort that are on the basis of the ‘neutral thermal sensation’ [6]. In a Study, Wong and Khoo [21] compared the ASHRAE thermal sensation scale to the Bedford scale and they found that respondents with extreme thermal sensations (ASHRAE scale) reported as comfortable on the Bedford scale. They questioned the McIntyre thermal preference scale, which excludes the extremes of thermal sensation as comfortable. Han et al found that ‘people in hot climates may prefer thermal state as ‘slightly cool’, while people in cold climates may use the words ‘slightly warm’ to denote their thermal preference’ [22]. Humphreys and Hancock [6] stated that ‘the need to ascertain more precisely the desired thermal sensation on the scale led researchers to supplement it with a scale of thermal preference, which asked people whether they would prefer to feel warmer or cooler, or whether they desired no change’. In order to include other thermal sensations than ‘neutral’, other scales
were introduced. For example, based on the Bedford scale [19], Nicol and Humphreys [20] introduced a new scale, as presented in Table 1. However, neither Bedford nor Nicol and Humphreys’ scales include respondents who prefer the extreme conditions (e.g. hot or cold) or occupants, who do not want to feel neutral. Oseland and Humphreys [17] consider combining two scales into one as complicated in measuring thermal comfort. Nicol et al [23] recommend the application of two separate scales or double inquiry method, which is using thermal sensation vote and thermal preference scales. As mentioned above, the ASHRAE seven-point thermal sensation scale is the most common scale used for thermal sensation, as presented in table 1. However, various thermal preference scales are used and no emphasis seems to be given to any of them; for example, McIntyre three-point scale [24], Fox scale [25], and the ASHRAE seven-point scale [12]. Most studies use the McIntyre thermal preference scale and the ASHRAE thermal sensation scale [12]. However, the degree of cooler or warmer preference of the occupant is not clear in the McIntyre scale, as it only has three options, which influences the analysis of what occupants actually want [6]. In order to compare thermal preference and thermal sensation scales, it is useful to use the same interval scales. The ASHRAE thermal sensation and thermal preference have seven-point scale, which makes the comparison and analysis easier and therefore this combination is recommended [17, 18] and used by some researchers [26, 27]. Van Hoof [28] explains that thermoneutrality may not apply to a large number of occupants, as they may prefer non-neutral sensations and in some cases the extremes of the sensation (e.g. cold, cool, warm, or hot) [7]. Although some researchers consider non-neutral thermal sensations as the thermal comfort status of the occupant (e.g. [29-33]), still many studies consider neutral thermal sensation as occupants’ thermal comfort (e.g. [14, 34-39]). The Griffiths method is based on thermal neutrality [32], where the average sensitivity of the dataset –Griffiths’ constant– is applied to predict respondents’ neutral temperature [40]. ‘The Griffiths constant is a presumed rate of change in building occupants’ thermal sensation with respect to indoor operative temperature, and it is used to extrapolate beyond the range of temperatures observed in the building to the point where neutrality might be expected to occur in the absence of any adaptation by the occupants, ceteris paribus’ [41]. Griffiths method is used in many studies, such as [42-45]. For example, Lan et al [46] investigated the neutral temperatures for sleeping respondents and developed a model to predict their thermal neutrality [47]. Ji et al [48] studied the adaptation of human body to changes of temperature from non-neutrality to neutrality, in which case 26°C was considered as the neutral temperature, while thermal preference was not recorded.
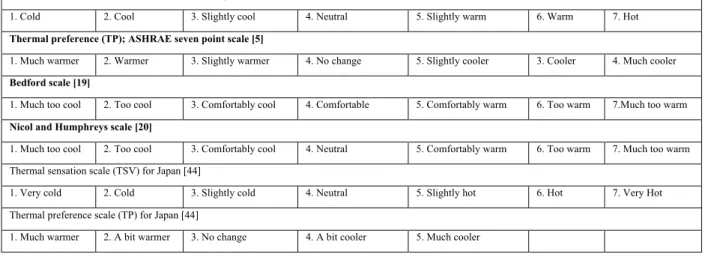
Table 1. Thermal comfort scales
Thermal sensation vote (TSV); ASHRAE seven point scale [5]
1. Cold 2. Cool 3. Slightly cool 4. Neutral 5. Slightly warm 6. Warm 7. Hot
Thermal preference (TP); ASHRAE seven point scale [5]
1. Much warmer 2. Warmer 3. Slightly warmer 4. No change 5. Slightly cooler 3. Cooler 4. Much cooler
Bedford scale [19]
1. Much too cool 2. Too cool 3. Comfortably cool 4. Comfortable 5. Comfortably warm 6. Too warm 7.Much too warm
Nicol and Humphreys scale [20]
1. Much too cool 2. Too cool 3. Comfortably cool 4. Neutral 5. Comfortably warm 6. Too warm 7. Much too warm Thermal sensation scale (TSV) for Japan [44]
1. Very cold 2. Cold 3. Slightly cold 4. Neutral 5. Slightly hot 6. Hot 7. Very Hot Thermal preference scale (TP) for Japan [44]
1. Much warmer 2. A bit warmer 3. No change 4. A bit cooler 5. Much cooler
3.Research methods
This study investigated the accuracy of the application of neutral thermal sensation vote in measuring thermal comfort. Occupants are considered as thermally comfortable when they report having a neutral feeling regarding their surrounding thermal environment. This view is challenged in the study, as non-neutral thermal sensations are overlooked while occupants may have a preference for them. For example, even though the respondent feels neutral,
3116 Sally Shahzad et al. / Energy Procedia 158 (2019) 3113–3118
they prefer to feel warmer or cooler in order to feel comfortable. In order to challenge this view, thermal sensation vote and thermal preference were collected while thermal environmental measurements were recorded in three contexts of Japanese, Norwegian and British workplaces (Figure 1). Field studies of thermal comfort was applied in these workplaces collecting overall 4,973 datasets from the occupants of 15 office buildings (4,660 votes from 11 Japanese offices, 172 votes from 2 Norwegian offices and 141 votes from 2 British offices). Mainly sedentary activities took place in the offices and when collecting the data, a balance of age and gender was considered. Quantitative regression analysis was applied, as it is the main method used in thermal comfort research [49]. In this study, the neutral temperature is calculated through Griffiths method [43, 50] using the following equation:
Tn= Ti + (4 – TSV) / a (1)
Tc is comfort temperature by Griffiths’ method (°C), Ti is indoor air temperature and ‘a’ is the rate of change of
TSV with room temperature, replacing the regression coefficient: 0.50 [39, 49]. The equation means that in case the TSV of the respondent was not neutral, a change of 2°C is considered for every scale (e.g. in case TSV=slightly cool, while the room temperature reads 24°C, a room temperature of 26°C (=24+2°C) is considered as neutral temperature).
Fig. 1. Office buildings in a. Japan; b. Norway; and c. UK 4.Results and analysis
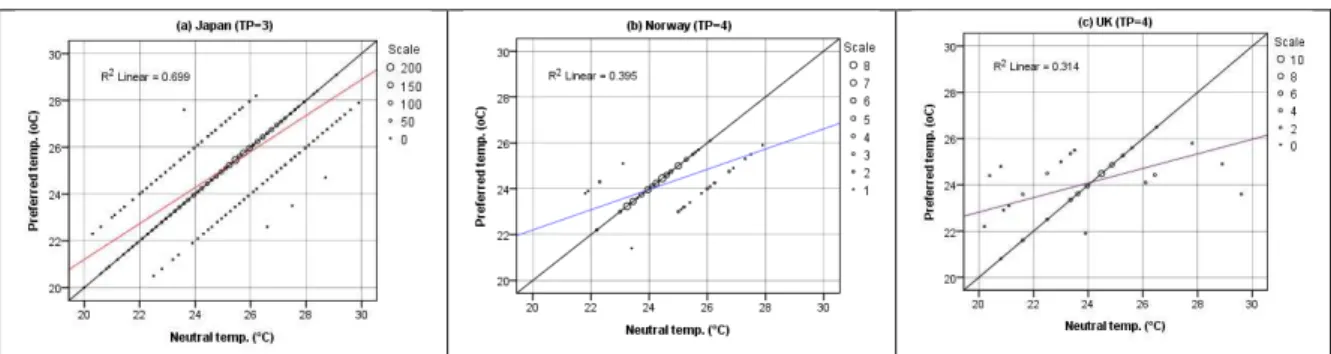
Overall, 3,096 respondents preferred no change in the temperature (TP=no change) at the time of the study, out of which, 2,568 respondents had a neutral thermal sensation vote (TSV=neutral). This number was higher in the Japanese cases (i.e. 84%) compared to the Norwegian cases (i.e. 77%) and particularly the British cases (i.e. 64%). This suggests that the rest of the occupants preferred no change in the temperature, while feeling other sensations than neutral. For example, in the British cases 46% of the respondents preferred no change while experiencing a non-neutral thermal sensation. Figure 2 demonstrates the relationship between preferred temperature (i.e. only considering TP=no change) and neutral temperature (i.e. TSV=neutral/Griffiths’ neutral). The regression line is highlighted in colours (red in the Japanese case, blue in the Norwegian case and purple in the British case). As demonstrated, the regression line does not match the diagonal line (the solid black line showing equal preferred and neutral temperatures). This difference is more significant in the Norwegian and particularly the British cases. It suggests that the neutral temperature may be different from the preferred temperature (when TP = no change), suggesting the following equations for each country:
Japan Tp=0.769Tn+5.8 (n=2929, R2=0.70, S.E.=0.009, p<0.001) (2)
Norway Tp=0.441Tn+13.4 (n=103, R2=0.40, S.E.=0.054, p<0.001) (3)
UK Tp=0.315Tn+16.5 (n=64, R2=0.31, S.E.=0.059, p<0.001) (4)
Tp: Preferred temperature (°C); n: Number of sample; R2: Coefficient of determination; S.E.: Standard error of the
regression coefficient; p: Significance level of regression coefficient. The regression coefficient and coefficient of determination of the Japan data is much higher than the Norway and UK. These regression equations are used to estimate the preferred temperature by neutral temperature. For example, when the neutral temperature is 26°C, the preferred temperature of the occupant is 25.8°C, 24.9°C and 24.7°C in Japan, Norway and UK, respectively. This suggests that when the neutral temperature is high, a lower temperature is preferred compared to the predicted one
based on thermal neutrality. Also, when the neutral temperature is 22°C, the preferred temperature of the occupant is 22.7°C, 23.1°C and 23.4°C in Japan, Norway and the UK respectively. This suggests that when neutral temperature is low, a higher room temperature is preferred, as compared to the assumption according to thermoneutrality.
Fig 2. Relation between the no change prefer temperature and neutral temperature 5.Discussion and conclusion
This study recommends the application of “preferred temperature” rather than neutral temperature in thermal comfort studies, particularly when focused on finding the range of comfort temperatures. Currently, neutral temperature is used in most studies to investigate comfort temperature of the occupants, while thermal preference is hardly mentioned. This study challenged this view and questioned the use of neutral temperature in thermal comfort studies, thermal comfort standards and the standard comfort zone. The results indicated that the occupant’s preferred temperature is likely not to match their neutral temperature. Differences were observed between the three contexts (Japanese, Norwegian and British offices). In Japan, the gap between the preferred temperature and neutral temperature was closer, while this gap was greater in the Norwegian and particularly British offices. This suggests that in Japan, out of the respondents who preferred no change, 84% of them had a neutral thermal sensation. However, this number drops to 64% in the British context, indicating that 46% of the respondents, who preferred no change, were experiencing a non-neutral thermal sensation. This suggests that up to almost half of the occupants were comfortable not to feel neutral. This is in agreement with the findings of Humphreys and Hancock that people may not want to feel neutral [6]. This finding influences human thermal comfort, temperature settings and accordingly the energy requirements for heating and cooling in the built environment. For example, when a respondent has a non-neutral thermal sensation vote, it is important to consider their thermal preference (TP) before making an assumption that they are uncomfortable, as they may be comfortable and do not want any changes in the temperature or the change they prefer may be in the other direction. For instance, in case the respondent has a cool thermal sensation vote (TSV = cool), according to Griffiths method in order to find the neutral temperature, 4°C increase in the temperature would be required to ensure their thermal comfort. In case this was in winter time, more energy would be required to warm up the room. However, when thermal preference of the occupant is considered, rather than the expected warmer preference, it may be slightly cooler, suggesting that although the respondent feels cool, they prefer even slightly cooler. Therefore, a decrease in the temperature would be required rather than the assumed 4°C increase in the temperature. This would save energy in the winter time when heating is required, as less heating would be required. Also, contextual differences in the gap between preferred and neutral temperatures are part of the findings in this study, which requires further investigation for the reason and also in other contexts. This study suggests that thermal preference (TP) is more likely a more accurate measure in assessing thermal comfort and particularly the direct implication of it in the real world context (e.g. changing the room temperature) is more likely to result in occupant comfort. It suggests that a neutral thermal sensation does not guarantee thermal comfort of the occupant, as the occupant may prefer other sensations than neutral (e.g. the occupant still prefers a change although feeling neutral). It is essential to recognise that non-neutral thermal sensations are considered as thermal comfort for some occupants and to include this in future research as well as the direct implication in setting the temperature and building energy use.
3118 Sally Shahzad et al. / Energy Procedia 158 (2019) 3113–3118
Acknowledgements
The authors acknowledge the contributions; including the Gotoh Educational Corporation, Hulic, Nikken Sekkei, Panasonic Corporation, Tokyo City University, Tokyu Fudosan Next Generation Engineering Center, Tsuzuki Ward and to all students for data entry. Part of this research was supported by Grant-in-Aid for Scientific Research (C).
References
[1] G. Brager, H. Zhang, E. Arens, Evolving opportunities for providing thermal comfort, Building Research & Information, 43. 2015. 274-287 [2] J. Palmer, N. Terry, P. Pope, How much energy could be saved by making small changes to everyday household behaviours, A report. 2012 [3] P.O. Fanger, Thermal Comfort; Analysis and Applications in Environmental Engineering, First ed., McGraw-Hill Book Company. 1970 [4] M. Limb, Air Infiltration and Ventilation: Glossary: Tachnical Note A/VC 36, Air Infiltration and Ventilation Centre, Warwick. 1992 [5] ASHRAE, ASHRAE Handbook: Fundamentals, in, American Society of Heating, Refrigerating and Air-Conditioning Engineers. 2009 [6] M.A. Humphreys, M. Hancock, Do people like to feel ‘neutral’? Energy and Building, 39. 2007. 867-874
[7] S. Shahzad, Individual thermal control in the workplace: cellular vs open plan offices: Norwegian and British case studies. Edinburgh. 2014 [8] S. Shahzad, J. Brennan, D. Theodossopoulos, J.K. Calautit, B. Hughes, Does a neutral thermal sensation determine comfort? BSERT. 2018 [9] R. De Dear, Revisiting an old hypothesis of human thermal perception: alliesthesia, Building Research & Information, 39 (2011) 108-117 [10] A. Voelcker, The selective environment-An approach to environmentally responsive architecture, in, EMAP PUBLISHING. England. 2002 [11] D. Hawkes, The Selective Environment; An approach to environmentally responsive architecture, Spon Press, London. 2002
[12] H. Zhang, E. Arens, W. Pasut, Air Temperature Thresholds for Inddor Comfort and Perceived Air Quality, BRI. 39. 2011. 134-144 [13] ASHRAE, ASHRAE Standard 55-2004, in, American Society of Heating, Refrigerating and Air-Conditioning Engineers, USA. 2004 [14] W. van Marken Lichtenbelt, B. Kingma, R., Building and Occupant Energetics: A Physiological Hypothesis, ASR. 2013. 48-53 [15] M. Fong, Z. Lin, K. Fong, T. Chow, T. Yao, Evaluation of thermal comfort conditions in a classroom with three ventilations. IA. 2011 [16] L. Schellen, S. Timmers, M. Loomans, E. Nelissen, J. Hensen, W. van Marken, Downdraught assessment during design. BE. 2012 [17] J. Hua, Q. Ouyang, Y. Wang, H. Li, Y. Zhu, A dynamic air supply device used to produce simulated natural wind. BE. 2012 [18] N.A. Oseland, M.A. Humphreys, Trends in Thermal Comfort Research, in: BRE Press, Building Research Establishment. 1994 [19] M. Fountain, G.S. Brager, R. de Dear, Expectations of Indoor Climate Control, Energy and Buildings, 24. 1996. 179-182
[20] T. Bedford, The Warmth Factor in Comfort at Work: A Physiological Study of Heating and Ventilation, in: MRC. H.M.S.O, London. 1936 [21] J.F. Nicol, M.A. Humphreys, Thermal comfort as part of a self-regulating system, Builiding Research & Information, 1. 1973. 174-179 [22] N.H. Wong, S.S. Khoo, Thermal comfort in classrooms in the tropics, Energy and buildings, 35. 2003. 337-351
[23] J. Han, G. Zhang, Q. Zhang, J. Zhang, J. Liu, L. Tian, C. Zheng, J. Hao, Y. Liu, D. Moschandreas, Field Study on Occupants. BE. 2007 [24] F. Nicol, M.A. Humphreys, S. Roaf, Adaptive Thermal Comfort: Principles and Practice, First ed., Routledge. 2012
[25] D.A. McIntyre, R.R. Gonzalez, Man's Thermal Sensitivity during Temperature Changes at Two Levels of Clothing. ASHRAE. 1976 [26] R. Fox, P.M. Woodward, A. Exton-Smith, M. Green, D. Donnison, M. Wicks, Body temperatures in the elderly. Br Med J, 1. 1973. 200-206 [27] E. Johansson, S. Thorsson, R. Emmanuel, E. Kruger, Instruments and Methods in Outdoor Thermal Comfort Studies, Urban Climate. 2014 [28] M.K. Nematchoua, R. Tchinda, P. Ricciardi, N. Djongyang, A field study on thermal comfort in naturally-ventilated buildings. RSER. 2014 [29] J. Van Hoof, Forty years of Fanger’s model of thermal comfort: comfort for all?, Indoor air, 18. 2008. 182-201
[30] H.B. Rijal, M. Humphreys, F. Nicol, Understanding Occupant Behaviour: The Use of Controls In Mixed-Mode Office Buildings, BRI. 2009 [31] J. Lee, Y. Tochihara, H. Wakabayashi, E. Stone, A, Warm or Slightly Hot? Difference in Linguistic Dimensions. JPA. 2009
[32] E. Arens, M.A. Humphreys, R. de Dear, H. Zhang, Are 'Class A' Temperature Requirements Realistic or Desirable? BE. 2010. 4-10 [33] M. Bos, A., J. Love, A., A Field Study of Thermal Comfort with Underfloor Air Distribution, Building and Environment, 69. 2013. 233-240 [34] Z. Wang, H. Yu, Y. Jiao, Q. Wei, X. Chu, A field study of thermal sensation and neutrality in free-running aged-care homes. EB. 158. 2018 [35] D. Yang, J. Xiong, W. Liu, Adjustments of the adaptive thermal comfort model. Building and Environment. 114. 2017. 357-365
[36] J. Liu, R. Yao, J. Wang, B. Li, Occupants' Behavioural Adaptation in Workplaces with Non-Central Heating and Cooling. ATE. 2012 [37] J. Cigler, S. Privara, Z. Vana, E. Zacekova, L. Ferkl, Optimization of Predicted Mean Vote Index within Model Framework. EB. 2012 [38] K.W.D. Cheong, W.J. Yu, S.C. Sekhar, K.W. Tham, R. Kosonen, Local Thermal Sensation and Comfort Study. BE. 2007
[39] J. Leyten, L, S. Kurvers, R, A. Raue, K, Temperature, Thermal Sensation and Workers' Performance. Architectural Science Review. 2013 [40] S. Manu, Y. Shukla, R. Rawal, L.E. Thomas, R. de Dear, Field studies of thermal comfort across multiple climates. BE. 98. 2016. 55-70 [41] R. Dear, T. Akimoto, E. Arens, G. Brager, C. Candido, K. Cheong, B. Li, S. Tanabe, Progress in thermal comfort research. IA. 23. 2013 [42] J.F. Nicol, M.A. Humphreys, Derivation of the adaptive equations for thermal comfort in free-running buildings EN15251, BE. 2010 [43] H.B. Rijal, M. Humphreys, F. Nicol, Towards an adaptive model for thermal comfort in Japanese offices, BRI. 45. 2017. 717-729 [44] R. Thapa, H.B. Rijal, M. Shukuya, Field study on acceptable indoor temperature in temporary shelters built in Nepal. BE. 135. 2018. 330 [45] M. Indraganti, Using the adaptive model of thermal comfort for obtaining indoor neutral temperature. BE. 45. 2010. 519-536
[46] L. Lan, L. Pan, Z. Lian, H. Huang, Y. Lin, Experimental study on thermal comfort of sleeping people at different temperatures. BE. 2014 [47] L. Lan, Z.J. Zhai, Z. Lian, A two-part model for evaluation of thermal neutrality for sleeping people, BE. 132. 2018. 319-326
[48] W. Ji, B. Cao, Y. Geng, Y. Zhu, B. Lin, Study on human skin temperature and thermal evaluation in step change conditions. EB. 156. 2017 [49] K.J. McCartney, F. Nicol, Developing an Adaptvie Control Algorithm for Europe, Energy and Buildings. 34. 2002. 623-635