Direction des Études et Synthèses Économiques
G 2008 / 08
Are Prices Really Affected
by Mergers?
Xavier B
OUTINet Lionel J
ANINDocument de travail
Série des documents de travail
de la Direction des Études et Synthèses Économiques
JUILLET 2008
We are much indebted to Patrick Rey and Bernard Salanié for their leads, comments and support in many occasions. We are also very grateful to José Bardaji and Benoit Ourliac, from the Department of Short-Term Economic Analysis at INSEE for their help on factor models, to Philippe Choné, David Margolis, Pauline Givord and Sébastien Roux for useful comments, to the IPVIS Unit at INSEE, and especially Eliane Le Rey for her lights on French PPI as well as to DGCCRF for the provision of data on controlled mergers. We thank the participants at the first RNIC Conference, Mannheim (2007), EARIE (Valencia) and AFSE (Paris) 2007 Annual Meetings and seminars at University of Cergy, INSEE, and CREST for useful discussions and valuable comments. Views expressed and remaining errors are entirely ours and could by no mean be attributed to any institution we work or have worked for.
_____________________________________________
* INSEE (D3E-MSE), CREST-LEI, and University of Toulouse (GREMAQ) ** DGTPE and CREST-LEI
Département des Études Économiques d'Ensemble - Timbre G201 - 15, bd Gabriel Péri - BP 100 - 92244 MALAKOFF CEDEX - France - Tél. : 33 (1) 41 17 60 68 - Fax : 33 (1) 41 17 60 45 - CEDEX - E-mail : [email protected] Site Web INSEE :
http://www.insee.fr
Ces documents de travail ne reflètent pas la position de l’INSEE et n'engagent que leurs auteurs. Working papers do not reflect the position of INSEE but only their author's views.
G 2008 / 08
Are Prices Really Affected
by Mergers?
Are Prices Really Affected by Mergers?
AbstractDuring the 80s, several empirical studies have shown a positive correlation between concentration, prices and profits. It is well known that these estimates all suffer from simultaneity bias: market structure and prices are affected by common factors, some of which are not observable, which rules out any causal interpretation of cross-sectional correlations. Mergers are an interesting instrument to identify the (static) impact of concentration on prices, since they induce breaks in strategic interactions between actors. The few ex post studies on mergers that are currently available are difficult to generalize, because they pertain to specific markets. This study looks more systematically to selling prices in 63 sectors observed between 1989 and 2002.
The approach that has been chosen is a difference in differences approach, applied to price movements around mergers. The rate of inflation in a sector where a merger has occurred is compared to a counterfactual. In a simple framework, in line with previous studies (McCabe 2002), this counterfactual would be built as the mean of inflation rates in other sectors. This paper focuses on more relevant estimates, provided by a factor model.
This methodology allows tracking the profile of prices around mergers. We separate mergers between French firms and mergers between other European firms controlled by European authorities (and thus assumed to have affected the common market). We also distinguish mergers having led to an in-depth inquiry by competition authorities (« phase 2 ») and those benefiting from a shorter procedure (« phase 1 »). We observe an acceleration of price movements around the most important of French mergers, but not for the ones authorized under phase 1. We also observe a break in price movements for mergers between foreign firms examined by the European Commission, generally in the other direction.
Keywords: mergers, prices, factor models.
Les fusions affectent-elles les prix ?
RésuméDans les années 80, de nombreuses études empiriques ont établi une corrélation positive entre concentration, prix et profit. Ces estimations souffrent cependant de biais de simultanéité : la structure des marchés et les prix découlent de caractéristiques identiques, dont toutes ne sont pas observables. La corrélation en coupe ne peut donc être interprétée de manière causale. Les fusions, qui induisent une rupture dans les interactions stratégiques, constituent des instruments intéressants pour identifier l’impact (statique) de la concentration sur les prix. Les rares études ex post sur les fusions, portant sur des marchés particuliers, sont difficilement généralisables. Cette étude s’intéresse aux prix de vente de 63 secteurs entre 1989 et 2002. L’approche choisie ici est une analyse en différences de différences des mouvements de prix de vente autour des fusions. L’inflation d’un secteur dans lequel s’est produit une fusion est comparée à une inflation « contrefactuelle ». Une approche simple retenue par les travaux antérieurs (McCabe 2002) consiste à calculer la moyenne des inflations des autres secteurs. Dans ce papier, une structure plus riche est utilisée, sous la forme d’un modèle à facteurs. Cette méthodologie permet de tracer le profil de prix autour des fusions. On distingue les fusions entre entreprises françaises des fusions entre d’autres entreprises européennes examinées par les autorités communautaires au titre de l’affectation du marché commun. Par ailleurs, on distingue également les fusions qui ont fait l’objet d’une analyse approfondie de la part des autorités de concurrence (phase 2) de celles autorisées au terme d’une procédure plus courte (phase 1). L’étude met en évidence une accélération des prix pour les fusions françaises les plus importantes, mais pas pour celles autorisées en phase 1. On observe également une rupture de pente, généralement de sens opposé, pour les fusions entre entreprises étrangères traitées par la Commission européenne.
Mots-clés : fusions, prix, modèles à facteurs. Classification JEL : G34, L11, C53
Introduction
Running from the 1950s until the 1980s, the paradigm of structure, conduct, performance (SCP) in industrial organization emphasized that market structure was responsible for the conduct of the firms in a given sector, hence the performance in this sector. The link between profits and concentration, measured by Herfindahl-Hirschman Index (HHI), has been intensively studied at that time, using cross-sectional data. The general conclusion of this literature is that higher concentration in a given sector is associated with higher price-cost margins (Salinger 1990). As is well known, these studies suffer from a common flaw. Market structures and mark-ups are jointly determined by technology, fixed-cost, demand characteristics and the type of competi-tion. The cross-sectional correlation between prices and concentration cannot be interpreted causally. Prices are easier to measure (see Bresnahan 1989). Nonetheless, they are also jointly determined by demand and supply (see Evans, Froeb, and Werden 1993). Higher prices may be associated with unobserved quality and geographical variability in prices may partially arise from unobservable heterogeneity in demand characteristics (see Newmark 2004).
Mergers do not arise by chance. Factors that trigger mergers are likely to also concomitantly affect prices. However, they induce a break in the incentives to compete of the incumbents in a market and they are likely to have sizable price effects. Thus, they are an interesting instrument, even though imperfect, to study the link between strategic relations and prices. Moreover, mergers and acquisitions are subject to a specific control. Studying price movements close to mergers effect is therefore of importance for the assessment of Competition Policy.
A first line of research for the assessment of the impact of mergers on prices relies on the joint estimation of demand and supply functions for differentiated products. These estimates are then generally used as inputs in a Bertrand-Nash competition framework to predict the effect of a given merger, through the change in player structure. Nevo (2000) studies the US industry of ready-to-eat cereals; Ivaldi and Verboven (2005) study the truck industry in Europe; Pinkse and Slade (2004) study the beer industry in the UK. With the noticeable exception of Peters (2006), they exclusively focus on ex ante evaluations. These evaluations are very useful and much promising for practitioners, even if they still face important challenges, such as the necessity to better account for product quality changes. Besides, the precise structure of cost and demand in each paper is market specific. Each study must be tailored to each specific
market and it is therefore hard to generalize this type of analysis to a broad range of markets. Finally, by nature, they do not provide insight on what actually happened in markets when mergers occurred.
The few direct ex post evaluations of mergers on prices focused on specific sectors, such as the airline industry (Kim and Singal 1993) or the banking industry (Prager and Hannan 1998, Sapienza 2002). Focarelli and Panetta (2003) focus on the impact of mergers in the banking sector in Italy between 1990 and 1998. They use time and space variability to identify the effect of mergers on the interest rates paid by banks on current accounts. They show a short term (two years) anticompetitive effect, which turns to a pro-competitive effect after five years. The results are strengthened by sub-group analysis. Price effects are stronger for more concentrated markets and for smaller deposits, for which demand is supposed to be less elastic. They also provide strong evidence that short term price increases, interpreted as the market-power effects, occur both for merging and non-merging firms. On the contrary, long-term price decreases, interpreted as the efficiency related effects, are observed only for merging firms. While the anticompetitive effect is general the efficiences only concern the merged entity.
These papers provide very useful information but their external validity is limited as the markets they consider have particular features and are subject to specific regulations. The aim of this paper is to generalize the study on the impact of mergers to a larger set of markets. The only existing general studies on the impact of mergers rely on stock market data (see Duso, Neven, and R¨oller 2003, Duso, Gugler, and Yurtoglu 2005). These studies are easier to implement, especially over a large number of mergers and markets. They focus on the abnormal returns on the stock markets after merger anouncements and interpret positive returns for the share of competitors as anticipated anticompetitive effects of mergers. However, due to anticipations by the actors, the link between the evolutions of stocks and the evolution of profitability is not unambiguous (see Fridolfsson and Stennek 2000, 2005 and 2006). At last, the studies based on stock markets provide information on profitability of firms, an issue only tangentially related to prices.
McCabe (2002) uses a non-structural difference-in-difference methodology to study the impact of mergers in the academic journal sector. This generalization of difference-in-difference methods had already been used by Jacobson, LaLonde, and Sullivan (1993) to analyze the earning losses of displaced workers. In this paper, we extend this methodology by using factor models to build a more relevant counterfactual. The following section presents the methodology. In Section II, we present the data. The last section present the results.
1
Empirical strategy
Focarelli and Panetta (2003) take advantage of the existence of many geographical markets to identify the effect of mergers on merging firms and rivals, as well as the impact of out-of-market mergers. This approach is effective because banking has some features of a retailing industry. However, most retailing industries have other features that raise serious issues as for the possibility to generalize this approach, at least for France. First, the variability of prices for one good in different locations may be significantly reduced by pricing practices. Firms may use national pricing strategies in order to build a national image. Such practices may also be the consequences of regulations or case law, forbidding price discriminations or resale at a loss (see Biscourp, Boutin, and Verge 2008, Competition Commission 2007). This is of importance for France, where the distribution channel has undergone significant regulatory changes during the period we are considering (Biscourp, Boutin, and Verge 2008). Besides, contrary to the situation in the banking industry, retailers are seldom vertically integrated with producers. Therefore, vertical issues are of prime interest. In particular, sorting out what is due to the producer-retailer relationship in the effects of mergers seems a challenging task. To avoid these issues, we choose to focus on manufacturing industries. Most geographical relevant markets for these sectors are likely to be national or wider. As a consequence, Focarelli and Panetta’s (2003) approach cannot be generalized for these markets.
Competition authorities have access to privileged information on the mergers they control, either through their own expertise of the involved markets or due to specific information provided by the parties. The access to this type of information is out of reach for researchers. Besides, the full effect of mergers will only appear after a long period of time (Focarelli and Panetta 2003). This is particularly obvious for organization or supply related efficiencies. The aim of the paper is neither to evaluate the overall impact of mergers in the long run, nor to determine if competition authorities took the right decisions. On the contrary, we voluntarily focus on short term effects. We assume that, if modified by mergers, strategic relations and the incentives to compete are immediately modified. In particular, market power could immediately be exercised and unilateral effects would be likely to appear shortly after the merger, on the contrary to efficiencies. Then our short term analysis is expected to capture the potential breaks in the incentives to compete.
On this assumption, we focus on short-term manufacturing price index changes just after mergers and wish to investigate if, on average, mergers do modify strategic relations, possibly in an adverse way for customers. Sectors where mergers occur are likely to have different observable and unobservable characteristics. Fixed effects are sufficient to deal with such time invariant
heterogeneity. On the contrary, if unobserved shocks affect the markets, accounting for the evolution of prices before mergers is crucial. In this paper, a difference-in-difference type of approach is used to identify changes in prices around mergers. Overall, this approach is similar to the one used by McCabe’s (2002).1 In line with the past literature, we would consider that the inflation in sectoriin time tis given by:
πit=πt+πi+
12
X
k=−11
αk#mergersit−k+it
where #mergersit−k is the number of mergers in sectoriat date t−k.
Irrespective of the mergers, the inflation rate is assumed to be the sum of a sector specific effect (πi), fixed during the period, a monthly shock (πt), common to all sectors, and an
idio-syncratic term. The dummies before and after mergers implement a generalization of difference-in-difference methods in a dynamic framework. In this basic setup, inflation rates are compared to the average monthly inflation at the same date, accounting for the difference of means on the whole period. Identification of the coefficients arises from the assumption that mergers in one market do not occur in each period and that for each period there are markets with no merger.
1.1 Building a richer counterfactual
1.1.1 Factor Models
The previous specification has the advantage of being simple and transparent. The hypothesis that all individuals are identically affected by a sole common shock is consistent in the two previously quoted examples (Jacobson, LaLonde, and Sullivan 1993, McCabe 2002) as the in-dividuals they consider are highly homogeneous. This hypothesis is hardly tenable in our case. Sectors may be subject to different shocks and their reaction to the same shocks could differ. The average monthly inflation is then inappropriate as a counterfactual.
We lack the information that would be necessary to structurally model the inflation in each sector. We also lack the information necessary to extend matching methods to our dynamic data. However, it is possible to use the panel dimension of our data set to infer some useful information from the comovements of inflation in the sectors we are considering. More precisely, it is possible to replace the common shock (πt) in the previous setup by a richer one of (q)
1
This type of approach was first introduced by Jacobson, LaLonde, and Sullivan (1993) in a very different context to study the earning losses of displaced workers.
common factors. This setup is more general, as than solely accounting for the mean of the inflations. Thus, we consider the following statistical model:
πit= q X k=1 λikFkt+ 12 X k=−11 αk#mergersit−k+it | {z } ξit
Irrespective of the composite structure of the error termξit, this type of model is part of the
broad range of factor models (very comprehensive presentations of these model can be found in Stock 2006, Stock and Watson 2006, Breitung and Eickmeier 2005). These models are useful to aggregate many information in order to build core economic indicators. For this reason, they are now used for a growing number of applications, in many fields of economics. They are currently used on a monthly basis by public institutes to build coincident business cycles indicators. For instance the French National Institutes for Statistics and Economic Studies (INSEE) uses business surveys to build business climate indicators in the industry or in the services (Doz and Lenglart 1999, Lenglart and Toutlemonde 2002, Cornec and Deperraz 2006). CEPR has been releasing a coincident indicator of euro-area GDP (EuroCOIN, see Altissimo, Bassanetti, Cristadoro, Forni, Hallin, Lippi, Reichlin, and Veronese 2001) and, in the USA, the Chicago Fed National Activity Index (CFNAI) aggregates a large macro dataset into one common factor. Using factor models, Cristadoro, Forni, Reichlin, and Veronese (2005) have built a measure of the core inflation of the Euro area. This aggregation of many instruments is also used as a forecasting tool (Stock and Watson 1999, 2002b and 2002a, Forni, Hallin, Lippi, and Reichlin 2000 and 2003). The reduction of the dimension of statistical models is also useful in Finance, with the general use of Stochastic Discount Factor, closely related to factor models (Garcia and Renault 2000).
Factor models split the variance of the statistical model into two orthogonal components: the “common component” (Pqk=1λikFkt), of small dimension, and the “idiosyncratic component”
(ξit). The common component provides with a “now-cast”, based on the in-sample comovements
of the various series of prices. If we assume that the price movements surrounding mergers are specific to the sectors where mergers occur, they are orthogonal to common components. It is then consistent to adopt a two-tier approach, which generalizes the previous difference-in-difference method. The first step is to estimate the factors in our sample, which provides a more appropiate counterfactual than in the basic setup. Then, we will perform the regression on the residuals, the “idiosyncratic component”, to analyze if there are systematic deviations of price patterns from the common components close to mergers.
1.1.2 Choice of a model
The setup of factor models can be very general, with a complex dynamic structure for factors, fixed but lagged and even time varying loading (Del Negro and Otrok 2004). When there is a small number of series, these models can generally be cast into state space setup and estimated via the Kalman filter. As n grows, the number of parameters to be estimated increases very quickly and the estimation problem becomes a challenge. However, strict or approximate factor models can be estimated by the (non parametric) method of principal components, which is much easier to compute. Two main methods of estimation exist, both fundamentally using reduction by the cross-sectional dimension (Croux, Renault, and Werker 2004). The first one (static approach) is based on an eigenvalue decomposition of the sample covariance matrix, while the second one (dynamic approach) uses the spectral density matrix. Inferential theories of the two types of approaches when the number of series and their length both tend to infinity have been proposed recently. Factors estimated by principal component methods are consistent, even when the assumption on uncorrelation of the errors is relaxed and when there exist weak serial and cross-sectional correlations (provided that it is not “too large”). For the time domain approach, it has been proposed by Stock and Watson (2002b), Bai and Ng (2002), and Bai (2003) (extended by Bai and Ng (2004) for serial correlation and by Bai and Ng (2006) for confidence intervals). Conversely, asymptotic results for the frequency domain are provided by Forni, Hallin, Lippi, and Reichlin (2000) and Forni, Hallin, Lippi, and Reichlin (2004).
In our framework, the dynamic approach does not present clear advantages and raises issues as regards to the dynamic structure of the residuals. For these two reasons, our preference will go to the static approach.
Favero, Marcellino, and Neglia (2005) indeed conclude that the overall performance of both approaches are very similar. On the contrary, Forni, Hallin, Lippi, and Reichlin (2005) argue that the dynamic approach provides better results for it fully exploits dynamic informations included in the series. Simulations show that the dynamic approach is likely to perform (slightly) better when the series have heterogeneous dynamics.2 This paper focuses on series of price indices in the manufacturing sector. This is a much more homogeneous set than those usually used to forecast macroeconomics variables. Then, the issue of dynamic heterogeneity is likely to be less significant.
Besides, in static factor models, common factors are sole linear combinations of the present
2The empirical results show that the two-step procedure proposed by the authors performs (slightly) better than the forecasting methods based on the static approach. However, the authors also implement techniques introduced in Boivin and Ng (2006) to select the most informative series, which makes the strict comparison between static and dynamic methods more difficult.
variables. On the contrary, the dynamic approach requires two-sided, or at least one-sided filters (Altissimo, Bassanetti, Cristadoro, Forni, Hallin, Lippi, Reichlin, and Veronese 2001, Forni, Hallin, Lippi, and Reichlin 2005). Then, not only present, but also future and past, values of the variables intervene in the common components. The consequences of this filtering on the time structure of the idiosyncratic component is quite unknown. This is an important issue here as we wish to investigate the precise movements of this residual close to mergers.
1.1.3 Data treatment and number of factors
Practically, our series of price indices are first seasonally adjusted, using the Census X11 pro-cedure implemented in SAS. They are then transformed to stationarity by log-differentiation and standardized to zero means.3 In line with Favero, Marcellino, and Neglia (2005), we also balance our data set. Favero, Marcellino, and Neglia indeed quote that the information provided by the unbalanced part of their sample is not useful, or not properly extracted by the existing procedures.
Overall, we will use 63 series of monthly prices for the 1989-2002 period (see Data section for the choice of the period). Our sample is smaller than those commonly used in the literature. Nonetheless, the fact that we are working on a smaller number of series compared to most of the literature is not per se an issue.
Boivin and Ng (2006) show that the number of series is not the sole element to be taken into account for the precision of the estimates. As few as 40 series may actually be sufficient for forecasting.4 As for OLS, the link between size and precision is not unambiguous when errors are not iid. If some series are only marginally determined by the same common factors, they are poorly informative about factors. Then, the idiosyncratic component has large variance, and these series are rather polluting the estimation of common factors. On the contrary, if the series are actually comoving, if they have sufficient comunalities, they are informative about the factors. The aim of our first step is to “now-cast” inflation, using data on inflation. Our series are likely to be quite homogeneous. The risk of over-sampling is then likely to be limited. On the contrary, it cannot be excluded that correlated errors may play a role.5 However, the series
3However, the results are very similar without the seasonal adjustment and if a fixed effect is used in the final regression instead of the standardization to zero mean.
4Bai and Ng (2002) find that as few as 40 series are sufficient for the estimation of the number of factors when the errors are iid. Boivin and Ng (2006) show that as few a 40 series may be sufficient for forecasting. A forecast of inflation of producer price index for finished goods (pwfsa) based on the “best” 33 series is at least not performing worse than the forecasts based on the whole sample of 147 series of Stock and Watson (2002b).
5
If the information is redundant, as it would be the case by pooling unaggregated and aggregated series, then the marginal benefit from a larger number of series is smaller. However, we are considering series at the same levels of aggregation and are thus avoiding the main pitfall.
we are considering are our items of interest. It is then impossible to implement the procedures of Boivin and Ng and to select the “best” series for forecasting.6
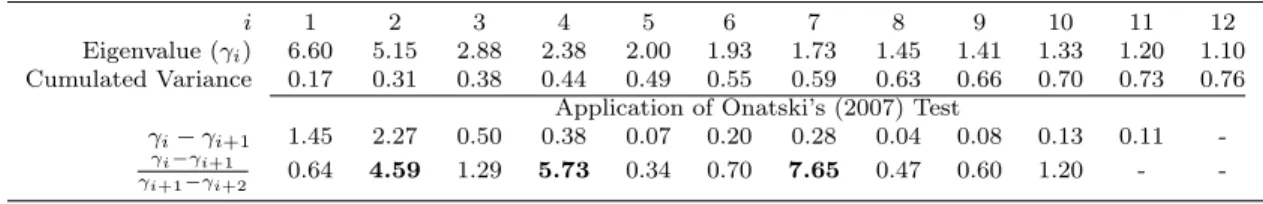
More extensive figures on the choice of the number of common factors and of the estimation are presented in Appendix A. The series we are considering have prior comunalities from 39% to 79%. The range for the numbers of factors in the literature is quite large. They can be as few as two, but also as large as seven, or even larger than ten in some applications in Finance (Onatski 2007). The scree plot (see Appendix) and the formal computation of the curvature of the plot, which is underlying Onatski’s (2007) test show that there exist breaks after the second, fourth and seventh eigenvalues. It cannot be excluded that four or seven factors would be necessary, even though the statistics of the corresponding test are generally smaller than the percentiles of the test statistics in Onatski (2007). The first two factors account for 31% of the overall variance, the first four for 44% and the first seven for 59%. Stock and Watson (2006), Favero, Marcellino, and Neglia (2005) and Breitung and Eickmeier (2005) quote that in comparable studies, the common component generally account for 40% or 50% or the overall variance. The variance explained by at least the first four factors is then in line with the literature.
The choice of the number of factors is crucial in our approach. The hypothesis of orthog-onality may fail, especially as we add more factors.7 On the contrary, accounting for too few factors might reduce the relevance of our counterfactual and thus the advantage of the method, compared to the basic setup. As we are probably more adverse to the choice of a too large number of factors than most of the literature, we will consider four factors as a fair compromise. However, the results with two and seven factors are quite similar.
1.2 Validity of the estimations
As quoted before, the basic setup is a generalization of the difference-in-difference methods that had already been used by Jacobson, LaLonde, and Sullivan (1993) and McCabe (2002). The use of factor models is an attempt to use the information included in the comovements of the series to build a more relevant counterfactual than the mere in-sample average inflation of each month. Conceptually, this approach is close to forecasting, as we are trying to build the best estimates of the inflation of series, given the in-sample movements of the series. Then, we are trying to determine if there are systematic differences in the deviations to the common component
6We are concerned by the fact that our factors are as precisely estimated as possible. However, one must keep in mind that the “now-casts” are not the primordial outputs of our procedure.
7This is likely to be the case when the evolution of prices in the sector is closely related to the evolution of prices, mainly for phase I mergers, see below.
close to mergers. The gains of factor models has been shown to be significant to forecast many macroeconomic variables of interest in the previously quoted literature. As far as we know, it is the first time this methodology is applied to generalize difference-in-difference methods by taking advantage of the dynamics of the data, in a framework where the information necessary to build a group of control is unavailable.
Even if we believe that the use of factor models is a new and important improvement to the methodology, our approach is still non-structural and does not allow to sort out the impact of mergers from other simultaneous factors or events. It has clear limitations that not only come from the limits of available data (see Data section) but also from our wish to get as general results as possible. The decision to apply a simple methodology may provide with strong external validity, but it comes at a price. We are not able to work at firm level, focus on manufacturing prices and are unable to implement the tools commonly used for evaluation problems.
There exists some evidence that consolidation through mergers may be the consequence of excess capacity (Andrade and Stafford 2004), which could be associated with a decrease in prices before mergers. Mergers could then at least partly be a consequence of this price pattern before the mergers. However, if the decision to merge is likely to be connected with the past evolution of prices, the exact date of the merger is also likely to be exogenous. It is subject to the existence of an opportunity for merger or acquisition and to the completion of preliminary steps as regards the financing of the operation, the agreement of both parties, etc. This is particularly the case for the largest mergers, often subject to in-depth scrutiny by competition authorities (phase II mergers, see below).
If the bias compared to other sectors did not change in the year after the merger for unob-servable reasons, the change in trends that occur at the dates of the mergers can be interpreted as a consequence of the mergers. Causal interpretation of the results would then rely on the assumption that the bias in sector-specific inflation is constant over the symmetrical two-year period around a merger. This is the very classical assumption that is common to any difference-in-difference method.
Interpreting this change in trend as the consequence of the modification of strategic relations between players would be fallacious if the average evolution of prices before a merger was due to the imminence of the mergers. This would for instance be the case if, on average, price decreases before a merger would be due to a price war aimed at lowering the price of the acquisition or to determine who buys whom. Overall, this strategy would be close to predation. The price of the target is linked to the beliefs of shareholders on the prospects of the firm: it would decrease only
if the price war did shift these beliefs. This strategy would require highly imperfect informational settings for stock or credit markets. Besides, in order to be profitable for the incumbent, the losses from the price war would have to be compensated by the lower acquisition price: short term profit sacrifice has to be recouped.
Causal interpretation would not be relevant either if the parties would try to alter the mar-ket assessment by Competition Authorities through a manipulation of their prices before the notification. Manipulation by the parties is a risk that is taken very seriously by competition authorities. For this reason, they require high standards of proofs. Our experience of their practices is that they would be very cautious if they faced a claim by the parties that a decrease in prices signals that the market has become very competitive. This claim would only be taken seriously if it were supported by substantiated elements showing, for instance, that the decrease in price is a consequence of entry or aggressive behavior by third parties.
As far as we know, few theoretical or empirical elements are available to confirm or invalidate that prices should, or could, generally vary due to the imminence of a merger in a magnitude liable to invalidate causal interpretations. For this reason, the price patterns we obtain be-fore mergers are, by themselves, very challenging. However, each time pre-merger prices were significantly increasing or decreasing, one should be cautious as regards causal interpretations.
2
Data
We use sector-specific production price indices for France for the manufacturing sector, on a monthly basis from 1989 to 2002. They are provided by the French National Institute for Statistics and Economic Studies (INSEE). The data about mergers is public. It comes from the Competition Directorate General of the European Commission and from the Directorate General for Competition, Consumption and Fraud Control of the French Ministry of Economy, Finance and Industry (DGCCRF).8 Cases reviewed by the European Commission are split between cases concerning primarily French markets and cases concerning mainly other European markets.
2.1 Mergers
Our list of mergers includes all merger cases controlled by French and European competition authorities. This dataset includes a code (CPF product classification) for the involved sector and specifies notification and decision dates, as well as the type of decision.
8
From 1986 to 2002, merging companies could notify their project to the DGCCRF, who was to run a preliminary competitive assessment within five weeks. After this initial analysis, it could either clear the merger (phase I) or request an opinion from the Conseil de la Concurrence for cases that might entail a risk of creation or reinforcement of a dominant position (phase II). Including the time for the in-depth analysis by the Conseil, the DGCCRF should then reach a final decision endorsed by the Minister in charge of the Economy within four month. This setting was modified in May 2002. Notification became compulsory above certain turnover thresholds (mainly 150 million euros aggregated turnover). This modification has drastically increased the number of notifications at French level.
European merger control was put into place by the European Regulation of the Council no 4064/89 of December 21 1989, which entered into force in 1990. All mergers with community dimension, for which several European countries were involved, and above certain turnover thresholds have to be notified to the European Commission. Within one month, the European Commission has to run an initial assessment (phase I). If no competitive concern emerge from this analysis, the merger is to be cleared. If not, an extra three-month period is added for in-depth analysis (phase II). The regime for European merger control changed in 2003, with the application of a new framework (Regulation 1/2003).
As we want to ensure some homogeneity in the control regime, we analyze mergers over the 1990-2001 period.9 Even though merger notification was not compulsory over the period under study, we believe that most important French mergers have been under scrutiny by competition authorities and are therefore present in our analysis.
It is important to stress that several types of mergers are present in the dataset. First, all mergers reviewed by French competition authorities correspond to mergers involving firms active on French markets. On the contrary, mergers reviewed by the European Commission all affect the Common Market, but, in practice, one or few markets in a few countries are generally primarily affected. Among all mergers controlled by the Commission, using several proxies10, it is possible to determine which ones primarily affected the French market, and which ones only affected it indirectly. We consider as a whole all mergers a priori primarily affected French markets, irrespective of the authority who actually took the decision. Conversely, cases that
9
As we are interested in prices one year before and after those mergers, the corresponding time span for prices is 1989-2002.
10
First, for some mergers, the nationality of the target firm is present in the DOME merger database. When this information is not available, we use the language of the decision, considering that when the decision was written exclusively in French, it was likely to concern the French market. The classification is however not perfect, since it could indeed primarily concern Belgium or Swiss markets, or cases where the acquiring firm is French, but the target is foreign. Then we supplemented the few cases written in several languages on a case by case basis.
primarily affected a non-French market in the European Community are also considered as a whole.
Secondly, some mergers are cleared after the initial analysis, while others are subject to an in-depth analysis. In our analysis, we separate the first ones, namely phase I mergers, and the second ones, namely phase II mergers. Mergers that appear prima facie as the most anti-competitive ones are expected to lead to phase II analysis. However, they also have been more severely scrutinized and the clearance was generally subject to commitments, such as divestitures. Therefore, their competitive impact is not clear.
Merger control has an obvious deterrent effect: mergers between two global leaders are gen-erally not even considered by the firms. It also acts as a filter. Some mergers go under scrutiny, and might be amended through remedies or even prohibited. In theory, it should therefore be impossible to observe anti-competitive mergers. Nonetheless, it is possible that merger control is not fully effective, and one should still expect to see some influence of mergers. Besides, merger control objectives are actually different from limiting short term market power. For instance, it takes into account efficiency gains in the longer run to authorize otherwise anticompetitive mergers. Even though the very existence of merger control ought to be kept in mind while interpreting our results, we should still expect to see some short term impacts of mergers on prices.
Overall, our dataset lists all mergers examined by the DGCCRF, the Conseil de la Concurrence and the European Commission between 1990 and 2001. Mergers have been split into four different categories: French merger phase 1, French merger phase 2, non-French merger phase 1 and non-French merger phase 2 (see tab. 1). For each merger, one or several sectors were affected. Then, counters were created for the number of mergers in a given month of a given year in each sector. The exact schedule of mergers is shown in appendix (see tab. 12 and 10). Some sectors are over-represented in our sample, and more mergers occurred in the end of the period. However, most sectors and most years are represented. Besides, no pattern of seasonality emerges (see tab.11).
Table 1: Number of mergers
Number of mergers
French mergers Non French mergers Phase I Phase II Phase I Phase II
All sample 166 27 416 35
Balanced sample 111 23 276 25
2.2 Prices
As stated before, we focus on producer prices only. Our dataset about prices comes from the underlying series of the Production Price Index in France. The data is more extensively pre-sented in appendix. Our dependent variable is producer price indices at a 4-digit level of the product classification. 4-digit level has been chosen as the relevant trade-off between precision and aggregation. On the one hand, if price data is too aggregated, it will be hard to measure any specific effect of a merger affecting a small part of the sample. On the other hand, the affected sector, coming from merger data, is not always precisely identified. The relevant market con-sidered by competition authorities is in general much smaller than the product sector identified within the classification of products: in this respect, the deeper the level of the classification the better. Unfortunately, our experience shows that there may be some errors or mismatches in the coding made by the competition authorities when they define the involved sectors. It is also possible that the competitive impact of a merger extends to adjacent sectors.
Our series of price indices cover the 1989-2002 period. 93 sectors are present at the end of the period. 63 sectors are covered during the whole period, many sectors being added to the survey in 1995. The total number of observations used in regression analysis is 9072 for the balanced sample (11006 for the overall one). Before standardization to zero mean, the average monthly inflation in the overall set is 0.074% per month (0.8% per year), with a montly volatility of 0.65%.11 The residual of the first four factors has a slightly smaller standard deviation of 0.60%. The figures are very close for the balanced set.
11
The variables of interest are multiplied by 100 in order to be interpreted as percentages of variations of prices (at first order, log differentiate price indices corresponds to the relative variation).
3
Pattern of price around mergers
We regress the residual of the common factors on merger counters. As stated before, we treat identically all mergers that received the same treatments by Competition Authorities. We split the four types mergers and estimate in the same regression the four setsαkF rench P I,αkF rench P II,
αkN onF rench P I,αN onF rench P IIk fork=-11 to 12. To understand the influence of the use of factor model, we also estimate the simpler setup and will discuss the differences at the end of this section.12 The sets ofα
kare used to build a pattern of prices for each type of mergers (reference
for prices is set to 100 to the date of decision). They also allow to test the significance of the average slopes before and after mergers (P0
k=−11αk and P12k=1αk) as well as their differences.
In the presentation below, we will first focus on French mergers and then on the non French.
Several mergers may occur in the same market at different dates. The effects of mergers are assumed to be additive and cumulative. This is the only viable hypothesis in the absence of a history of mergers in these markets. It is then consistent to consider the number of mergers in one market, rather than a dummy, in the few cases where several mergers are notified, in the same month, in the same market. The coefficients αk correspond to the impact of one merger
on the monthly inflation rate. In the case of two mergers taking place in the same month, the market is assumed to have received the “treatment” twice.
Mergers in our dataset were firstnotified, then subject to control by competition authorities (either French or European) and at lastauthorized13. We assume that the incentives to compete
for the incumbents are likely to change just after the mergers. The exact date of this change in the incentives to compete is unclear. We expect that it will have occurred once the merger has been authorized. However, if the firms and its competitors anticipate that the merger will be cleared, it might also have changed when the project of merger was made public, namely when the notification was issued.
For most mergers, the authorization is issued within four or five weeks after notification and both dates are quite close. However, some mergers are subject to in-depth analysis that delays the final decision of about three more months (see Data section). We will estimate one coefficient for each month before and after the mergers. All our specifications are quite flexible and the choice of the time reference is secondary.14. As stated before, there might be some leakage in the
12In line with Jacobson, LaLonde, and Sullivan (1993), an alternative specification with linear trends by sector for monthly inflation has been explored. This would correspond to an acceleration of prices during the period. The results were not qualitatively affected.
13
As we are interested on the effects of merger on prices, we consider only authorized mergers. Prohibited mergers, which are extremely rare anyway, are discarded from the analysis.
incentives to compete before the final decision of approval is reached. However, we will set the date of authorization of the mergers as the date of reference. The patterns of prices we obtain will confirm the relevance of this intuition, since the change in trends seems quite close to this date.15
3.1 French mergers
3.1.1 Phase 1 mergers
Figure 1 shows the pattern of price in France after a French phase 1 merger. The pattern is quite flat, and no clear break in prices emerges. Prices are neither significantly increasing after mergers, nor decreasing before. Overall, there exist no break of prices around phase 1 mergers. The fact that no impact can be attributed to mergers does not mean that these mergers are not related to price movements. As we will see latter by comparing the results of our methodology with the basic setup, when mergers occur, the inflation pattern significantly differs from the average monthly inflation rates.
Some sectors might be more prone to price increases, even for “small” mergers. Mergers would then have heterogeneous impacts on prices given the characteristics of the mergers and of the merging firms. The fact that no clear pattern emerges may be a consequence of this very important heterogeneity. To study its sources, we split the sectors into several groups in order to study the differential impacts of mergers on these groups.
Given the relatively small size of our sample, it is not possible to discriminate sectors on a large number of characteristics. However, it is possible to look separately at the impact of mergers on two subgroups split given one characteristic. We will focus on five different characteristics.16
The first one is a concentration ratio computed as Herfindahl-Hirschman Index (HHI) at sector levels. The second one is an indicator of the stability of market shares of firms (steadiness). It averages the squares of the variations of markets shares of firms between two successive years. A market is more steady if the market shares are very stable. Steadiness is negatively correlated with concentration: if a market is atomistic, concentration is low and market shares variations are likely to be small, in absolute term. The third indicator is growth. It is built as the difference of the logs of overall turnover. This accounts for short term growth and not during the whole period. The fourth one is the share of groups (in turnover). The last is the openness of the
15Besides, the results are qualitatively similar with the notification date as a reference. It mainly makes a small difference for phase II mergers, for which the two dates are quite different and the pattern indeed shows a delay in the increase of prices.
16
Figure 1 : French phase 1 mergers - residual of the four main factors
French phase I mergers (Residual of the four main factors)
98,5 99 99,5 100 100,5 101 101,5 102 -12 -10 -8 -6 -4 -2 0 2 4 6 8 10 12 Time Price
Note: Period: 1990-2001. Number of observations: 9072. Number of sectors: 63. Number of concentra-tions: 111. Plain line is the estimated pattern using the residual of the four main factors. The dashed lines delineate the 95% intervals. Prices are fixed to 100 at the date of the decision.
market. It is the share of imports and exports compared to turnover. Practically, we will for instance estimate in the same equation one set of coefficient for the most concentrated sectors one year before mergers, and another one for the least concentrated ones.
The results provide interesting insights on the sources of heterogeneity but should be inter-preted cautiously. First, the results are univariate. For instance, declining industries are likely to have specific, unobserved, characteristics. These results are thus solely descriptive. Besides, all variables are not available for the exactly the same sectors or time periods.17 Balancing the data for the four treatments would have significantly reduced the size of our panel. Thus, each treatment relies on slightly different samples. Stricto sensu, only pairwise comparison, eg. between most and least open markets, is reliable. At last, splitting the sectors into two groups significantly reduces the number of mergers in each group and hence the precision of the esti-mations. Table 4 in appendix summarizes the number of cases in each groups and the overall numbers of observations in each treatment.
17
For instance, we do not have market shares for year 1988 and are thus unable to compute our indicator of steadiness for 1989.
The results for French phase 1 mergers are presented in appendix. Neither openness, growth or the share of groups make a difference. On the contrary, an inflationary pattern emerges in the least concentrated markets and in the more steady. As steadiness and concentration are negatively correlated, it is hard to separate both results. However, the fact that a break exists for the least concentrated markets, but not for the most concentrated ones is striking. One should a priori expect the opposite result. However, concentration is a proxy that is used by competition authorities. There are more French phase 1 mergers in least concentrated sectors. The selection of phase 2 mergers by competition authorities is likely to play an important role in this result.
3.1.2 Phase II mergers
Figure 2 shows the pattern of price in France after a French phase 2 merger. It is a clear pattern, with no clear relative inflation of prices before mergers, and a noticeable one just after. The change is quite close to date zero, confirming the relevance of the choice of the date of decision as the reference date. The absence of significant price changes before these mergers speaks in favor of a causal impact. Phase II mergers occur between very significant players at national and even European levels. These firms often have multiple and multinational activities. Besides, the number of players being smaller, the matching of two firms is likely to be the consequence of many other factors than short term price movements of prices in one French market. Therefore, the endogeneity of prices for phase 2 mergers is less likely than for phase 1 mergers. Then, irrespective of the control and of the in-depth inquiry, phase 2 mergers would have short-term anticompetitive effects, the subsequent additional inflation being of 1.5%. Short term impact of these mergers is unambiguous.
However, our results can hardly be interpreted as a proof of the inefficiency of merger control. We voluntarily focused on short term, in order to capture the pure modification of strategic relations implied by mergers. Both efficiencies and commitments will have mid-term effects we are unable to capture. We are neither able to measure which effect dominate in the long run. The overall impact of mergers could only be measured then, as well as the direct efficiency of merger control18. However, our results show that, as far as strategic relations are concerned, the expected effect does exist and is of importance: it is twice the average yearly inflation in our sample.
The impact of these mergers might also be heterogeneous. The choice of competition
authori-18
Merger control also have the indirect effect to act as a deterrent for clearly anticompetitive mergers, such as one between two global leaders.
Figure 2 : French phase 2 mergers - residual of the four main factors
French phase II mergers (Residual of the four main factors)
98 98,5 99 99,5 100 100,5 101 101,5 102 -12 -10 -8 -6 -4 -2 0 2 4 6 8 10 12 Time Price
Note: Period: 1990-2001. Number of observations: 9072. Number of sectors: 63. Number of concentra-tions: 23. Plain line is the estimated pattern using the residual of the four main factors. The dashed lines delineate the 95% intervals. Prices are fixed to 100 at the date of the decision.
ties to enter into phase 2 analysis in itself provides some reduced information on their assessment of the anticompetitive potentials of mergers. As previously, we pursue a differential analysis. Given the small number of cases, some results are hardly interpretable (especially for growth). The results of this analysis for French phase 2 mergers is presented in appendix. They confirm that there exist a very large discrepancy in the impact of these a priori most anticompetitve mergers.
The impact is very important for markets with very stable markets shares (least steady). These markets are prima facie the least contestable ones. Intuitively, mergers should, on average, be more anticompetitive in these markets. This is confirmed by the regression. On the contrary, the significance of results as regards to concentration is weak. It is unclear that concentration plays a major role. The break is larger and significant for the least concentrated markets only. The pattern is close to this of phase 1 mergers, in the least concentrated markets also, with prices weakly decreasing before and increasing after. However, the pattern after mergers is significant only for the most concentrated markets. The selection operated by competition authorities or the self-selection by merging firms are also likely to play a role. Very large mergers in highly
concentrated sectors are less likely to be cleared. If they are notified, they are likely to have special features.
Besides, the pattern of prices only appears in markets with a high proportion of groups. Groups are likely to have multiple activities, and then to interact with the same competitors in different markets. This is expected to favor very grim trigger strategies, and thus collusion. Overall, the effect of mergers should be more important if there is a higher proportion of groups.
The results as regards openness are striking and complement the latter, as groups are more likely to be active on international markets. Very open markets may indicate that the relevant market is multinational or continental. There may exist a European wide oligopoly (and concen-tration in France only is not a relevant proxy). It may also indicate that transportation costs are low and that foreign firms are an effective alternative to French firms. On the contrary, firms operating in less open markets would not be threatened by foreign firms and mergers would potentially be more anticompetitive. The result rather speak in favor of the first interpretation, at least for phase 2 mergers, as the inflationary pattern emerges in the most open markets only. On the contrary, the pattern in the least open markets indicate a clear increase of prices that is stopped by the mergers. Self selection is likely to matter for these results. On average, these mergers are probably triggered by other purposes than evading from competition. Besides, the differences in patterns also indicate that the results as regards to the proportion of groups and openness where not solely driven by the correlation between the two features.
3.2 Non French mergers
3.2.1 Phase I mergers
We then focus on the impact of non French mergers on French prices. Figures 3 shows the pattern of price in France after a non-French phase 1 merger. From a legal perspective, the fact that these mergers were controlled by the European institutions indicates that the common market was judged to be affected. It is thus legitimate to focus also on the impact of these mergers on French prices, even if French markets were not concerned in the first place. Examining the consequences of foreign mergers in economically connected area had not been done before. Contrary to the situation for French mergers, prices are clearly increasing before the merger, and are decreasing after. This pattern of prices is rather striking. As far as we know, it had never been quoted in the literature and it is a significant contribution of this paper. Focarelli and Panetta (2003) analyzed the impact of “out-of-market mergers”. However, in this paper the effect of mergers in markets where there existed no overlap emerge after a certain period and is
convincingly interpreted as efficiency related. Here, the effect emerges on short-term and should be explained otherwise. A merger between two foreign firms might for instance be threatening for French firms if it allows them to efficiently enter or compete in France.
Figure 3: Non French phase 1 mergers - residual of the four main factors
Non French phase I mergers (Residual of the four main factors)
98,5 99 99,5 100 100,5 101 101,5 102 -12 -10 -8 -6 -4 -2 0 2 4 6 8 10 12 Time Price
Note: Period: 1990-2001. Number of observations: 9072. Number of sectors: 63. Number of concentra-tions: 276. Plain line is the estimated pattern using the residual of the four main factors. The dashed lines delineate the 95% intervals. Prices are fixed to 100 at the date of the decision.
The results of the differential analysis for non French phase 1 mergers is presented in appendix. All patterns are qualitatively similar: prices are decreasing before mergers, and decreasing after. They are all significant, probably due to a larger number of cases than for French mergers.
Splitting sectors into two groups mainly makes a difference for concentration and openness only. Quite intuitively, the effect on French prices of a merger abroad has a larger impact if markets are more open. At last, the fact that the break is larger in more concentrated markets confirms that mergers abroad act as a threat to French firms.
The comparison of the impact of French and non French phase 1 mergers raises questions as to their joined external validity. It could be the case that “not too anticompetitive” mergers do not harm domestic customers and are beneficial to those abroad. Overall welfare impact of those mergers would then be positive. On the contrary, mergers may not be comparable for they would not affect markets with identical histories or because they would affect them at
different moments of their histories. A French specificity could not be excluded a priori either. This would be the case if foreign mergers that were beneficial to French customers actually took place in formerly very regulated or foreclosed sectors. The differential analysis above provide some interesting insight. However, the answer to this question of the overall impact of mergers in interconnected areas is essentially left open for further research at this stage. Deeper analysis on the exact schedule of mergers in France and in Europe and some case studies would provide some insight on this issue. However, only similar and crossed analysis in other European countries and in the USA are liable to provide a convincing answer.
3.2.2 Phase II mergers
Figure 4 shows the pattern of prices in France after a non French phase 2 merger. Prices are in constant progression on the period. Our series are standardized to zero mean on the period. Thus, this constant progression does not reflect aconstant progression over the period, but indeed a progression around the merger. The progression is significant before mergers, but not after. Overall no break of trend around the merger emerges.
Figure 4: Non French phase 2 mergers - residual of the four main factors
Non French phase II mergers (Residual of the four main factors)
98,5 99 99,5 100 100,5 101 101,5 102 -12 -10 -8 -6 -4 -2 0 2 4 6 8 10 12 Time Price
Note: Period: 1990-2001. Number of observations: 9072. Number of sectors: 63. Number of concentra-tions: 25. Plain line is the estimated pattern using the residual of the four main factors. The dashed lines delineate the 95% intervals. Prices are fixed to 100 at the date of the decision.
The results of the differential analysis are presented in appendix. Results for steadiness are hardly interpretable as only four European mergers occur in the most steady markets. The pattern in least concentrated markets is similar to this for French phase 1 mergers. The break is even more important.
The pattern for declining and most growing industries are opposed. In declining industries, price increases are clearly stopped by foreign mergers. On the contrary, in the fastest growing industries, no pattern emerges before mergers, but prices burst just after foreign mergers. If sectoral growth in France is correlated to growth in other countries, this would indicate that defensive mergers have very different impact than offensive ones. However, these differences of patterns do not emerge for French mergers.
As stated before, less open markets are less likely to be European wide. Then, a foreign merger is more likely to be threatening for French firms. This is consistent with the decreasing pattern in least open markets. This decreasing pattern only exists in markets with a larger proportion of groups. If the previous result is true, this would indicate that groups are more likely to be threatened than standalone firms.
3.3 On the impact of the counterfactual
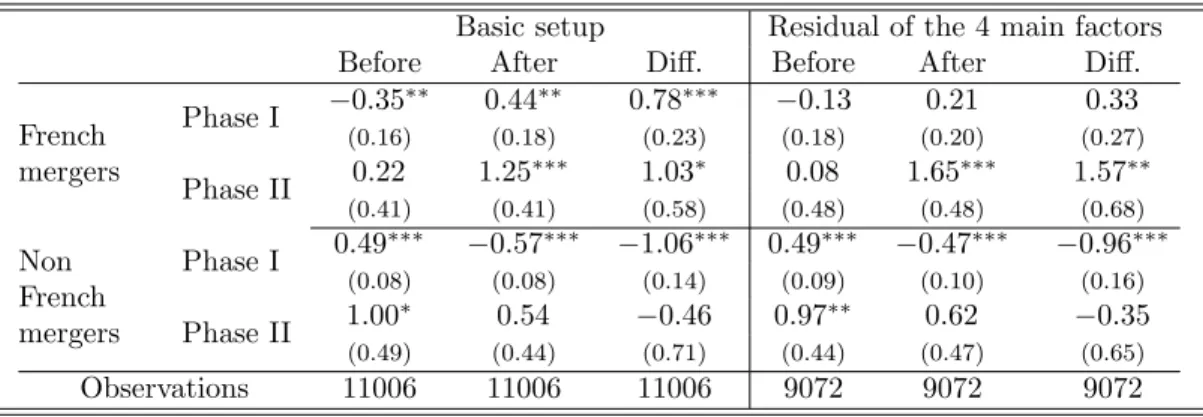
Table 2 summarizes the results of our methodology for the four types of mergers. It also includes the results with the basic setup, where the inflation is compared to the average monthly inflation. This table shows that the use of factor models dramatically corrects the pattern for French phase 1 mergers. No significant break in the pattern emerges in our methodology. On the contrary, comparing with the average monthly inflation rates, prices were clearly decreasing before and are increasing after. The difference between the two setups is not due to the fact that the set has to be balanced to estimate the common factors.19 It is unlikely to be due to the set of sectors we consider, as the results for the other types of mergers are quite close for both setups.
By definition, non French mergers concern non French firms, and primarily non French mar-kets. They should not be triggered specifically by French prices. Similarly, as argued before, French phase 2 mergers are unlikely to be mainly triggered by short term price changes in one particular market. Overall, French phase 1 mergers are thus those for which prices are likely to be the more connected to merger activity.
There are weak evidences of a negative slope just before mergers in the basic setup. It is in line with McCabe’s (2002), and there already exists some evidence that consolidation through
19
Table 2: Patterns of prices for phase I and phase II mergers
Basic setup Residual of the 4 main factors Before After Diff. Before After Diff.
French mergers Phase I −0.35 ∗∗ 0.44∗∗ 0.78∗∗∗ −0.13 0.21 0.33 (0.16) (0.18) (0.23) (0.18) (0.20) (0.27) Phase II 0.22 1.25 ∗∗∗ 1.03∗ 0.08 1.65∗∗∗ 1.57∗∗ (0.41) (0.41) (0.58) (0.48) (0.48) (0.68) Non French mergers Phase I 0.49 ∗∗∗ −0.57∗∗∗ −1.06∗∗∗ 0.49∗∗∗ −0.47∗∗∗ −0.96∗∗∗ (0.08) (0.08) (0.14) (0.09) (0.10) (0.16) Phase II 1.00 ∗ 0.54 −0.46 0.97∗∗ 0.62 −0.35 (0.49) (0.44) (0.71) (0.44) (0.47) (0.65) Observations 11006 11006 11006 9072 9072 9072
Note: Robust OLS estimators. In parenthesis: t-stats. 3, 2 and 1 stars respectively mean 99, 95 and 90 percent significance for a bilateral test. Before, After and Differences respectively stand forP0k=−11αk, P12
k=1αk and
P12
k=1αk−
P0
k=−11αk. French mergers phase I: 166 (111 for the balanced set). French
mergers phase II: 27 (23 for the balanced set). Non French mergers phase I: 416 (276 for the balanced set). Non French mergers phase I: 35 (25 for the balanced set).
mergers may be the consequence of excess capacity (Andrade and Stafford 2004), which would be consistent with a decrease in prices in these sectors. However, this pattern does not emerge if we account for a richer counterfactual. Then, the pattern before mergers would not be related to the mergers, but would be captured by the movements of the common factors at this moment. The use of factor models does make a difference. These mergers occur in sectors that are affected by different shocks than the average of the sectors but these shocks are shared by other sectors. They are not consequences of mergers and are on the contrary explained by factors that also affect other sectors. This pattern in the basic setup is then very challenging in itself. Understanding more precisely the asymmetric shocks that affect, and possibly trigger, mergers is out of reach with the kind of data at our disposal but it would be essential in understanding merger activities.
Conclusion
We find strong evidence of very short term effects of mergers on prices. As far as we know, such results, on such a large number of mergers and sectors are new. The interpretation of these results may be twofold. The first, conservative one, is that price changes before mergers are driven by the imminence of the mergers. At least one party to the merger would manipulate its price, for instance either to pay a lower price for an acquisition or to obtain a more lenient assessment by competition authorities. The second, optimistic, interpretation is that these types of behaviors are unlikely to be widely spread. The patterns of prices should then be interpreted
as a causal impact of mergers on strategic relations, and then on prices. As far as we know, no general existing empirical evidence is liable to allow to convincingly choose between the two interpretations. Therefore, prices before mergers, and not only after, are a very challenging line of research. However, for French mergers, no pattern emerge before the mergers if we use the richer counterfactual provided by factor models. Then, it would support the absence of strong endogeneity of prices, at least for these mergers.
Longer term effects of mergers include changes in product qualities, economies of scale and scope and many other sorts ofefficiencies. These efficiencies may be very important. They may even, in some industries, overturn the effect we focus on (Focarelli and Panetta 2003). However, our results on French mergers show that strategic relations do matter for prices, whatever the interpretation one chooses. We also show that, on average, mergers that are notified to competition authorities, especially phase II mergers, do decrease the incentive to compete for domestic firms. As far as merger control is concerned, case by case analysis is the only reliable way to proceed. Competition authorities shall be specific on the theories of harm they use. The burden to substantiate the analysis is on them. Mergers that do not generate efficiencies are then very unlikely to increase consumer welfare. Competition authorities are then legitimate to require the proof of substantial efficiency gains, with a high standard of proof, in order to clear a merger.
As far as we know, our results on non French mergers are also new, as well as the differen-tial analysis we pursue. Their robustness is to be confirmed by further research on different countries, and on different data. At this stage, they mainly confirm the large heterogeneity of the impact of mergers on prices. However, they draw an interesting picture. First, mergers in an interconnected economic area have some indirect impact in domestic markets. This impact might be positive for final customers. Overall, this seems to be the case forprima facie not too anticompetitive mergers. Would the joined external validity of results for domestic and foreign mergers be verified, which is, at this stage, an open question, the overall welfare effect of these mergers would then be an interesting issue, to be addressed in further research. On the contrary, these mergers may also have effects similar to those of domestic mergers, for instance if they reinforced an oligopoly in a relevant market that was larger than France.
At last, the methodology used in this paper is new. It provides with a way to build a relevant counterfactual in a difference-in-difference framework, when the usual tools from the evaluation literature are not available. The fundamental assumption is that market prices are affected by common factors that are orthogonal to mergers. These common shocks are identified using the panel structure of the data. This paper shows that the use of this counterfactual makes a difference. This is particularly true for French phase 1 mergers, which are exactly those for
which French prices and mergers are the more likely to be connected. These results are very promising for the methodology developed in this paper.
References
Altissimo, F., A. Bassanetti, R. Cristadoro, M. Forni, M. Hallin, M. Lippi, L.
Re-ichlin, and G. Veronese (2001): “EuroCOIN: A Real Time Coincident Indicator of the
Euro Area Business Cycle,” CEPR Discussion Papers 3108, C.E.P.R. Discussion Papers.
Andrade, G.,andE. Stafford(2004): “Investigating the economic role of mergers,”Journal
of Corporate Finance, 10(1), 1–36.
Bai, J. (2003): “Inferential Theory for Factor Models of Large Dimensions,” Econometrica,
71(1), 135–171.
Bai, J., and S. Ng (2002): “Determining the Number of Factors in Approximate Factor
Models,”Econometrica, 70(1), 191–221.
(2004): “A PANIC Attack on Unit Roots and Cointegration,” Econometrica, 72(4), 1127–1177.
(2006): “Confidence Intervals for Diffusion Index Forecasts and Inference for Factor-Augmented Regressions,” Econometrica, 74(4), 1133–1150.
Biscourp, P., X. Boutin, and T. Verge (2008): “The Effects of Retail Regulations on
Prices: Evidence fron French Data,” mimeo.
Boivin, J., and S. Ng(2006): “Are more data always better for factor analysis?,” Journal of
Econometrics, 127(1), 169–194.
Breitung, J., and S. Eickmeier (2005): “Dynamic factor models,” Discussion Paper Series
1: Economic Studies 2005,38, Deutsche Bundesbank, Research Centre.
Bresnahan, T. F.(1989): “Empirical studies of industries with market power,” inHandbook of
Industrial Organization, ed. by R. Schmalensee,andR. Willig, vol. 2 ofHandbook of Industrial Organization, chap. 17, pp. 1011–1057. Elsevier.
Competition Commission (2007): “Groceries Market, Emerging thinking report,” Report,
Cornec, M., andT. Deperraz(2006): “Un nouvel indicateur synth´etique mensuel r´esumant
le climat des affaires dans les services en France,” Economie et Statistique, 395-396, 13–38.
Cristadoro, R., M. Forni, L. Reichlin, and G. Veronese (2005): “A Core Inflation
Indicator for the Euro Area,” Journal of Money, Credit and Banking, 37(3), 539–60.
Croux, C., E. Renault, and B. Werker (2004): “Dynamic factor models,” Journal of
Econometrics, 119(2), 223–230.
Del Negro, M., and C. Otrok (2004): “Dynamic Factor Models with Time-Varying
Para-meters,” mimeo.
Doz, C., and F. Lenglart (1999): “Analyse factorielle dynamique: test du nombre de
facteurs, estimation, et application a l’enquete de conjoncture dans l’industrie,” Annales d’´economie et de statistique, 54, 91–127.
Duso, T., K. Gugler, and B. Yurtoglu (2005): “EU Merger Remedies: A Preliminary
Empirical Assessment,” Cic working papers, Wissenschaftszentrum Berlin (WZB), Research Unit: Competitiveness and Industrial Change (CIC).
Duso, T., D. J. Neven, and L.-H. R¨oller (2003): “The Political Economy of European
Merger Control: Evidence using Stock Market Data,” Discussion paper, WZB.
Evans, W. N., L. M. Froeb,andG. J. Werden(1993): “Endogeneity in the
Concentration-Price Relationship: Causes, Consequences, and Cures,” Journal of Industrial Economics, 41(4), 431–38.
Favero, C. A., M. Marcellino,andF. Neglia(2005): “Principal components at work: the
empirical analysis of monetary policy with large data sets,”Journal of Applied Econometrics, 20(5), 603–620.
Focarelli, D., and F. Panetta (2003): “Are Mergers Beneficial to Consumers? Evidence
from the Market for Bank Deposits,” American Economic Review, 93(4), 1152–1172.
Forni, M., M. Hallin, M. Lippi,andL. Reichlin(2000): “The Generalized Dynamic-Factor
Model: Identification And Estimation,”The Review of Economics and Statistics, 82(4), 540– 554.
(2003): “Do financial variables help forecasting inflation and real activity in the euro area?,” Journal of Monetary Economics, 50(6), 1243–1255.