PROJECT REPORT
Candidate Number:
484182
MSc CEH
Title:
Screening for Visual Impairment
and Diabetic Retinopathy
amongst Diabetics in the
Diabetes Association in
Petauke District in Zambia
Supervisor: DR Daksha Patel Word Count: 9,014
Project Length: Standard
Submitted in part fulfillment of the requirements for the degree of MSc in Sept. 2008
2
Contents
ABREVIATIONS ... 5 Dedication………..4 Acknowledgements………..5 Abbreviations……….6 ABSTRACT ... 6Aim of the study: ... 6
Background ... 7
Epidemiology of diabetes ... 8
Diabetes in developing countries ... 8
Blindness due to diabetes ... 9
Prevalence of Diabetic retinopathy ... 10
Risk factor for diabetic retinopathy ... 11
Classification of Diabetic Retinopathy ... 11
Screening for diabetes retinopathy ... 12
Treatment for diabetic retinopathy ... 14
Diabetes in Zambia ... 14
Diabetes Association of Petauke ... 15
Rationale ... 16
Aim of the study ... 16
Objectives ... 16
Type of study design ... 17
Data collection method ... 18
Quantitative data ... 18
Qualitative data ... 18
Data analysis ... 20
Ethical consideration: ... 21
Consent ... 21
patients flow during the study . ... 22
Data analysis ... 23
Quantitative data ... 24
Ocular examination results ... 30
Visual acuity ... 30
Distribution of Causes of poor visual acuity ... 31
Fundus examination results ... 32
Diagnosis of the ocular pathologies ... 33
Qualitative data analysis ... 19
Qualitative data results ... 39
Patients’ Knowledge and experience ... 39
Expectations at the hospital ... 40
Blood sugar test at the Hospital ... 40
Diabetic Health education and promotion ... 40
Limitation of the study ... 49
Conclusion ... 50
Recommendations ... 51
3 Dedication
4
Acknowledgements
My sincere gradititude to the following, for having given me the opportunity to be a student of LSHTM:
1. UK Department for International Development Shared Scholarship Scheme Award
2. The British Council for the Prevention of Blindness Boulter Fellowship
3. International Students House Accommodation scholarship
4. International Federation of Ophthalmological Societies
Sincere gratitude is due also to Dr Daksha Patel for all the efforts that was put in as my supervisor
Thanks to the entire team of ICEH for showing me “what it is to work with the eye programme.”
MSc CEH class of 2008 you were great
Friends of London that offered encouragements
Thanks to my family for allowing me to be away from home
Last, but no the least, thanks a lot to St Francis’ Mission Hospital for the support as my employer
5
ABREVIATIONS
BMI- Body Mass Index
CDR- Cup Disc Ratio
CI- Confidence Interval
HAART- Highly Active Anti-Retroviral Treatment
HTN- Hypertension
IOP- Intra Ocular Pressure
LE- Left eye
MD- Medical Doctor
P- P-Value
PDA- Petauke Diabetes Associatio
RE- right eye
SD- Standard Deviation
Sqcm- square centimeters
6
ABSTRACT
Aim of the study: The aim of the study is to evaluate the presence and presentation of diabetic retinopathy and initiate creation of the diabetic data-base
Objectives: To describe visual acuity and visual impairment of the diabetics and estimate the distribution of diabetic retinopathy, identify some risk factors, experiences in the control, managing and knowledge about diabetic eye diseases and to initiate the development of data base amongst the members of the diabetes association.
Results: A total of 112 (80%) patients out of 140 members of the PDA were studied. In the study group, 55% (62/112) were females and 45% (55/112) males. Their mean age was 53.07years (SD of 14.6, min. 17 to 85 max. years). Normal VA was in 82.1% (92/112) while general blindness in 7.1% 8.2% (RE,LE), visual impairment 9.0%,8% (RE,LE), Severe Visual impairment 1.8%,0.9% (RE,LE). Causes of poor vision were cataracts 17% (38/224), refractive error 11.6% (26/224), 4.5% diabetic retinopathy and corneal scar 1.3%. Risk for DR were BMI and lens status p=0.012, p=0.010 (RE,LE), BMI and gender p=0.010, Duration and fundus RE p=0.034. Duration and HTN p=0.028. Diabetes health education, supply of insulin, nutritional guidance and support and technical support and supplies need to be strengthened.
Conclusion: Diabetes has affected the young and most economically active age groups. Poor vision was due to refractive error, cataract, diabetic retinopathy, and corneal opacity. The majority of the diabetics had normal fundi while 4.5% eyes (5.4% individuals) had diabetic retinopathy. There is need to strengthen health education technical and nutritional programs.
7
Screening for Visual impairment and diabetic retinopathy amongst
diabetics in the diabetes association in Petauke District in Zambia
Background
Diabetes is beginning to receive more attention as the mortality rate due to this silent, chronic and yet debilitating disease is as high as annual mortality rates due to HIV and AIDS. For example in 2007, it was estimated the diabetes was responsible for 3.6 million deaths globally, a figure which is equivalent to 6% of the world’s mortality. In addition there are concerns about the complications and co-morbidities of diabetes. 1 The revised World Health Organisation definition of diabetes is given as an overnight fast blood glucose concentration of more than 7.0mmol/l (126mg/dl) or plasma glucose of more than 7.0mmol/l after 2hours of oral ingestion of 75mg of glucose dissolved in 250 to 300ml of water for adult and for children after ingestion of a glucose solution of 1.75mg of glucose/kg weight.
There are three main types of diabetes mellitus of interest in ophthalmology. Diabetes mellitus type 1: juvenile diabetes or early on-set diabetes also previously known as Insulin dependant diabetes mellitus (IDDM), and which usually has a childhood to young adults’ onset. This is primarily due to pancreatic islet-beta cell destruction and the patients are prone to ketoacidosis. Type 2 diabetes, results from defect(s) in insulin secretion and has adult on-set, usually after the age of 40, this was previously known as non insulin dependant diabetes mellitus (NIDDM). Type 2 diabetes is responsible for 90-95% of diabetes cases. The other type of diabetes of medical importance is gestational diabetes which appears in some susceptible pregnant mothers. This could be noted as a high fasting glucose level in pregnancy (Gestational Diabetes mellitus) or a high 2 hours post prandial glucose levels (Gestational Impaired Glucose Tolerance, GIGT). It is recommended that fasting and 75mg glucose tolerance tests are repeated six weeks
8
after delivery of pregnancy to see if the individual still remains diabetic or still has glucose impaired test or converts to normal blood glucose.2
Epidemiology of diabetes
According to the World Foundation of Diabetes publication, in 2006 there were about 230 million people, 6% of adult population, world wide affected by diabetes. Each year 6 million people develop diabetes.
The global prevalence of diabetes for adults with age more than 20 years was estimated to be 2.8% in 2000 and projected to almost double to 4.4% by 2030. 3
The World Foundation of Diabetes report states that diabetes mellitus was at one time regarded as “a disease of the rich” that occurs in western countries and in reality, it is observed that more than three quarters of diabetic related mortalities occurs in low and middle income countries. Similarly, type 2 diabetes was regarded as a mild condition that does not kill, yet evidence shows that every ten second a person dies from diabetes related condition and complication. In poor countries this happens at a higher rate because of delay in diagnosis of diabetes and in some instances a lack of both trained medical staff and medical infrastructure. 4
Diabetes in developing countries
Globally it is anticipated that the number of people with diabetes will increase from 246 million to 380million by the year 2025.and the largest increases in diabetes prevalence will take place in developing countries.
About 80% of the diabetic persons live in the low and middle income countries. Most of these are between the ages of 45 to 65 years and they represent a very productive segment of the economy in these societies. “Diabetes deaths are likely to increase by more than 50% in the next 10 years without urgent action.” 2
9
alarming news and calls for medical action. In the world’s developing countries diabetes type 2 is increasing rapidly. This is mainly associated with rapid cultural changes, aging population, increased urbanization, dietary changes, decreased physical activities and other unhealthy life styles and behavioural patterns. Seven out of the ten worlds leading countries with highest number of people with diabetes are in developing countries, India has the highest population of these (95million living with diabetes).
Africa has not been spared from this phenomenon of rapid increase in diabetic patients. About 10.4 million Africans have diabetes (3.1% of the adult population) and 24.2 million have glucose intolerance which can lead to diabetes. 5
Blindness due to diabetes
Blindness is one of the complications of diabetes, This is due to either the growth of new vessels, neovascular proliferation, leading to intraocular haemorrhage and possible retinal detachment with profound visual loss, or due to localized damage to the macular / fovea of the eye with loss to central visual acuity. In Africa it appears that at diagnosis 21 to 25% of type2 and 9.55% of type1 diabetic patients have retinopathy. 6 The world Health Organization estimates that 4.8% blind people world wide is blind due to diabetes retinopathy.
It does seem likely that blinding diabetic eye disease is now the fourth major cause of blindness worldwide, after cataract, the glaucomas and trachoma. This change is due to the reduction of blindness due corneal opacities, the aging population of the world and some improvement in health care systems in many developing countries.
10
Prevalence of Diabetic retinopathy
Diabetes retinopathy is an important cause of blindness. After 15 years of diabetes approximately 2% of the people becomes blind and about 10% develop severe visual impairment. 7
In a population based study of 996 type1, insulin taking, diabetic individuals in Wisconsin, United States of America, in 1980-1982. The prevalence of retinopathy after 5 years and 15 years from the on-set of diabetes was 17% and 97.5% respectively. Proliferative retinopathy was in 1.2% and 67.5% of persons with less than 10 and 35years or more duration of diabetes respectively. 8
11
Risk factor for diabetic retinopathy 9
Table 1 shows some common factors for diabetes retinopathy. Table1. Risk factors for diabetic retinopathy
Classification of Diabetic Retinopathy
Two approaches to classification have emerged. Those designed to cover the full range retinopathy aimed at Ophthalmologists and are based on the Airline House Study and later Early Treatment of Diabetic Retinopathy Study (ETDRS) and those which are proposed to be used in population screening sessions.
For the ETDRS and other classifications of diabetic retinopathy, see appendix 8. 10
In the United Kingdom, the National Screening Committee adopted the population
screening classification for England and Wales. This has an aim to detect retinopathy severe enough to merit referral and treatment. This is simplified for use by non-ophthalmologists or accredited photographic graders. The fundus findings are described as is table 3.
RISK TREATABLE
1. Poor blood sugar control for a long time Yes
2. High blood pressure Yes
3. Duration of diabetes No
4. Raised levels of triglycerides in the blood No effect on DR
5. Alcohol yes
6. Pregnancy (but not in diabetes caused by pregnancy) No but counsel
7. Proteinuria No
8. Smoking No effect of DR
12 Table 3 population screening classification
1. Retinopathy (R) Level 0, 1, 2 and 3
2. Maculopathy (M) Exudates, circinate, microaneurysm, haemorrhage within 1DD,
3. Photocoagulation (P) Focal to the macula, peripheral scatter laser marks
4. Unclassifiable (U)
Screening for diabetes retinopathy
The World Health Organization has included Diabetic Retinopathy on the list of eye conditions that can be partly prevented. It was recommended that member nations of the WHO should incorporate into their Strategic National Health Plans a component of eye care services for diabetic patients. All its member countries are encouraged to develop a screening programme for diabetic retinopathy. All health authorities and professional organisations are urged to formulate polices concerning screening of type2 diabetes. When undertaking such a task the benefits and cost to the individuals and their wellbeing should be taken into consideration.
Other considerations are the economical consequences of screening. The planning authorities are to take into account the cost of early detection of individuals and the running cost of the health system including extra costs of treatment and relative cost effectiveness of early detection of diabetes.
Developing countries are encouraged to implement this programme according to the level of development of their health system, number of health personnel and availability of financial resources.
13
The screening programme can either be population or facility based or both depending on the resources and should be patient-targeted so that a lot of them can be reporting back for reviews. 11
A number of regional bodies have taken up this challenge and efforts are being put together in various regional blocs as a way of combating diabetes and its complications.
Table 4 shows the regions that have made a diabetic declaration and estimated prevalence of diabetes mellitus.
Table 4: Regional Diabetes Declaration
REGIONAL DIABETES DECLARATION PREVALENCE OF DIABETES **
1. Saint Vincent Declaration in Europe 12 7.8% adults
2. Pan American Health Organisation 13 10-15% adults
3. Eastern Mediterranean Region 14 15-25%
4. Diabetes Declaration and Diabetes Strategy for Africa 15 3.1% adults
5. American Diabetes Association 16 7.0% ≥ 20years
** appendix7
All these regional bodies have similar objectives, namely, to advocate for the early detection, treatment and prevention of diabetes and its complications. It is hoped that these measure will bring about benefits to the diabetic individual, family and health system. National governments will be able to save a lot of money as less and less individuals with diabetes will progress to have chronic, debilitating complications.
14
Treatment for diabetic retinopathy
A good blood sugar control, less than 8.6mmol/L (less than 155mg/dl) has been recommended as idea if the risk of diabetic retinopathy is to be reduced. Other risk factors like hypertension, renal disease and hyperlipidaemia should be identified and treated. There is also a call for a change of lifestyle that avoids obesity and inactivity. 17 Details of the treatment and follow up schedules for diabetic retinopathy are as shown in table in appendix 9. Mild diabetic retinopathy requires follow up. Clinically significant macular oedema requires focal laser treatment and severe Non proliferative diabetic retinopathy may some times be treated with scatter/ pan-retinal laser. Severe diabetic requires scatter laser, unless it is a high risk which is not amenable to photocoagulation.18See Appendix 9 for more details.
Diabetes in Zambia
Zambia is located in the Southern African region and is a land locked country, with a surface area of about 752,614sqKM, surrounded by eight countries. The country has 72 Districts/Towns, which are located in 9 administrative Provinces. The population is now estimated to be about 11.7million. The birth rate is estimated at 40.8/1000 and infant mortality of about 100.7 deaths/1000 live births. In 2007 the literacy rate was estimated at 81%. 19
The Ministry of Health in Zambia has adopted the 4year National Strategic Plan in the Fight against Blindness. It has in its structure an office for the National Eye Coordinator and the advisory Committee, National Prevention of Blindness Committee (NPBC). The Ministry of Health in Zambia also recognises the existence of the Diabetes Association of Zambia, which has is offices located in Lusaka.
15
Review of medical literature at the national level in Zambia shows a lack of information on diabetic retinopathy, an ocular disease which arises as a complication of diabetes mellitus. The Diabetic Association of Zambia estimates the prevalence of diabetes in Zambia to fall between 3 to 5% (330,000 to 550,000 out of 11million persons in Zambia). There has not yet been a population based study on blindness or diabetes and diabetes retinopathy. Studies in the neighbouring countries like Zimbabwe and South Africa reported prevalence of diabetic retinopathy to be 4% (n=150) and 2.9% (n=475) respectively.
Diabetes Association of Petauke Eastern province of Zambia
Population of Petauke District is about 299,000 people. The Diabetes Association of Petauke was formed in 2000. According to anecdotal information, at that time there was a severe shortage of insulin and oral hypoglycaemiants in the Province and also an erratic supply of these drugs in the country. It appears at that time anti-diabetic drugs were not included on the list of drugs on the Essential Drug Kit for District Hospitals. Therefore, a group of Diabetics in Petauke came together and formed a pressure group which started lobbing the hospitals, NGOs and INGOs to buy and stock or provide sufficient anti diabetic drugs. This self-help group also started providing resources and information to its members. Membership has since grown to 143, with the annual mortality rate of around five members per year. The Association is currently a member of the Diabetes Association of Zambia
16
Rationale
The rationale for this study is to collect baseline data from diabetic patients in Petauke and estimate the magnitude of diabetic retinopathy. It is hoped that publishing of such data at country level will stimulate medical interest in further developing diabetic polices, programmes and data base in Petauke District as well as in other Districts in Zambia
Aim of the study
The aim of the study is to evaluate the presence and presentation of diabetic retinopathy and initiate creation of the diabetic data-base amongst Diabetics belonging to the self-help Diabetes Association in Petauke in the Eastern Province of Zambia. Objectives
1. To describe visual acuity and visual impairment of the diabetics
2. Know the main causes of the visual impairment amongst the members of the diabetes association.
3. To estimate the distribution of diabetic retinopathy amongst the members of the diabetes association.
4. To identify risk factors for the development of diabetes retinopathy
5. To find out the some experiences in the control, managing and knowledge about diabetic eye diseases
17
Methodology
Type of study design
The study design was be a Cross Sectional Quantitative Study, with a component of a simple qualitative study. This design was chosen because it was convenient for the amount of time and the human resources that were available and supported by the budget. In addition the individuals with diabetes belonged to the association for the diabetes in the district and as such it was easier to plan and budget for a cross-sectional study.
Study time and Site of the study.
The study was carried out from the 13th to the of 22th July2008
Sampling strategy
There were 143 diabetic persons on the Petauke Diabetes Association. All these individuals were invited to attend and take part in the study. Efforts were made to see every member of association.
Inclusion criteria
All patients suffering from diabetes mellitus belonging to the Petauke Diabetes association, who responded to the call for the seven days of the study time in Petauke, were included in the study.
Study cases
Study cases were those patients who gave consent for the following: inclusion in the study; willing to undergo a visual examination which included ocular examination (visual acuity, refraction, intra ocular pressure) and instillation of topical anesthesia and pupil dilator, mydriacyl or a cocktail of mydriacyl and phenylephrine 0.5% eye drops), before fundus eye examination.
18
Data collection method
Quantitative dataThe quantitative data was collected using a questionnaire. The questionnaire consisted of a serial number box, demographic and area brief medical history, biometric
assessment section; visual acuity, refraction and best corrected visual assessment and fundus examination sections.
Six study assistants were trained in the use of the questionnaire. This was carried out at ST Francis’ Hospital in Katete. St Francis Hospital attends to about 10 to 20 diabetic patients during the weekly diabetic clinic. A day’s training session was conducted and 11 patients were seen. Quantifiable method like the “kappa value” were not employed to assess the six study assistants but it was seen to it that they understood the questionnaire and that they managed to enter data correctly on each for each pilot case they dealt with.
Qualitative data
Qualitative data was collected by means of in-depth interviews using a probe question guide. A purposive sampling interview of total of 12 persons was conducted. Six of these were on insulin treatment for more than 5years and the other six were from those who were on oral hypo-glycaemiants or dietary glucose control for 10 years. A one to one interview was preferred over a group interview because it was convenient to choose a small number of type1 and others with type 2 diabetes individuals.
A Medical Doctor who conducts the diabetes’ clinic at the hospital was also given an in-depth interview. The Ophthalmologist conducted the interviews and recoded all the information from each interview.
19
Qualitative data analysis
Qualitative data was collected from three groups of people, 6 individuals on insulin with the duration of diabetes of at least 5years, 6 others with diabetes of the duration of 10 years or more and from one Medical Doctors based at Petauke District Hospital.
Data was collected using opened ended questions during a one to one interview with each selected person. The information was written down on plain papers attached to the main questionnaire. The following processes of:
Immersion,
Extraction of the themes
Organize data into themes
And re-immersion of thematic framework for meaning
Triangulation for trustworthiness and reliability was done but limited to data only as methodological (one method used)l and researcher (one researcher) triangulation could not be done.
CODES
Coding of all data was done using the following system:
Person Code Respondent’s
number
Response Code display
Patient PDA 78 1 PDA078.1
Medical Doctor MD 1 2 MD1.2
20
Data analysis
A seven days study was be held in Petauke. The convenient venue was at the Petauke District Hospital out-patient department facilities. There are about 143 persons captured on the Petauke Diabetes Association’s register. All members of the association were invited to attend any of the seven days screening sessions. The subjects that responded to the invitation were attended to by 2 Ophthalmic Nurses at the registration area , 3 Ophthalmic nurses in the medical and Visual acuity and refraction area and one Ophthalmic clinical officer and Ophthalmologist in the interviews and slit lamp and fundus examination room. Refreshments for the patients and study team were provided by the hospital administration.
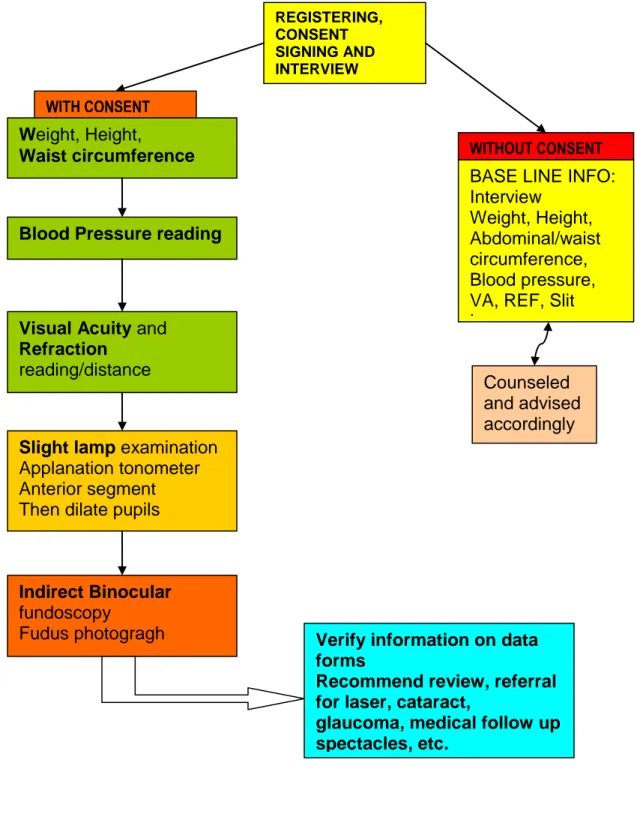
The seventh day marked the final day for the screening session, verification of the raw data that had been entered on the questionnaire forms and ending of the study session. The flow of the study subjects from the registration to the end of the assessment time was as shown in the flow chart below (page23).
Fundus examination and reporting
The slit lamp and indirect binocular fundoscopy in dilated eyes, with cocktail mydriacyl/tropicamide and phenylephrine commercial eye dilators, were carried out by the Ophthalmologist who was the principle investigator. It was not possible to photo-document (take fundus photographs) the optic disc, macular and periphery for any of the study subjects with any form of retinopathy as the photographing facilities were not available. The Ophthalmologist was the Gold standard when reporting the fundus findings. In view of limited resource and difficulties in the logistics, other Ophthalmologists were not engaged and besides this, at the time of the study there was no vitreoretinal specialist in Zambia.
21
Ethical consideration:
Ethical approval was taken from the London School of Hygiene and Tropical medicine (Appendix 1and 2
Ethical Committee and the University of Zambia Ethical Committee (appendix 3) Ethics were observed according to the declaration of Helsinki of 1989.
All documents that were be generated were stored and kept by the principle investigator.
Individuals requiring reading glasses were be given for free and vitrectomy, the Seventh Day Adventist’s Lusaka Eye Hospital, were on stand-by to offer treatment, Laser and vitrectomy, to these patients who were identified in the course of the study individuals, without charging them any medical fees .
Consent
Consent was taken from all the patients that were seen and none of them withdrew from the study at any time. The sample of the consent is shown in the appendix 6.
22
Diagram below shows the patients flow during study period at Petauke.
Weight, Height,
Waist circumference
Blood Pressure reading
BASE LINE INFO: Interview
Weight, Height, Abdominal/waist circumference, Blood pressure, VA, REF, Slit Lamp
REGISTERING, CONSENT SIGNING AND INTERVIEW
Visual Acuity and
Refraction
reading/distance
Slight lamp examination Applanation tonometer Anterior segment Then dilate pupils
Indirect Binocular
fundoscopy Fudus photogragh
WITH CONSENT
WITHOUT CONSENT
Verify information on data forms
Recommend review, referral for laser, cataract,
glaucoma, medical follow up spectacles, etc.
Counseled and advised accordingly
23
Data analysis
The data generated was analyzed using Micro-soft Excel, SPSS and STATA statistical packages.
Qualitative data was translated in English, then coded` and analyzed. The analysis process was carried out by immersion, tractions of the themes then cut and paste of some excepts according to the theme.
A copy of the final report will be given to the Petauke Diabetes Association, Petauke District Health Team, the Provincial Health Office and National Eye Coordinator.
24
RESULTS
Quantitative data
There were 112 members of the association, out of 140, that responded to the invitation and met the inclusion criteria. The total number 140 exclude 3 persons that were reported to have died. The response rate for the study was therefore 80% (112/140) Demographic information
Distribution of diabetic patients by gender
The members of the Petauke Diabetes Association who were recruited into the study consisted of 55% (62/112) females.
Figure 1: Distribution of study individuals by age
.
Distribution by age
The mean age was 53.07(SD of 14.6, with years ranging from minimum 17 to 85 maximum. It was noted that 49.1% of these fell in the age range of 40 to 59 years.
n=112
45% 55%
Male Female
25
Figure 2: Distribution of the study individual by grouped years
Figure 3 Age and Gender distribution
Figure 3 shows the distribution of gender according to the various age groups. There were a slightly higher proportion of females in age group spanning from 30 years to 60 years than males. The majority of the females were in age range of 50to 60years.
Distribution of the diabetic individuals according to their Chiefdoms
From the data collected, it was noted that majority of the Petauke Diabetes Association (PDA) members 61% (68/112) were from Kalindawalo chiefdom while 10% (11/112) and 9% (10/112) were form Nyanje and Nyamphande chiefdoms respectively. The others observations were as shown in figure 4 below.
0.9 5.4 11.6 23.2 25.9 19.6 13.4 0 5 10 15 20 25 30 <=19 20-29 30-39 40-49 50-59 60-69 >=70 Pe rcent Grouped years n=112 0-19 20-29 30-39 40-49 50-59 60-69 70+ Male 0 10 10 20 20 20 20 Female 1.6 1.6 12.9 25.81 30.65 19.35 8.06 0 5 10 15 20 25 30 35 Pe rcent
26
Figure4 Distribution of the diabetics according to chiefdoms
The Kalindawalo chiefdom of Petauke is not entirely representative for a single tribe, but consists of other tribes and ethnic groups. The majority of these is still the Nsenga (Indigenous) of Petauke and represents an area of the District that is managed by the local government.
Educational levels amongst the diabetic
A total of 38.4% (43/112) person were primary educated and 17% (19/112) had nor education. Amongst the female members (n=62) about 69.9% did not have any education or had only attained primary school. For more details on gender and education see figure 5 below.
Figure 5: Distribution highest education attained by gender
n=112 61% 1% 6% 5% 5% 1% 9% 10% 2% KALINDAWALO MALUMBE MUMBI MWANJABANTU NDAKE NYAMA NYAMPHANDE NYANJE SANDWE n=50 m ale , n=62 fe m ale 10.0 28.0 32.0 30.0 22.6 46.8 17.7 12.9 0.0 10.0 20.0 30.0 40.0 50.0 N o n e Pri ma ry Se co n d a ry C o lle g e o r mo re Non e Pri ma ry Se co n d a ry C o lle g e o r mo re
Male Fem ale
27
Duration of diabetes in the study group
The median duration of diabetes from the time of clinical diagnosis was 4.0 years, (95% CI of 4.62 - 6.85) and the range of minimum 0.04 to maximum 30years.
Figure 6 below shows the distribution of the duration, grouped in 5years periods. It was observed that 67% (75/112) were diagnosed as having DM in the past 5years and the numbers of members with diabetes reduced as the individuals become older and only 5.4% had lived with the disease for more than 20years and none beyond the duration of 30years.
Figure 6: Duration of diabetes in the study subjects
n=112 67 19.6 5.4 2.7 3.6 1.8 0 10 20 30 40 50 60 70 80
0 to 5 6 to10 11 to15 16 to20 20 to25 26 to30
years
pe
rc
e
28
Data analysis looking for any association between duration of diabetes and age group or educational level for the study cases did not shows any statistical significance Fisher’s exact test 0.652 and 0617 respectively.
Individuals with duration of diabetes within 5years from onset were distributed as shown in figure7 below. Majority, 28% (21/72) were in the age group 40-49years, followed by age group 50-59years 26.7% (20/75). None of these persons had diabetic retinopathy.
Figure 7: Distribution of Diabetes and Duration less than 5years
Method of Treatment amongst the diabetic individual
As shown in Figure 8 below, a total of, 66.1% of the PDA members were on oral anti-hyperglycaemia tablets and 20.6% were on insulin treatment
0-19 20-29 30-39 40-49 50-59 60-69 70+ % 1.3 8.0 12.0 28.0 26.7 14.7 9.3 0.0 5.0 10.0 15.0 20.0 25.0 30.0 Pe rcent n=75
29
Figure 8: Treatment method
There was a weak statistically significant association between treatment methods and the educational level attained by the individuals, 0.053 (Fisher’s exact test).
4.5 66.1 28.6 0.9 0 10 20 30 40 50 60 70 pe rc e nt 1 Treatment n=112 Diet Medication Insulin Traditional treatment
30
Ocular examination results
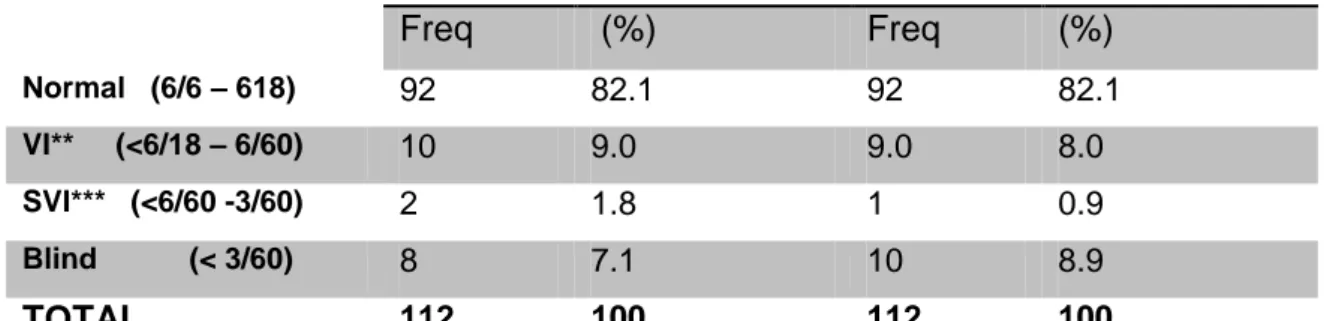
Visual acuityVisual acuity findings amongst the PDA members indicated that 82.1% (92/112) had normal vision. General blindness was estimated at 7.1% (8/112) RE eyes and 8.9% (10/112) LE.
Table 1: Distribution of Visual acuity
VISUAL ACUITY* RIGHT EYE LEFT EYE
Freq (%) Freq (%) Normal (6/6 – 618) 92 82.1 92 82.1 VI** (<6/18 – 6/60) 10 9.0 9.0 8.0 SVI*** (<6/60 -3/60) 2 1.8 1 0.9 Blind (< 3/60) 8 7.1 10 8.9 TOTAL 112 100 112 100
*WHO grading **VI =visual impairment, *** SVI= severe visual impairment
Test for significance according to the Fisher’s exact test was performed and the real difference was observed in the Visual acuity and refractive error, and sight threatening diabetic retinopathy results. The others did not show any statistical significance, table 2 below.
Table 2: Summary table of test of significance
Fisher’s exact test
VA/ Refractive Error 0.000
VA/ RE sight threatening DR 0.000
LE sight threatening DR 0.009 VA RE/ Smoking 0.236 LE/Smoking 0.702 VA RE/BMI 0.075 VA LE/BMI 0.433 VA/ Chiefdom 0.734
31
Distribution of Causes of poor visual acuity of less than 6/18
The leading cause of poor vision was cataracts 17% (38/224) followed by refractive error 11.6% (26/224) and then diabetic retinopathy accounted for 4.5% eyes.
(10/18), though neither Table 3
Table 3: Distribution of Visual acuity of less than 6/18
Cause of VA less than 6/18 Frequency RE Percent RE Frequency LE Percent LE Total freq Total % Refractive error 13 11.6 13 11.6 26 11.6 Corneal opacity 1 0.9 2 1.8 3 1.3 Cataract opacity 20 17.9 18 16.1 38 17.0 Diabetic retinopathy 4 3.6 6 5.4 10 4.5 Others ** 74 66.1 73 65.2 147 65.6 TOTAL 112 100 112 100 224 100
**includes glaucoma, optic atrophy and normal eyes
Of the total of 6 eyes that had retinopathy 2 (33%) had sight threatening retinopathy. The 2 eyes were graded as blind and they accounted for 25% (2/8) of the causes of blindness amongst the PDA members, with a Pearson Chi2 p-value of 0.000 (when VA and Diagnosis as a person were analyzed for statistical significance).
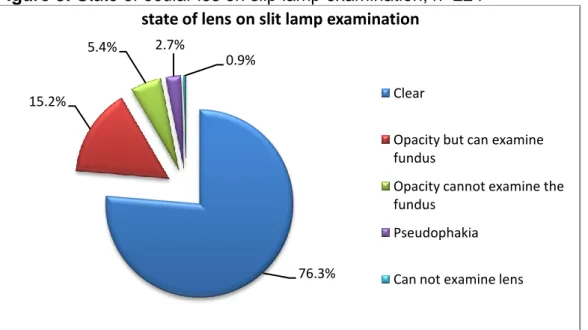
Lens findings on Slit lamp examination
Slit lamp examination, after dilatation of the pupils, had revealed that 21.6% of the study subjects had lens opacities of varying degrees. 5.4% (12/224) lens opacities were not so dense as to prevent fundoscopy and 15.5% (12/224) of the lenses were dense enough and a standard seven field’s fundus examination was not possible. Corneal opacity was encountered in 0.9% (1/224 lenses) (Figure 8)
32
Figure 8: State of ocular les on slip lamp examination, n=224
Fundus examination results
Fundoscopy done in dilated pupils had shown abnormalities in 4.6% of patients, (6/112). A total of 8eyes (3.6%, 8/224) had mild non proliferative diabetic retinopathy while mild and moderate non proliferative diabetic retinopathy had).5% each (1/224)
Table 4: Fundus findings, FUNDUS
RIGHT EYE* LEFT EYE ** TOTAL
GRADING FREQ % FREQ % FREQ %
Mild NPDR 4 3.6 4 3.6 8 3.6
Moderate NPDR - - 1 0.9 1 0.5
Severe DR - - 1 0.9 1 0.5
Cannot examine fundus 8 7.1 7 6.2 15 6.7 No diabetic retinopathy 100 89.3 99 88.4 199 88.7
TOTAL 112 100 112 100 224 100
*Fisher’s exact test Duration/ RE fundus not statistically significant (0.313) ** Fisher’s exact test Duration/ LE fundus mild statistically significant (0.034)
76.3% 15.2%
5.4% 2.7%
0.9%
state of lens on slit lamp examination
Clear
Opacity but can examine fundus
Opacity cannot examine the fundus
Pseudophakia Can not examine lens
33
Sight threatening retinopathy
There were 4 eyes that had diabetic retinopathy and the vision was less than 6/18, however, conclusive diagnosis was only in two eyes. One eye had a corneal scar, while the other had some lens opacity, making it difficult to conclude whether or not the observed poor visual acuity was as a result of the state of the cornea or the severe and moderate diabetic retinopathy which may have been bilateral.
Diagnosis of the ocular pathologies
There were 5.4% (6/112) individuals who were diagnosed with diabetic retinopathy while the majority had normal retinal findings. One had advanced glaucoma with optic disc cupping, CDR of 0.9, on and two with optic atrophy.
Refractive error was reported in 11.6 % (13/112) while cataract was noted in 19.6% (22/112) persons.
Figure 9: Diagnosis as a person
Refractive error Corneal opacity Cataract Diabetic retinopathy* Other** Percent 11.6 0.9 19.6 5.4 62.5 0 10 20 30 40 50 60 70 Pe rcent Diagnosis as a person n=112
34
Risk factors for diabetic retinopathy Smoking
The majority of the study subjects did not have a history of smoking, 84.8% (95/112). One female member was a smoker and the rest 98.4% (61/62) were “never smokers”. Compared to the male members 68% (34/50) were “never smokers” and 28% were ex-smokers while 2 were current smokers.
Figure 10: Distribution of smoking amongst the diabetics
The Fisher’s exact test for statistical significance had shown a very strong association between gender and smoking (p= 0.000), and however, a very weak association between age and smoking (p= 0.252).
Distribution of Body mass index amongst the study diabetic individuals
The average body mass index for the 111 individuals in the study was 27.48Kg/sq m (SD 6.5, and 95% CI: 26.20-28.77). The BMI ranged from minimum 14.4 and maximum of 48.6kg/sqm. One study person was too ill to take part in the height and
3% 85% 12% Smoking, n =112 Smoking* Yes Never Ex smoker
35
weight assessments and as a result the BMI could not be calculated.
Further analysis of BMI showed that 46% of the males had normal BMI, 42% were classified between over weight to obese, while 49% of the females were overweight to obese.
Figure 11: Distribution of body mass index by gender
Fisher’s exact test BMI/gender was statistically significant p=0.010.
Figure 12: Distribution of BMI for the whole study group
BMI grading under weight=18.5, normal=18.6to 24,9 overweight= 25 29.9, obese= 30 +
Body mass index of the cases assessed did not show any statistically significant association with age (p=0.281), educational level attained (p=0.159), and chiefdom of origin (p=0.810), n=50 male, n=61 female 6 23 11 10 2 10 21 28 1 0 5 10 15 20 25 30 U n d e r w e ig h t N o rma l BMI Ove r w e ig h t O b e se U n d e r w e ig h t N o rma l BMI Ove r w e ig h t O b e se Mi ssi n g
Male Fem ale
BMI grading Pe rc e n t n=111, 1=m issing 7.1 29.5 28.6 34.0 0.9 0.0 10.0 20.0 30.0 40.0
Under w eight Normal BMI Over w eight Obese missing BMI grouped P e rc e n t
36
Distribution of hypertension in the study cases
It is worth mentioning that 50% 0f member of the PDA were on anti-hypertensive treatment. Analysis of the data and grading of the blood pressure findings showed that systolic blood pressure stage2 was noted in 22.5% and 5.4% had Stage2, and 7.2% had stage 2 hypertension (diastolic blood pressure of more than or equal to 100mmHg, while 85.7% had normal diastolic blood pressure. Table 6 and 7 shows details of the distribution of the blood pressure.
Table 6: Distribution of Systolic blood pressure
MALE FEMALE TOTAL
GRADE* FREG % FREQ % FER TOTAL
Normal 35 70 39 63.9 74 66.7 Pre-HTN 1 2 5 8.2 6 5.4 Stage1HTN 10 20 15 24.6 25 22.5 Stage2HTN 4 8 2 3.3 6 5.4 TOTAL 50 100 61 100 111 100 * No r m al <= 1 2 0 m mHg , p r e - h yp e r t en s i ve = 1 2 1 - 1 3 9 mm Hg , St a g e 1HT N= 1 4 0 - 1 5 9 mm Hg , S t ag e 2 H TN>= 1 6 0 m mHg (http://www.nhlbi.nih.gov/health/dci/Diseases/Hbp/HBP_WhatIs.html) ** Fisher’s exact test not significant association 0.352
Table 7: Distribution of Diastolic blood pressure
MALE FEMALE TOTAL
GRADE* FREG % FREQ % FER TOTAL
Normal 42 84 53 86.9 95 85.6 Pre-HTN 1 2 1 1.6 2 1.8 Stage1HTN 3 6 3 4.9 6 5.4 Stage2HTN 4 8 4 6.6 8 7.2 TOTAL 50 100 61 100 111 100 * No r m al < = 8 0 m mHg , pr e -h yp e rt e n si v e = 8 1 - 89 m m Hg , St a g e 1HT N= 90 - 9 9 mm Hg , Stage2 HTN>=100mmHg . (http://www.nhlbi.nih.gov/health/dci/Diseases/Hbp/HBP_WhatIs.html) ** Fisher’s exact test not significant association 1.000
37
Statistical summary of abdominal circumference
Table 8 shows the summary of statistics for the abdominal circumference for 111 individuals. The mean abdominal circumference was 85.7cm with the 95%CI of 80.57-90.82. It was not possible to take the measurements for one person who was too ill. The rest of the statistics are included in table4.
Table 8: Statistical summary of abdominal circumference
n 111 Missing 1 Mean 85.6 Std Deviation 27.2 Minimum 28 Maximum 150 Percentile 25 82 50 92 ...75 103 95% CI 80.57-90.82
The abdominal circumference for males Mean 84.75cm, min 28 and maximum 118.5cm, with the 50% percentile at 89.5cm (normal cm) whereas for female the mean waist circumference was 86.4cm, min. 32.o to max 150 and 50% percentile of 95.9cm
38
Course of action given to the patients
There were 51.8%, (58/112) members of PDA who did not require any intervention, whereas 10.7% (12/112) were given reading glasses, and 12 (10.7%) individuals were referred to St Francis Mission Hospital in Katete for cataract surgery and one person was referred to Lusaka for review for vireoretinal surgery.
Figure 13: Medical Advice given to the study individuals
52% 8% 10% 1% 11% 18%
Action taken n=112 None
Distance correction Near glasses Treatment for retinopathy Cataract surgery Other
39
Qualitative data
Two main themes are presented
Patients’ Knowledge and experience and challenges faced. Each theme has been presented using subthemes
Patient’s knowledge and experience: findings under this theme have been organized under the following subthemes
Individuals’ knowledge about diabetic complications Expectations when diabetics go for reviews at the hospital Diabetic Health education and promotion
(a) Individuals knowledge about diabetic complications
1. Generally, the members of the PDA were aware of the major likely complications of uncontrolled high blood sugar like coma. The understanding varied amongst the patients about the additional complications from some knowledge to none, irrespective of the duration of diabetes they had.
PDA057.2 “….. I can enter a diabetic coma. Wounds and sore do not heal
fast. There could be problems with eyes, such like veins breaking in the eyes… The vision is affected and I remember that there could be problems with the kidneys. The sexual desire becomes poor. Other problems; I can not remember.”
PDA009.2 “Problems that I can face if I do not control the blood sugar? I do
not know.”
2. All patients had a clear understanding that blood sugar needed to be measured as part of the disease management. The data revealed that awareness of method or place or blood sugar measurement varies
40
(1) Test at home
PDA047.1 “Yes starting 7 days ago when I was given the machine, but before
that it was difficult for me to do my blood sugar tests”
(2) Hospital
PDA098.7 “The hospital is near my home and because of this I do not have
problems going for my reviews.”
(3) Private clinics
PDA001.1 “I usually go to the hospital or private clinic to have my blood
sugar test. I have not yet bought a blood glucose testing device”
(b) Expectations when diabetics go for reviews at the hospital
Blood sugar test at the Hospital
Most of the individuals expect to have a blood sugar test and then get the necessary anti-diabetic drugs
PDA 006.3 “I expect to measure my blood sugar levels and then receive my
drugs for diabetes…….but it would be nice if we can assess our blood sugar levels at home.”
(c) Diabetic Health education and promotion
There is a lack of pro-active diabetes health promotion at the hospital and also in the Petauke Diabetes Association. An interest to learn more was also expressed
PDA078.5 “I never felt the need for health education. The need is there but
where can I go? I have never seen a Doctor in my diabetic clinic at the hospital because I prefer going to the private clinic to buy the drugs. I think I was waiting for someone to come to me and tell me about diabetes.”
41
MD1. 3 “We have radio programmes on the community radio. This is helpful
but we currently do not have funds for a sustained sponsored programme.“
MD1.3 “The health education and community based programmes should
ideally be conducted on a monthly basis”
Challenges faced: the findings under this main theme is presented using the following subthemes
Cost and maintenance of glucometers
Nutritional counseling
Storage of insulin at home
Inadequate communications between patients and Doctors
Drugs supply
Cost and maintenance of glucometers
MD1.5 “It is possible to buy strips in bulk but it is still expensive.”
PDA006.1”The hospital gave me only 6 strips and it is expensive to buy spare
strips from private pharmacists.”
PDA010.1 “……my glucometer is not working properly. It is not switching on.
Some people told me that the machine has expired.”
Nutritional counseling
PDA012.3 “I do not have a chance of being taught on how to best control my
blood sugar. I am not even aware of anyone who has been assigned to teach diabetic patients at the hospital.”
DPA102.3 “The hospital should also consider giving us food like maize meal
and some sweeteners and other food handouts when there is a drought and or when my house hold has run out food stocks.”
42
DPA106.3 I expect to be counseled on diabetic nutrition and also to be given some food especially when there is food shortage in the community, for example persons on HAART are given food supplements
Inadequate communication between patients and doctors
MD1.3 “Poverty level is generally noticeable. Some patients fail to take
nutritional advice and end up eating whatever is available for example taking refined breakfast maize meal versus roughage –rich roller meal or mugaiwa.”
MD1.5 “In my opinion, many patients are not serious with the needs to have
regular intake of food and anti-diabetic drugs, maybe the health education was not adequate.” MD1 “The diabetic clinic is very busy we conduct the clinic once per week, every Monday. There are on average 20 patients per clinic day….”
PDA027.3 “We are lacking sensitization on diabetes. Do you have a chance
to talk to the Doctor? The Doctor is alone and does not manage to speck to each and every one of us.”
Storage of insulin at home
PDA102.7 “I don’t have a conventional refrigerator but instead I have
improvised with the traditional cooling pot but the insulin seems not to work well maybe the traditional freezing method is too strong or maybe the potency of the drugs we are now receiving is now weak. I informed the Doctor about this problem.”
43
Drug supply
PDA102.7 “The problem I have noticed is that the drugs are not always
adequate as a result we are only given enough to last a month and as a result we do monthly reviews and sometimes this is an inconvenience.”
MD1.5 “the hospital does not have the capacity to give drugs to many patients with review dates more than two months”
Stocks at the hospital
MD1.4 “injectable drugs are a problem. We normally have very unreliable /
erratic supplies of anti-glycaemiants. Needles and syringes for diabetic injections are not always in stock. We sometimes resort to getting such supplies from neighboring hospitals.
44
DISCUSSION
The PDA, which was formed in 2000, is a unique self- help diabetic association located in a rural set up in the district of Petauke in Zambia. The group’s mission has been to ensure their plight as diabetics in need for long medical support is kept on the agenda of the hospital and District Health Planners. As a result of its actions members have had a constant supply of the anti-diabetic drugs as well as access to basic diabetic facilities at the hospital. The association deserves all the support available as it aims to lobby for good management of diabetes for members.
There were 112 patients out of the total 140 members of the Petauke Diabetes Association who met the study criteria for cases for the study. Three members of the association died six months prior to the study. Other members could not be traced during the study period.
In the study group, 55% (62/112) were females and 45% (55/112) males. Their mean age was 53.07(SD of 14.6), with years ranging from minimum 17 to 85 maximum. The majority of the members of the association were in the age range of 40 to 60 years. The distribution of diabetics according to gender showed that in the age range of 30 to 69 years there were relatively more females than males. Global diabetes statistics reports that prevalence of diabetes is similar in males and females, however, the diabetic males are more in ages less than 60 years while female diabetics tend to be more in ages above 60 years. This might be because the life expectance for elderly females is regarded to be more than in elderly males. 20 Literature review, published by the Diabetic Care Journal, that compared the proportion of diabetics in developing and developed countries it was reported that majority of the diabetics are aged between 45 and 64 years in developing countries while in developed countries they majority are more than 65 years of age. 20 The
45
concern in developing countries is that the disease is affecting the age group which is economically active. 21.The results on age distribution obtained from the Petauke Diabetes Association study show some similarity with the global data, although our sample size was small. The concerted effort directed at minimizing the morbidity and diabetic complications can help to keep the members economically active for longer periods.
Normal visual acuity findings were recoded in 82.1% (92/112) members of the PDA and blindness was estimated at 7.1% (for right eyes, 8/112) and 8.9% (for left eyes, 10/112).The main causes of blindness were cataract (3persons), Diabetic retinopathy (2persons) optic atrophy (4persons) and glaucoma (1person). Fisher’s exact test did not show any statistically significant results when visual acuity was matched with BMI, smoking or chiefdom of origin. There was however, a statistically significant association between visual acuity and refractive error (p=0.000 for the right eyes and p=0.009 for the left eyes).
In our study, the cause of blindness due to diabetic retinopathy was 25% (2/8) of the total eyes which were graded as blind. This may not be considered conclusive as the study sample size was not large. Global estimates of the number of people who become blind as a result of diabetic retinopathy are approximately 2%, after suffering from diabetes for 15years. Severe visual impairment accounts for 10% of poor vision in diabetes.22 In the study group, the causes of visual acuity of less than 6/18 in the 224 eyes examined, were due to refractive errors (11.6%, 26/224), cataracts (17%, 38/224) diabetic retinopathy (4.5%, 10/224), corneal opacity (1.3%, 3/224) and 65.5% were normal. Also included together with the normal VA group were those that had non diabetic optical atrophy (4 eyes) and glaucoma (2 eyes). Refractive error and cataract are relatively easy to treat and the issue of provision of refractive
46
and cataract services should raise concern at the hospital and association as these pathologies are common among the members.
The prevalence for diabetic retinopathy in the study group, 4.5% (10/224 eyes), was lower than the published data for the sub Saharan region. One report from Dakar in Senegal, considers the prevalence of diabetic retinopathy in the Sub-Saharan Africa to be between 15% and 52 %. 23. But this is not sight threatening, it could be all cases of retinopathy. It was reported by some researchers in 1988, in a clinic study, that the prevalence of diabetic retinopathy in Zambia was about 34% 24. Prevalence of diabetic retinopathy, in a population based from UK, n=10,709, was reported to be 16.5%. 25 In our study, we anticipated to find a larger prevalence of diabetic retinopathy considering the fact that there were shortages of insulin at the hospital and high chance of poor control of blood sugar. Two reasons for fewer than expected cases could be the duration of the disease or better control through regular check up system from the PDA. Further studies on larger sample size might high-light the true prevalence of diabetic retinopathy or any protective effects that exists amongst the diabetics.
Similarly a lower prevalence of cataract was observed amongst the diabetics in the PDA member, contrary to prevalence for the study done in Zambia by Rolfe M, in 1988. These lower prevalence results recorded in the study maybe due to the lower sample size as well as due to varying rate of progression of ocular complications of diabetes in different age and ethnic groups 26.
Majority of the diabetics 66.7% (75/112) in the study had less or equal to 5years of duration of the disease from onset/diagnosis, however, none of them had diabetic retinopathy. Most of DR in type 2 happens after 10 years or more after diagnosis. In
47
literature published by Diabetic Care 2003, the prevalence diabetic retinopathy at time of diagnosis in an Australian population based study was 6.7% in type2. 27 In our study, there was also a very strong statistically significant association between duration of diabetes and presence of sight threatening retinopathy in the study subjects, p=0.002. The Australian Diabetic Study cited earlier above had shown DR increases with the increase in the duration of diabetes.
Risk factors for diabetic retinopathy that were looked at during the study were Body mass index, abdominal circumference, hypertension and smoking, all which can be considered as treatable. Age and duration of diabetes are other risk factors but there is no treatment for these. The association between BMI and diabetic retinopathy was weak p=0.034. Other analyses of BMI association with age, level of education attained, chiefdom of residence, yielded varying degrees of statistically not significant results. The BMI assessment is not ideal when the individual under evaluation is more than 75 years of age. 28 this may be due to the small sample size. Hypertension amongst the diabetics in the PSA study was noted in varying grades such as Stage2 HTN systolic and diastolic were 5.4% and 7.2 respectively. The Medical Doctor in-charge of the Diabetic Clinic at Petauke District Hospital had stated that about 50% of his patients had hypertension and were on treatment. In a study done in UK by the UKPDS it was observed that about 40% of the patients recruited in their study as newly diagnosed diabetes type2 had pre-existing hypertension. Hypertension in diabetics increases the risk for macro-vascular and micro-vascular damage. The UKPDS randomized trial n=4209 with follow-up period of 11.1 and 8.4 years for the group, reported that it was beneficial when hypertension is reduced in patients who had diabetes.29 The Blood pressure was maintained lower than 130/80mmHg. In our study the majority of the individuals were already on
48
treatment for hypertension and as such it is difficult to assess its contribution as a protective factor against diabetic retinopathy.
In terms of the type of treatment the PDA members were using, 66.1% were using oral mediation and 20.6% were on injectable anti-diabetic medication. There were 62% (5/8) and 25% (2/8) blind person on oral medication and insulin respectively. There are problems with supply of anti-diabetic drugs as a result some patients are stabilized on oral treatment which is readily available and this may the existence larger number of persons on oral treatment.
Majority of the female members of the association (69.8%) had attained either none or primary educational levels. Amongst the blind in the in the group 62.5% (5/8) in both sexes had no formal education or only primary educational and the 2 (100%) individuals who had SVI also had none and primary education. This may indicate the health seeking behavior
Amongst the members of the association, there was some knowledge about diabetic eye diseases and control of blood sugar; however, there were limited counseling and nutritional services and technical support offered to the members both at the hospital and within the association.
Quantitative data from the members had shown that diabetic health education covering general knowledge, nutrition counseling and blood testing methods needs to be strengthened at the hospital as well as in the association. These preventive measures can compliment early screening and detection of diabetic retinopathy and reduce visual loss
49
Limitation of the study
1. The study was a cross sectional type and restricted to the members of the Petauke diabetes Association, and because of this the results can not be generalizes to the population level.
2. The sample size of the study was small although the response rate of 80%. The rest could not be traced when effort were made to find then at the villages of residence.
3. The qualitative study, using in-depth interviews, did not include everyone in the Association and neither was it logistically possible to conduct focus group interview.
4. There was no vitreoretinal specialist and no fundus photos to verify the fundus findings.
5. The Kappa Value was not carried when training the research assistants and there was only one Ophthalmologist available for fundoscopy.
50
Conclusion
1. The study has shown that diabetes has affected the most economically active age groups, 30-60 years of the Petauke Diabetic Association.
2. The association of duration of diabetes, as a risk factor, and diabetic retinopathy was statistically significant ( Pearson chi2 p=0.002)
3. Prevalence of visually impairment in the group was as follows: refractive error 11.6%, cataract 19.6%, and diabetic retinopathy 4.5% and 1.3% corneal opacity.
4. A total of 4.5% eyes (5.4% individuals) had diabetic retinopathy; of which proliferative retinopathy was 33.33% (2/6) and loss of sight from DR was 25% (2/8).
5. BMI and abdominal circumference were relatively larger in females than males with a weak statistical significance finding p=0.010 for BMI and DR.
6. About 50% of the diabetics in the association were already on treatment for hypertension and this might have caused the protective effect against DR.
7. Diabetes health education, supply of insulin, nutritional guidance and support and technical support and supplies for glucometer needs attention so that more benefits can be obtained from the Diabetes Association of Petauke.
51
Recommendations
1. Population based survey to be carried out so that the distribution of visual impairment and diabetic retinopathy are confirmed at the District/ population level.
2. Measures should be taken to consolidate and expand the data base that has been created, which should include the use of computers to insure easier processing of data and keeping of a reliable register for the members.
3. In view of the large number of people with normal ocular findings as well those with pathologies, programs for early screening for DR, cataract and refractive errors amongst diabetics should be developed.
4. Nutritional counseling, diabetic health education and home based blood sugar testing should be developed into regular programs that insure maximum benefit for the diabetics.
52
REFERENCES 1. IDF Diabetic atlas 3rd edition; November 2006
2. Definition, diagnosis and classification of diabetes mellitus and its complications WHO NCD, NCS 99.2 3. Sara Wild, Gojka Roglic, Anders Green. Diabetic Care; Volume 27, number 5, May 2004
4. International Diabetes Federation . “Prevalence and Projections Diabetes Atlas £rd Edtion.” November 2006.
5. International Diabetes Federation Diabetes Atlas. 3rd Edition; prevalence and projections November
2006
6. Mbanya J, Sobngwi E, J Cardiovasc Risk 2003; 10:97-102 7. WHO Diabetes fact sheet 312 September 2006
8. R. Klein, B.E. Klein, S.E. Moss, M.D. Davis, D.L. DeMets. The Wisconsin Epidemiology Study of Diabetic Retinopathy II, prevalence and risk of retinopathy when age at diagnosis is less than 30 years. Arch opththalmol: 102(4): April 1984
9. Viswanath K, Murry Mc Gavin DD. Diabetic Retinopathy Clinical finding and management. J Comm Eye Health: 16(46) 21-24, 2003
10. Diabetes retinopathy guidelines 2005 UK
11. Prevention of blindness from diabetes mellitus: report of a WHO Consultation in Geneva, Switzerland, 9-11 November 2005
12. Saint Vincent Declaration, Diabetes Care and Research in Europe. Saint Vincent (Italy), 10-12 October 1989
13. Chronic diseases prevention and control in the Americas. Pan American Health Organization Strategy and planning.
14. World Diabetes Foundation Press Release. Obesity and Diabetes, emerging major health care challenges in east Mediterranean
15. World Diabetes Foundation Press Release. Diabetes and non-communicable disease-now considered a big threat to Africa. Nairobi Kenya 27 June 2007
16. IDF Diabetes Atlas –All Diabetes 2005
17. P G Hykin. Diabetic retinopathy, clinical features and management. J Comm Eye Health: 09(20): 58-62. 1996
18. Prevention of blindness from diabetes mellitus: report of a WHO Consultation in Geneva, Switzerland, 9-11 November 2005
19. CIA the world factbook Zambia; web site viewed on 17/04/2007
20. Sara Wild , Gojka Roglic, Andres Green, Richard Sicree and Hilary King . Global Prevalence of Diabetes. Estimate for the year 2000 and projection for 2030 Diabetic are 27:1047-1053, 2004.
53
21. Burke,JP,et al. Rapid rise in the incidence of type 2 diabetes from 1987 to 1006. From the San Antonio Heart Study. Arch inern Med, 159(13): p1450-6
22. World health organization , fact sheet No312, September 2006
23. E.H. Sidibe. Diabetic Retinopathy in Dakar and African literature review: epidemiologic elements. Diabetes Metab 2000 sep; 26(4): 322-4
24. M Rolfe. Diabetic eye disease in central Africa. Diabetologia 31: 88-92 1988
25. Morgan C.L, et al. Prevalence of multiple diabetes related complication. Diabet Med, 17:146.2000
26. N Kumar, E Goyder and M McKibbin. The incidence of visual impairment due to diabetic retinopathy in Leeds. Eye 20: 455-459, 2006
27. Robyn J Tapp, et al. Prevalence of and factors associated with diabetic retinopathy in the Australian population. Diabetic Care 26: 1731-1737, 2003
28. National obesityforum.org.uk/content/view/171/168/