Word count 5000 approx
Singapore stock broking service quality: fifteen percent gap
Lee Yik-Chee DBA, Meredith G.G. AM PhD, Marchant T PhDSouthern Cross University
Lee Yik-Chee
Dr Yik-Chee Lee has a MBA from Brunel University, and a Bachelor of Business from RMIT. He completed his DBA at Southern Cross University, Graduate College of Management and has extensive experience in media management and cross-culture management. He has taught in China at Peking University Shenzhen Graduate School.
Geoffrey G Meredith
Emeritus Professor Geoffrey Meredith is a graduate of the University of Queensland and after teaching at several Australian and overseas universities, set up graduate and research programs at Southern Cross University, including Australia's first research DBA. He is the author of many books and articles on finance, small enterprise development, regional development, and professional practice and training programs for small enterprises have been adopted by the ILO for many emerging countries.
Teresa Marchant
Dr Teresa Marchant is lecturer and project officer at the Graduate College of Management, Southern Cross University, New South Wales. After a career in marketing including with IBM she was the first to complete a PhD in the Department of Human Resource Management and Employment Relations in the University of Southern Queensland and has a first class honours degree in Psychology from the University of Melbourne. Most recently she has been developing scholarly materials for the national public sector management program and is currently researching HRD, gender and higher education. Teresa Marchant is the corresponding author and can be contacted at
Graduate College of Management Southern Cross University
Tweed Gold Coast Campus PO BOX 42
Tweed Heads, NSW 2485 Australia
Tel: +61 7 5506 9311 Fax: +61 7 5506 9301
ABSTRACT
Purpose
:
To adapt the SERVQUAL instrument and provide a unique analysis of service quality, value, customer satisfaction and loyalty of Singapore stock investors. Design: Mail survey with 300 copies of a self-administrated questionnaire utilising the SERVQUAL instrument with experienced stock investors using stock broker (remisier) services in Singapore. Altogether, 169 useable returns (56 percent response rate) were analyzed.Findings: Investors expect high quality service from brokers, particularly in terms of reliability. There was a 15 percent gap in service quality, and a 20 percent gap in service value. Customers who relied on brokers’ advice perceived higher service quality. Brokers need more empathy with customers. SERVQUAL translated to Singapore stock broking customers with good reliability.
Research Limitations: Results may not generalize beyond Singapore or to other financial services.
Practical implications: Brokers need to focus on personal, empathetic relationships with investors and aim for near perfect reliability in accurate and timely execution of customers’ orders. Customers’ level of expertise is important and brokers need to make more effort to educate their clients, and proactively advise them.
Originality/value: Service quality, customer perceived value, customer satisfaction and loyalty of customers have been important research areas in the marketing literature. Research on these variables simultaneously in stock brokerage services is limited and our study sheds light on these variables in a new field. The study provides practical advice for brokers and other financial service providers, particularly in the light of emerging credence service and commercial friends concepts in the financial services sector.
Paper Type: Research Paper
Keywords: Singapore, SERVQUAL, stock brokers, credence service
INTRODUCTION
Over the last two to three decades, service quality, customer satisfaction, customer perceived value and loyalty have been ongoing research areas in world-wide marketing literature (Boulding et al., 1993; Caruana and Msida, 2002; Durvasula et al., 2003/2004; Ladhari, 2008; Tam, 2004; Rust and Oliver, 1994). Compared to the
focus of much of the literature, financial services, including stock broking, are more complex than other services and deserve more in-depth attention. This study addresses a substantive topic of high significance to customers (financial services) which has been almost “completely neglected in marketing research” (Martenson, 2008, p. 142).
We investigated five variables in relation to service quality for stock investors (customers) in Singapore. The five are demographics, expertise, perceived value, satisfaction and loyalty (behavioural intentions). Previous research indicates that service quality is a critical component of customer perceptions of service. Although service quality is critical in service industries, empirical research examining the service aspects of stock broking is limited or almost non-existent (Durvasula et al.,
2006). Recently a small number of studies have investigated financial advising and services in terms of advisor information and relationships (Martenson, 2008), credit card usage (Gan et al., 2008) and real estate investments (Chiang et al., 2008) but stock broking service is relatively under-researched. With mushrooming numbers of “Mum and Dad” investors, the recent sustained growth in stock markets, followed by the global financial crisis, this is clearly a significant issue.
This study aims to enrich the practice of marketing stock broker services by identifying what brokers can do to improve service quality and value in the face of relatively high customer expertise and add to the discipline of services marketing by extending the SERVQUAL instrument to stock broking in Singapore.
Stock trading in Singapore is governed by the Securities and Futures Act. Stock broking services refer to those provided by self-employed commission-based brokers (known as securities remisiers in Singapore), with a fundamental role of buying and selling stock for investors (Chan et al., 1991). Individuals who are employed by or acting for a company to carry out stock trading are required to hold a representative’s license. Service quality has been a national campaign in Singapore for more than two decades with an official program to help organizations assess and address gaps in service leadership, service ability and customer experience (SPRING, 2006). Capital and property markets are becoming more integrated and globalised (Chiang et al., 2008) and thus it is important that Singapore service quality is at least on par with
other nations. The Singapore market is becoming one of retail players. Retail players who trade at least once a year represented about 230,000 individuals or only 10 percent of the employed labour force (Business Times, 2006). With such a low percentage of the workforce involved in stock trading there is growing potential in the stock brokerage market with opportunities for brokers who have an understanding of service quality, perceived value and loyalty.
THEORETICAL FRAMEWORK
Service quality is generally considered a discrepancy between customer expectations and perceptions of service performance (Tam, 2004; Parasuraman et al., 1988; Gronroos, 1984). Durvasula et al., (2003/2004) examined the role of service quality in the cruise liner industry and found that it had both direct and indirect impacts on customers’ repeat purchases and recommendations of service to others. In research on the SERVQUAL model, Parasuraman et al. (1988) concluded that tangibles, reliability, responsiveness, assurance and empathy were five key dimensions. However, in research on stock brokerage service, tangibles was the least important factor of service quality and customers placed ability of the firm to provide personalized service as essential. Trust, attentiveness and sympathy were also highly valued (Lin and Wei, 1999).
A customer perceived service quality model developed by Gronroos (1984) suggested that it resulted from comparing expected service to perceived service in terms of technical and functional quality. An alternate model is the Gaps Model (Parasuraman
et al., 1985), where customer perceived service quality is the gap between desired service and perceived service performance. The quantitative SERVQUAL instrument with a 22-item scale to measure five key dimensions of service quality (reliability, responsiveness, assurances, empathy and tangibles) was based on the original Gaps Model (Parasuraman et al., 1986). The model was extended by expanding expectations from a single desired service level to add adequate service level, which is the lower level of expectation. The range between adequate service level and desired service level is the zone of tolerance. When perceived service is within the zone of tolerance, customers will be satisfied. Customers will be delighted if perceived service is above the zone and will be dissatisfied if perceived service is below the zone (Zeithaml et al., 1993). The SERVQUAL instrument was further modified to a
three-column format rating desired service, adequate service and perceived service with identical, side-by-side scales. This provides data for a perceived service
superiority gap (between perceived actual service and desired service) and perceived service adequacy gap (between perceived actual service and minimum expected) for diagnosing service quality (Parasuraman et al., 1994). The SERVQUAL instrument is widely known and extensively used, although is not without its critics (Ladhari, 2008).
Research on criteria applied by stock investors in selecting brokers in Hong Kong found four types of investors: gamblers, experienced investors, service seekers and green horns. Expectations of service were different among the four groups, related to their demographic and psychographic characteristics (Chan et al., 1991). In their research on customer satisfaction and retail banking, Jamal and Naser (2002) suggested that education and income levels were important factors influencing customer satisfaction. Similarly a study of financial services (credit cards) in Singapore found that gender and income were significant (Gan et al., 2008).
The effects of frequently used demographic variables: age, gender, education, income, marital status and occupation on service quality perception and customer satisfaction are inconsistent in previous research. This study attempts to provide empirical evidence of age, gender, marital status, educational and income level effects on service quality and customer satisfaction in stock brokerage services.
Customer expertise is the general ability of customers to use purchased services as a means of gaining general benefits, and their knowledge level of product or service types, usage and information (Chiou, 2003). Customer expertise has been examined in limited research (Ojasalo, 2001), but is particularly pertinent in financial services which are “quintessential credence services”, where customers are less able to evaluate service quality (Smith et al., 2007, p. 3).
Customer expertise consists of objective knowledge (actual information of product class in memory) and subjective knowledge (self-assessed knowledge of product class). Customers with high-level objective knowledge have higher expectations of
performance and expertise appears to be negatively related to service loyalty (Wirtz and Mattila, 2003).
Ojasalo (2001) classified levels of customer expertise into two levels: expert and novice, and each group had different expectations of service. Expert customers are more demanding and have strong implicit expectations. They are looking for long-term quality and have a larger zone of tolerance. Novice customers have fuzzy and unrealistic expectations, look for short-term quality and do not generally tolerate service failure.
Previous research has indicated the moderating effect of customer expertise on service performance expectations (Jamal and Naser, 2002). Increases in customer familiarity (number of purchase-related experiences) will increase customer expertise (Alba and Hutchinson, 1987). Expert customers have higher expectations (Jamal and Naser, 2002).
Customer perceived value has been of research interest in the marketing field over the last decade (Eggert and Ulaga, 2002). There are many definitions of perceived value. Researchers have not reached consensus on a single definition (Day, 2002). In parallel with the Gaps Model of service quality, Woodruff (1997) suggested that customer perceived value was the difference between desired value and perceived value.
Research on customer satisfaction has been a marketing research field for more than three decades (Tam, 2004). Marketing researchers have agreed that both service quality and customer satisfaction are important for business competitiveness (Dabholkar, 1993). Customer satisfaction is the result of a discrepancy between customer pre-purchase expectations and perceived performance (Tse and Wilton, 1988; Spreng et al., 1996). Pre-purchase expectations are influenced by personal needs, objectives and past experience. Customers are satisfied when performance matches or exceeds expectations. Customers are dissatisfied when negative disconfirmation occurs (Pizam and Ellis, 1999).
Research in customer loyalty has increased ten-fold in the last decade or so. Some describe four dimensions of loyalty, including cognitive, affective, intentional and behavioural (Han et al., 2008). Customer behavioural intentions include behavioural loyalty and attitudinal loyalty. The former leads to repurchases and the latter to word-of-mouth referrals (Durvasula et al., 2003/2004). Informed advisors in financial services who are able to convey more information to customers tend to engender attitudinal and behavioral loyalty (Martenson, 2008).
Thus the research objectives addressed in our study are as follows:
1 To examine the demographic characteristics of brokers’ customers and examine the relationship between demographics, customer expertise and service quality and customer satisfaction.
2 To measure service quality for stock brokers in Singapore and identify service gaps.
3 To measure service value and customer satisfaction for stock brokers in Singapore and identify gaps.
4 To explore customer loyalty in terms of behavioural intentions. 5 To extrapolate the SERVQUAL instrument to brokerage services in
Singapore
METHOD
For the purpose of this study, the SERVQUAL instrument with five dimensions of service quality was adapted. This instrument has been tested and used by many researchers in service quality in various industries (Cavana et al., 2007). To ensure reliability and validity of the survey, a pilot study was conducted and SERVQUAL was incorporated with modifications to the wording to apply to stock brokerage. A mail survey was conducted in Singapore during 2007. The questionnaire had four parts. Part A used SERVQUAL with its five dimensions (quality: reliability, responsiveness, assurance, empathy and tangibles) with three column format for desired, minimum and actual performance (Parasuraman et al., 1994). Part B evaluated service value based on ratings of importance of seven elements and actual
value of the seven. Part C assessed overall satisfaction with service quality and loyalty in terms of customer behavioural intentions. Seven-point Likert-scales from
1=extremely low to 7=extremely high were used. Part D sought details of customer demographics and experience in buying or selling stock.
Five Singapore Exchange brokerage firms were randomly selected from all brokerage firms, and one broker from each was requested to distribute a self-administrated questionnaire to their top 60 active stock investors. Out of three hindered questionnaires distributed, 188 (62.7 percent) were returned; 19 incomplete returns were discarded. The total useable sample of 169 represents an overall response rate of 56.3 percent. Cronbach’s Alpha calculated for Part A was 0.957 and Part B was 0.946 indicating a good reliability level. SPSS was used to analyze the data.
STUDY OUTCOMES Customer demographics
Among the customers, 59 percent were male and 41 percent female. A total of 72 percent were married. In terms of age, the largest group was in the 32-41 year range, comprising 37 percent. Customers with tertiary education level represented 54 percent. The largest group, 37 percent, were executives/managers. In terms of stock investment experience, most of the customers were experienced investors: 51 percent with more than six years of experience in stock trading and about 10 percent were new investors who had less than one year of experience or “green horns” using terminology from Chan et al. (1991). Among the customers, 43 percent were regular investors who traded at least once a month.
Gaps in service quality of Singapore brokers
The overall mean score of perceived service quality was 4.88 on a 7-point scale (see Table I and Figure I). This fell between desired expectation level (5.75) and minimum expectation level (4.60), and thus service quality was within the zone of tolerance, but was closer to minimum than to desired service expectation.
Table I: Mean of overall perceived service quality and five separate dimensions of service quality (n=169)
Minimum expected
Perceived actual Desired
Overall service quality 4.60 .932 4.88 .925 5.75 .740 Reliability 4.86 1.06 5.15 .999 6.10 .724 Responsiveness 4.77 1.06 5.04 1.10 5.96 .794 Assurance 4.67 1.09 4.92 1.05 5.80 .923 Empathy 4.48 1.06 4.58 1.15 5.59 .923 Tangibles 4.21 1.15 4.72 1.02 5.28 1.05
Service superiority was calculated by subtracting desired service from perceived actual service, indicating that perceived actual service quality is 15.1 percent below desired service quality. Service adequacy was calculated by subtracting minimum expected service from perceived actual service (Zeithaml et al., 1993) indicating the perceived service quality is 6.1 percent above adequate or minimum expected service quality.
Five dimensions of service quality
The high-low graph in Figure I shows mean scores of desired, minimum and actual service quality levels of the five dimensions and overall service quality.
Figure I about here
Mean scores on the five dimensions of service quality ranged from 4.58 to 5.15 of which reliability was highest and empathy lowest. The overall service quality gap can be broken down into gaps on each of the five dimensions as follows: empathy 18.1 percent, reliability 15.6 percent, responsiveness 15.4 percent, assurance 15.2 percent and tangibles 10.6 percent.
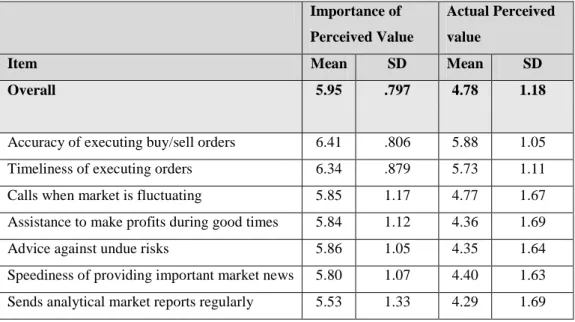
Perceived value and customer satisfaction with value
The survey requested customers to rate dimensions of value by their importance, and then rate their perception on those dimensions. The mean score of customer perceived value was 5.95 on a 7-point scale (Table II), which was relatively high. That is, customers have high expectations of their brokers for overall service value. On separate items, all scored at least 5.5 out of 7 in terms of customer attribution of importance, whereas with the exception of timeliness and accuracy, other elements
were all rated below 5.0. The mean score of customer perceived service value was 4.78, which was 19.7 percent below customer expectations.
Table II: Importance of perceived value compared to actual Importance of
Perceived Value
Actual Perceived value
Item Mean SD Mean SD
Overall 5.95 .797 4.78 1.18
Accuracy of executing buy/sell orders 6.41 .806 5.88 1.05
Timeliness of executing orders 6.34 .879 5.73 1.11
Calls when market is fluctuating 5.85 1.17 4.77 1.67
Assistance to make profits during good times 5.84 1.12 4.36 1.69
Advice against undue risks 5.86 1.05 4.35 1.64
Speediness of providing important market news 5.80 1.07 4.40 1.63
Sends analytical market reports regularly 5.53 1.33 4.29 1.69
Among the perceived value elements, accuracy rated the most important with a mean score of 6.41. The mean score of actual accuracy was 5.88, which was 8.3 percent below expectation. The second important element was timeliness at 6.34, followed by advice with a mean score of 5.86. The ratings for perceived timeliness and advice were 9.6 percent and 25.8 percent below expectation respectively. The least important element was market reports with 5.53 mean score. This element was also ranked the lowest in the perception of value, with a mean score of 4.29 representing 22.4 percent below expectation.
The mean score of customer satisfaction with service quality was 4.81 on a 7-point scale, which was only marginally high. This result indicates that stock brokers need to further improve their customers’ satisfaction by devoting more effort to service accuracy and timeliness.
Table III: Satisfaction with service quality
Item Mean SD
Satisfaction with service quality 4.81 1.04
Above ideal level 4.49 1.30
Unacceptable level (recoded) 5.26 1.47
Value for money 4.41 1.34
Overall satisfaction 4.69 1.27
Dissatisfaction (recoded) 5.08 1.58
Loyalty and customer behavioural intentions
The average mean scores on behavioural intentions were not high. The mean score of repurchases was 4.30 on a 7-point scale, while the mean score for word-of-mouth referrals to new customer was 4.43. Repurchases loyalty with a mean score of 4.69 was rated higher than attachment at 4.06. Behavioral loyalty and attitudinal loyalty need improvement.
The impact of customer demographics and expertise on service quality and satisfaction
To explore our service quality results further, several additional analyses were performed. The literature indicated that demographics are related to service quality, however none of gender, marital status, age, education level, income, or occupation was found to be significant for service quality or customer satisfaction. This suggests that for these brokers at least, there is no indication that they need to tailor their services to different demographic groups.
To explore the impact of customer expertise the sample was split into two groups: customers who make their trading decisions based on broker’s recommendations and those who don’t. The result of independent samples t-test showed that the difference in means for service quality of the two groups was significant (t= -3.379, df=167, p=0.001), with customers who rely on brokers’ recommendations rating higher service quality.
Table IV: Service quality for customers who rely on brokers’ advice compared to those who don’t.
Service quality
Rely on brokers’ recommendation N Mean SD
Std. Error Mean
Yes 50 5.2436 .92575 .13092
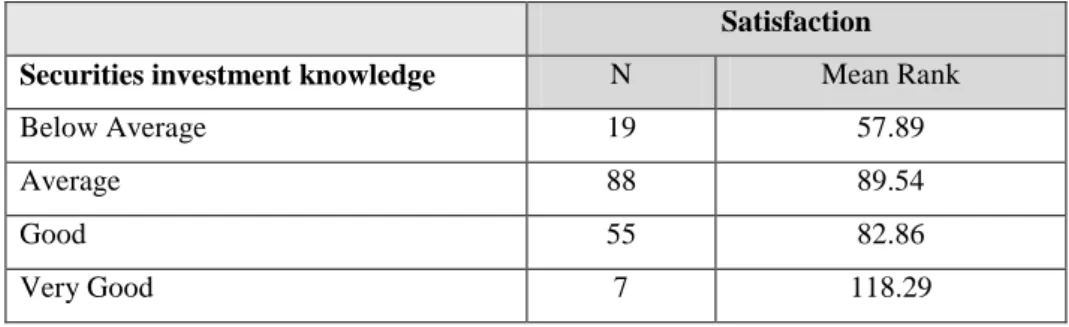
In addition, customers were grouped into four self-rated stock investment knowledge groups: below average, average, good and very good and satisfaction scores calculated for each group as shown in Table V.
Table V: Customer satisfaction for different levels of securities investment knowledge
Satisfaction
Securities investment knowledge N Mean Rank
Below Average 19 57.89
Average 88 89.54
Good 55 82.86
Very Good 7 118.29
A Kruskal-Wallis test indicated there was a significant effect of stock investment knowledge on customer satisfaction (X²=9.968, df=3, p=0.019), with more knowledge associated with higher satisfaction.
DISCUSSION
To address each of our research objectives in turn, firstly in terms of customer demographics, a picture emerged of thirty-something, married, tertiary educated executives of both genders, with several years’ trading experience. Rather than “Mum and Dad” investors, our cohort consisted more of relatively young, up and coming executives who were generally experienced investors. Given that brokers were asked to target their top active investors the maturity and experience is not surprising but it is useful to gain a profile of these investors, which can be used for target marketing. Within this cohort, demographics had no impact on service quality, whereas customer expertise did.
If customers become better educated about financial services they are in a better position to evaluate service quality and value (Smith et al., 2007) and our results corroborate this in that generally speaking, higher customer expertise was associated
with higher perceived service. More informed customers have more trust and are more likely to provide word-of-mouth referrals (Smith et al., 2007).
Our results highlighted performance deficiencies of stock brokers in important areas. Overall, service quality was within the zone of tolerance, but was closer to minimum (adequate) service than desired. There was a significant service quality superiority gap below customers’ desired level, and a somewhat smaller service adequacy gap. These finding suggested that stock brokers need to enhance their service quality for meeting customer expectations and bridging the fifteen percent gap, particularly given the emphasis on service from the Singapore government (SPRING, 2006).
Reliability was the most important dimension of desired service expectation, but performance of brokers on this dimension was nearly 16 percent below desired expectations. This could be the key factor that affected overall assessment of perceived service quality. What this means is that customers appear to be satisfied with how brokers provide basic service accurately and on time. However, given that this represents a minimum expectation there is room for improvement, and brokers could do more to delight their customers. In fact, in the desired service level, customers rated reliability as the highest on all dimensions of service quality. It seems self-evident that in financial transactions customers except close to perfect accuracy, and in broking, timeliness is essential due to movement in the market. Nonetheless, there is room for improvement here and brokers are advised to review accuracy and timeliness as a quality issue and further to communicate to their customers how accuracy and timeliness are ensured in their services. We concur with Smith et al. (2007) in that brokers should make sure customers have realistic expectations and remind them when they have been met.
Empathy was the lowest dimension of service quality, suggesting customers want a more personal relationship with their brokers. This is interesting given that many of these customers are long standing players in the market. The empathy questions related to giving individual attention, being caring, having the client’s best interests at heart, understanding their needs and being contactable. It seems that in addition to being competent professionals in buying and selling accurately and on time, brokers
would do well to relate to their customers as individuals. Training in interpersonal skills and understanding and communicating with customers as people, rather than simply sources of financial transactions seems to be called for, which fits with the “commercial friendship” notion (Han et al. 2008, p. 22-23). In other words, make the service about the customer and their needs (Smith et al., 2007).
What our results imply is that accuracy and timeliness are essential minimum standards for brokers yet are not perceived to be met consistently. There were significant gaps between the importance placed by customers on key components and perceived value. Our findings indicate that stock brokers have to enhance customers’ perception of their service value. They must put in more effort in improving areas relatively important to customers. Customers expect more value than they believe they receive. It would be advisable for brokers to be more proactive in providing assistance and advice, particularly in terms of buy/sell decisions, risk, market fluctuations and how to make gains. They also need to convince customers to rely on their advice as this is associated with higher service quality. Broker’s advice is valuable and adds to perceived quality of service, suggesting that brokers should emphasise this aspect of their service and find ways to encourage more customers to rely on their advice, or provide more advice. It would seem that developing personal relationships, such as demonstrating that they understand customer needs and have their best interests at heart, might be a way to facilitate this.
Providing a continual flow of information to customers is recommended by Smith et al. (2007), however our research suggests that the flow needs to be tailored, personal and targetted at customer expectations regarding risk, the state of the market and ways to capitalize on it. For example, analytical market reports were not perceived as particularly adding value in this study and should be reviewed. Our study suggests that if brokers wish to retain more loyal customers over a longer period it would serve them well to improve their relationships with customers, which includes their ability to provide informed advice, as noted by Martenson (2008).
The findings of this research facilitate stock investors to have a better understanding of key factors for assessing stock broker performance. The results assist them to have more realistic expectations of the service provided by their stock brokers. Investors want their brokers to be advisers and perhaps even commercial friends rather than just transaction processors, but this may be unrealistic compared to current service provision. Nonetheless, transaction processing can be done efficiently and quickly on-line and therefore it seems important that training and accreditation for brokers should emphasis both professional competence and service quality in terms of relationships or commercial friendship. Although online trading is seen as an impersonal alternative to broker services, individuals are more open to providing personal information and expect to use technology such as FaceBook and MySpace for social interactions (Hines, 2008). Thus brokers could also explore ways to use online trading and social networking sites to enhance personal relationships with customers.
Implications for industry
For stock brokers, the findings of this study enable them have a better understanding of factors that affect loyalty. This is important as customer loyalty leads to profitability (Hallowell, 1996), which would be particularly important to securities remisiers who work on a commission basis. In addition, with only ten percent of employed adults investing in the market there is significant scope for growth, and understanding what customers expect is likely to enhance growth.
These findings imply that stock brokers need to devote more efforts to improve in the areas that are highly important to the stock investors, such as reliability, responsiveness, accurate and timely executions of trading orders, advice on undue risks and empathy with the customer as a person. Improvement in these areas should enhance loyalty. Brokers could ask for referrals, perhaps including some incentive, but first they would need to have a closer personal relationship with their customers.
Performance of stock brokers was below the desired service expectations of stock investors. The industry should take effective action, such as organizing advancement courses, workshops and seminars, to upgrade the professional and customer services skills of the stock brokers in the areas that are highly valued by customers. The collective effort of the industry is an effective means to assist members of the industry
to improving the service standard of brokers and the industry as a whole for meeting stock investors’ expectations.
Implications for the Singapore government
The findings of this study have implications for the Singapore government which has constantly emphasized service quality and exceeding the expectations of customers for more than two decades (SPRING, 2006). This study provides empirical evidence and a theoretical framework for the government to assess the service standard of stock brokerage services more objectively. The result of this research facilitate the government to formulate a realistic development policy to upgrade customer service skills of stock brokers and other financial service providers for providing excellent service to customers.
Implications for the discipline
The SERVQUAL instrument stood up well in this study with good reliability and no anomalies in the results to suggest difficulties with translating it to the stock broking industry and Singapore. Nonetheless it isn’t the only measure of service quality available and Ladhari (2008) advocates the use of other measures.
In the literature, the environment in which service is delivered (servicescape) is important. The service quality dimension of tangibles, such as office appearance, was least important to customers. This could be due to most transactions being conducted by telephone and on-line trading becoming increasingly popular. As our study noted, the physical servicescape was not important. Harris and Ezeh (2008) assert that the individuals delivering service (in our case, brokers) are an important part of the social
servicescape. The relationship itself becomes the tangible (Smith et al., 2007). Our study reinforces this notion in that broker performance, service and relationships with customers all emerged as key factors in service quality.
LIMITATIONS
One limitation of this study was that the survey was only conducted in Singapore. Due to the unique market environment, cultural background and government policies,
the survey results may only represent Singapore as a case country and are not necessarily representative of stock markets in other countries. It would be interesting to do this research in a similar Asian region country such as Hong Kong, and by contrast, in a major Western area such as Wall Street. In addition the standard limitations of a one-shot, cross sectional survey also apply. Specific limitations of this study include that it was aimed at brokers’ top, active customers and as our results showed, level of expertise has some impact on the results. It would be interesting to investigate further the attitudes and experiences of greenhorns, as well as other types of investors
Further study opportunities
The result of this study addressed a gap in previous studies of brokerage services. More research is required in this field. A longitudinal dyadic study of broker-customer relations would provide greater illumination than a survey, but would be harder to generalize due to a smaller sample. However it would be interesting to explore loyalty issues such as change of brokers and recommendations in more depth. As on-line trading has become increasingly popular, further research on two different market segments of on-line and non-online stock investors would be meaningful in terms of service quality, particularly with Singapore becoming a global trading and communications hub (Hines, 2008, p. 21).
Apart from on-line and non-online investors, there are two other different market segments of investors: customers of securities remisiers (self-employed commission brokers) used in this study and stock dealers (salary based employees of licensed brokerage firms). Research on these segments would shed light on different perceptions, if any, of the customers of different categories of trading modes and service providers, along with the service quality and value of these different groups. In addition, the findings of this study will be useful if tested in other stock markets for determining whether they are unique to Singapore environment or generic to other markets.
CONCLUSION
This study successfully adapted the SERVQUAL instrument to stock brokers in Singapore. Demographic characteristics of broker customers had little relationship to
service quality but customers with more expertise had higher opinions of service. There were significant gaps in service quality, service value and customer satisfaction. Customer service encounters with stock brokers could be improved on a number of counts. There are significant service quality gaps in this sector and if brokers wish to retain personal clients, rather than have clients resort to impersonal, transaction-orientated, on-line trading, they need to develop better personal, empathetic relationships with customers, be more proactive in giving advice, and process transactions accurately and quickly. They also need to inform and educate customers to create realistic expectations. These actions may serve to improve customer loyalty and increase profitable word-of-mouth referrals in the face of a growing potential market.
REFERENCE LIST
Alba, J. W. and Hutchinson, J. W. (1987), “Dimensions of customer expertise”, Journal of Customer Research, Vol. 13, No. 4, pp. 411-54.
Boulding, W., Kalra, A., Staelin, R. and Zeithaml, V. A. (1993), “A dynamic process model of service quality: from expectations to behavioral intentions”, Journal of Marketing Research, February, pp. 7-27.
Business Times, (2006), Business Times, August 2, p. 4.
Caruana, A. and Msida, M. (2002), “Service loyalty: the effects of service quality and the mediating role of customer satisfaction”, European Journal of Marketing, Vol. 36, No. 7/8, pp. 811-28.
Cavana, R. Y., Corbett, L. M. and Lo, Y. L. (2007), “Developing zones of tolerance for managing passenger rail service quality”, International Journal of Quality & Reliability Management, Vol. 24, No. 1, pp. 7-31.
Chan, R., Chan, Y. K. and Yau, O. H. M. (1991), “Selecting a broker or a brokerage firm: segmentation of investors in the Hong Kong stock market”, European Journal of Marketing, Vol. 25, No. 10, pp. 17-28.
Chiang, Y. H., Joinkey, S. C. K. and Tang, B. S. (2008), “Time-varying performance of four Asia-Pacific REITs”, Journal of Property Investment & Finance, Vol. 26, No. 3, pp. 210-231.
Chiou, J. S. (2003), “The impact of country of origin on pre-trial and post trial product evaluations: the moderating effect of customer expertise”, Psychology and Marketing Vol. 20, No. 10, pp. 935-54.
Dabholkar, P. A. (1993), “Customer satisfaction and service quality: two constructs or one?” Enhancing Knowledge Development inMarketing, Summer, pp. 10-18. Dabholkar, P. A., Thorpe, D. I. and Rentz, J. O. (1996), “A measure of service quality for
retail stores: scale development and validation”, Journal of the Academy of Marketing Science, Vol. 24, No. 1, pp. 3-16.
Day, E. (2002), “The role of value in customer satisfaction”, Journal of Customer Satisfaction, Dissatisfaction and Complaining Behavior, Vol. 15, pp. 22-32.
Durvasula, S., Lobo, A. C., Lysonski, S. and Mehta, S. C. (2003/2004), “Cruising along: the impact of service quality in the cruise liner industry”, Asian Journal of Marketing, Vol. 10, No. 1, pp. 47-58.
Durvasula, S., Lobo, A. C., Lysonski, S. and Mehta, S.C. (2006), “Finding the sweet spot: A two-industry study using the zone of tolerance to identify determinant service quality attributes”, Journal of Financial Services Marketing, Vol. 10, No. 3, pp. 244-59.
Eggert, A. and Ulaga, W. (2002), “Customer perceived value: a substitute for satisfaction in business markets?”, Journal of Business & Industrial Marketing, Vol. 17, No. 2/3, pp. 107-18.
Gan, L. L., Maysami, R. C. and Koh, H. C. (2008), “Singapore credit cardholders: ownership, usage patterns, and perceptions”, Journal of Services Marketing, Vol. 22, No. 4, pp. 267-79.
Gronroos, C. (1984), “A service quality model and its marketing implications”, European Journal of Marketing, Vol. 18, No. 4, pp. 36-44.
Han, X., Kwortnik, R.J. and Wang, C. (2008), “Service loyalty: an integrative model and examination across service contexts”, Journal of Service Research, Vol. 11, No. 1, pp. 22-42.
Hallowell, R. (1996), “The relationships of customer satisfaction, customer loyalty, and profitability: an empirical study”, International Journal of Service Industry Management, Vol. 7, No. 4, pp. 27-42.
Harris, L.C. and Ezeh, C. (2008), “Servicescape and loyalty intentions: an empirical investigation”, European Journal of Marketing, Vol. 42, No. 3/4.
Hines, A. (2008), “Global trends in culture, infrastructure, and values”, Futurist, Vol. 42, No. 5, pp. 18-23.
Jamal, A. and Naser, K. (2002), “Customer satisfaction and retail banking: an assessment of some of the key antecedents of customer satisfaction in retail banking”,
International Journal of Bank Marketing, Vol. 20, No. 4, pp. 146-60. Ladhari, R. (2008), “Alternative measures of service quality: a review”, Managing
Lin, X. and Wei, B. (1999), “Service quality dimensions of stock brokerage firms: what customers consider as important”, Journal of Professional Service Marketing, Vol. 20, No. 1, pp. 135-46.
Martenson, R. (2008), “How financial advisors affect behavioral loyalty”, International Journal of Bank Marketing, Vol. 26, No. 2, pp. 119-147.
Ojasalo, J. (2001), “Customer expertise: a challenge in managing customer relationships in professional business-to-business services”, Marketing Quarterly, Vol. 22, No. 2, pp. 1-16.
Parasuraman, A. and Grewal, D. (2000), “The impact of the technology on the quality-value-loyalty chain: a research agenda”, Journal of the Academy of Marketing Science, Vol. 28, No. 1, pp. 168-74.
Parasuraman, A., Zeithaml, V. A. and Berry, L. L. (1985), “A conceptual model of service quality and its implications for future research”, Journal of Marketing, Vol. 40, No. 4, pp. 41-50.
Parasuraman, A., Zeithaml, V. A. and Berry, L. L. (1986), “SERVQUAL: A multiple-item scale for measuring customer perceptions of service quality”, Marketing Science Institute, working paper, Cambridge, Mass.
Parasuraman, A., Zeithaml, V. A. and Berry, L. L. (1988), “SERVQUAL: A multi-item scale for measuring customer perception of service quality”, Journal of Retailing, Vol. 64, No. 1, pp. 12-40.
Parasuraman, A., Zeithaml, V. A. and Berry, L. L. (1994), “Alternative scales for measuring service quality: a comparative assessment based on psychometric and diagnostic criteria”, Journal of Retailing, Vol. 70, No. 3, pp. 201-30.
Patterson, P. G. and Spreng, R. A. (1997), “Modelling the relationship between perceived value, satisfaction and repurchase intentions in a business-to-business, service context: an empirical examination”, International Journal of Service Industry Management, Vol. 8, No. 5, pp. 414-34.
Pizam, A. and Ellis, T. (1999), “Customer satisfaction and its measurement in hospitality enterprises”, International Journal of Contemporary Hospitality Management, Vol. 11, No. 7, pp. 326-39.
Rust, R.T. and Oliver, R. L. (1994), “Preface”, in Service Quality: New Directions in Theory and Practice, pp. vii-ix in Rust R. T. and Oliver, R. L. (Eds.), Sage Publications, Thousand Oaks.
Securities and Futures Act, Singapore Monetary Authority website: (accessed in July 2006).
Smith, R. K., Vibhakar, A. P. and Terry, A. (2007), “Strategic marketing guidelines for financial planning professionals”, Services Marketing Quarterly, Vol. 28, No. 4, pp. 1-20.
Spreng, R. A., Mackenzie, S. B. and Olshavsky, R. W. (1996), “A reexamination of the determinants of customer satisfaction”, Journal of Marketing, Vol. 60, No. 3, pp. 15-32.
SPRING (Standards, Productivity and Innovation Board of Singapore) available at:
Tam, J. L. M. (2004), “Customer satisfaction, service quality and perceived value: an integrative model”, Journal of Marketing Management, Vol. 20, No. 7/8, pp. 897-917.
Tse, D. K. and Wilton, P. C. (1988), “Models of customer satisfaction formation: an extension”, Journal of Marketing Research, Vol. 25, No. 2, pp. 204-12.
Wirtz, J. and Mattila, A. S. (2003), “The effects of customer expertise on evoked set size and service loyalty”, Journal of Services Marketing, Vol. 17, No. 7, pp. 649-65. Woodruff, R. B. (1997), “Customer value: the next source for competitive advantage”,
Journal of the Academy of Marketing Science, Vol. 25, No. 2, pp. 139-53.
Zeithaml, V. A., Berry, L. L. and Parasuraman, A (1993), “The nature and determinants of customer expectations of service”, Journal of the Academy of Marketing Science, Vol. 21, No. 1, pp. 1-12.