Knowledge Visualization
Robert MeyerAbstract— Knowledge Visualization is a relatively new field of research that focuses on the creation and transfer of knowledge by visualizations with and without the help of computers. It is ought to be a mediator between a lot of different disciplines. This paper gives an overview of the concept of Knowledge Visualization, especially in regard to the definition of Remo A. Burkhard, who worked on the topic in-depth in his dissertation. Therefore the seeds of the concept, its goals and theoretical backgrounds like the Knowledge Visualization model are presented in this work. As it is a very interdisciplinary field of research an overview about the participated disciplines is given. The differences to Information Visualization, which was the key issue of the Media Informatics Advanced Seminar, for which this paper was written for, are also outlined in detail. Additionally the methods to visualize knowledge are categorized and presented as well as three approaches that should help to find the best visualization method for each purpose.
Index Terms—Knowledge Visualization, Information Visualization, Knowledge Management, Overview
1 INTRODUCTION
The knowledge of the world increases massively while the half-life of knowledge decreases [22]. Moreover, time gets a rare resource but is needed to communicate the more and more complex knowl-edge. That is the reason why traditional ways to exchange knowledge among people are probably not sufficient any more. Using mainly text and numbers instead of proper visualizations does not fit the require-ments of our knowledge society any more. But it is not enough just to search for ways to transfer knowledge: It is also important to help those who want to use the power of visualization by proposing them advice, which visualization method fits best for the particular problem [8]. The architect Remo Aslak Burkhard analyzed in his PhD thesis [8] the topic of visualization and proposed a new field of research to cope with the mentioned problems: Knowledge Visualization, which is an essential part in knowledge management. Its goals are to transfer and create new knowledge through using visualizations. These visualiza-tions do not necessarily have to run on computers - some visualization methods were used a long time before the invention of information technology. But at least these methods could be supported by visu-alization software to increase their efficiency. Burkhard analyzed the way how architects communicate information about one object (for ex-ample a skyscraper) to the different target groups like engineers, work-ers, lawyers or clients, which all have different conceivabilities and a different background of knowledge. He found the insight, that archi-tects combine different complementary visualization types to address the mind of every participant with different levels of detail. Based on this conclusion Burkhard tries to build a framework of Knowledge Vi-sualization. It should especially help managers to use and create visual representations of business processes [8].
This paper gives an overview about the topic of Knowledge Visual-ization - especially in the context of Burkhard’s definition - and some related fields of research. It is meant to be a short insight into the topic without the focus on critics or continuative thoughts. Therefore chap-ter 2 gives an outline of some basic definitions and knowledge back-ground necessary to understand the ideas of Knowledge Visualization. As Knowledge Visualization is not an independent area of research but interdisciplinary grounded, those roots and relationships are presented in chapter 3. Afterwards the main format types of visualization are introduced in chapter 4, which are classified in order to map the opti-mal visualization to the actual problem in chapter 5. Last but not least chapter 6 concludes this paper with an outlook on the possible future fields of application of Knowledge Visualization
• Robert Meyer is studying Media Informatics at the University of Munich, Germany, E-mail: [email protected]
• This research paper was written for the Media Informatics Advanced Seminar on Information Visualization, 2008/2009
2 OVERVIEW
The following subchapters give a short overview about the topic of Knowledge Visualization. After defining the relevant terms used in this paper in subchapter 2.1, subchapters 2.2 to 2.4 shows the need for Knowledge Visualization in consideration of discovering and transfer-ring knowledge. Finally Burkhard’s model of Knowledge Visualiza-tion is introduced in subchapter 2.5.
2.1 Basic Definitions
A lot of terms like information and knowledge are used in everyday speech synonymously even though they have different meanings. The following basic definitions from Keller and Tergan [21] are based on the concepts of Russell Ackoff, a systems theorist and professor of organizational change [2].
Dataconsists of symbols and facts, which are isolated and not in-terpreted yet. It has no relation to other data and has no meaning of itself. For example the sentence ”It is raining” describes only a fact that water drops fall from the sky.
Informationis more sophisticated. It is data that has been inter-preted or processed and therefore contains some meaning and can give answers to questions like ”who?”, ”what?”, ”where?”, ”why?” or ”when?”. For those who do not comprehend the meaning it still stays data [21]. For example if ”because the temperature dropped 15 degrees” is added to ”It is raining” it becomes information through the understanding of cause and effect for certain people. Abstract in-formation that has no natural visual representation is in the focus of Information Visualization (see chapter 3.1.)
Knowledgeis one step further ”information, which has been cog-nitively processed and integrated into an existing human knowledge structure” [21] (p.3). Knowledge is dynamic as ”its structure is con-stantly being changed and adapted to the affordances in coping with task situations” [21] (p.3). A good way to distinguish between infor-mation and knowledge is the differentiation, that inforinfor-mation is out-side the brain whereas knowledge is inout-side [21]. This means for the rain example, that not only the connection between cause and effect is understood, but also the concept behind this effect (here the relation between temperature and humidity in the atmosphere).
According to Tergan ”Knowledge visualizationis a field of study, that investigates the power of visual formats to represent knowledge. It aims at supporting cognitive processes in generating, represent-ing, structuring retrieving sharing and using knowledge” [31] (p.168). Burkhard offers another definition. According to him Knowledge Vi-sualization ”[...] examines the use of visual representations to improve the transfer and creation of knowledge between at least two persons.” [7] (p.3). Because this paper focuses mostly on Burkhard’s concept of Knowledge Visualization, his definition will be the basis in the follow-ing chapters.
2.2 The need for Knowledge Visualization
Burkhard [8] proposes Knowledge Visualization as a new field of re-search and therefore canvasses for its establishment. First of all the lack of research on transferring knowledge in the domain of business knowledge management was one of the reasons to start researching on this topic and to introduce the term ”Knowledge Visualization”. It is also asserted, that there are a lot of visual formats existing, but only a subset is used for a visual transfer of knowledge in organizations, like clip arts or diagrams. Therefore the existing visualizations must be mapped to real world problems as well as evaluated about their strengths and weaknesses. Burkhard criticizes, that findings in related fields of research are not transferred into knowledge management as an interdisciplinary mediating framework is still missing, that could integrate findings from other domains like visual communication sci-ences or information design. That is why a theoretical basis of Knowl-edge Visualization is needed. Furthermore he finds fault with the fact, that Information Visualization researchers succeeded in creating new insights based on abstract data, but they do not concentrate enough on how to transfer these insights to the recipients. In addition the narrowed view of Information Visualization on computer supported methods should be widened to a broader perspective of visualizations, for example on the concepts of visualizations in the architectural con-text. These problems should be addressed with the introduction of Knowledge Visualization as a new field of research [8].
2.3 Generating Knowledge
According to Burkhard’s definition of Knowledge Visualization it should assist in creating new knowledge. This is relevant on the one hand for individual learners and on the other hand for groups which use visualizations for example in workshops. The working memory of a single person to store information is limited in capacity as well as in time information. Visualizations may help to reduce the cognitive load and enhance the processing abilities by visualizing abstract rela-tionships. They allow to externalize knowledge for example to share it with others or to get an overview about the big picture of the field of interest [31]. Visualizations enable innovation as they offer methods to use the creative power of imagery, for example by using a visual metaphor (see chapter 4.4). In contrast to text based knowledge it is possible to rearrange visualized knowledge very fast and jointly, for example by visualizing the ideas with sketches (see chapter 4.1) [20].
Novak [26] examines the effects of collaborative Knowledge Visu-alization on Cross-Community Learning and identifies the Knowledge exchange between heterogeneous communities of practice as the crit-ical source of innovation and creation of new knowledge. Individuals participate in communities, which share for example the same needs, goals, problems or experiences. Through interaction and social rela-tionships between the members of the communities new knowledge can be created with the help of visualizations. Novak discusses this on the example of netzspannung.org, a knowledge portal that provides insight in the intersections between digital art, culture and informa-tion technology. The heterogeneous user group which consists of for example artists, researchers, designers or journalists can use person-alized Knowledge Maps (see chapter 4.3.1) and a shared navigational structure which allow them to explore the relationships between dif-ferent topics or fields of profession [26].
2.4 Transferring Knowledge
Transferring knowledge is for example necessary to grant access to the achieved knowledge from one person to another one. This could be for example a manager that has to come to a decision on the basis of the knowledge of his consultant. Knowledge Visualization serves as a conceptual bridge to increase the speed and the quality of knowledge transfer among and between individuals, groups or even whole orga-nizations [20]. Knowledge transfer struggles with a few challenges, which need to be solved by the stakeholder who transfers the knowl-edge to the recipient. First of all the relevant information for the differ-ent stakeholders has to be iddiffer-entified. Then a trade off about the depth of information has to be found and it must be decided if an overview is enough or if more detailed information is necessary. This depends
on the available amount of time, the attention or the capacity of the re-cipients. The different cognitive backgrounds of the recipients have to be considered as well because it is only possible to understand some-thing if it can be connected to already available knowledge - maybe the recipients are decision makers that do not understand the new vi-sualization tools [7]. If these challenges are not considered properly they will cause a few elementary problems. One major problem in organizations is information overload, which is caused by the increas-ing quantity and the decreasincreas-ing quality of information. This hampers the ability to identify the relevant information. Therefore it is neces-sary to offer strategies for a better filtering of information concerning quality and relevance [8]. In addition to that the risk of misinterpreta-tion if the decision makers do not understand the informamisinterpreta-tion and mis-use it by making the wrong decisions is another consequence of false knowledge transfer [7]. During presentations normally only a very limited set of visualization tools is used to transfer knowledge, like Microsoft PowerPoint or business diagrams and these tools are often used wrongly due to the lack of visualization competency. Knowledge Visualization wants to address these drawbacks by offering evaluated visualization tools and by helping to choose the best visualization for each problem [8].
2.5 The Knowledge Visualization Model
Burkhard concludes the findings of his research during his dissertation into a Knowledge Visualization Model. This model is based on the insight that knowledge cannot be transferred directly from one person to another. The recipients of transferred knowledge have to integrate it into their own knowledge depending on their individual backgrounds and experiences. The key strategy is the usage of complementary vi-sualizations for the different steps in the knowledge transfer process to archive an efficient and successful transfer of knowledge from a ”sender” to a ”receiver”. The following five questions should be an-swered in the model:
• What is the aim and the effect of externalizing knowledge into visual representations?
• What is relevant and should be visualized? • Which audience should be addressed? • What is the interest of the recipient?
• What is the most efficient way to visualize the knowledge?
Figure 1 shows a schematic diagram to visualize the idea of the model. The model is divided into three components:
1. The mental model of the ”sender”
2. A medium that is build from the external visual representation of the knowledge
3. The mental model of the recipient
The mental model is in that case an internal representation of knowl-edge in the memory of a particular person.
The ”sender” wants to transfer a certain part of his knowledge to the ”receiver”. Therefore he externalizes his knowledge into visual-izations, which are the source for the recreation process of the ”re-ceiver” who tries to internalize it again into his knowledge. In case of questions or misunderstandings he can use a feedback loop to the ”sender”, who has to modify his existing visualizations or create new ones to serve the needs of the ”receiver”. Burkhard proposes a specific substructure of the visual knowledge representation. There should not be only one type of visualization for the whole transfer process but a few complementary visualizations for different purposes. First of all a visualization must catch theattentionof the ”receiver” to make him open for the knowledge from the ”sender”. This may be achieved with a provoking image for example. Then in a second stage thecontextof the knowledge must be illustrated to make the recipient aware of the importance of the knowledge for him. Then anoverviewshould show the big picture on the topic followed by someoptions to act, which enable the ”receiver” to focus his interests during the presentation of
thedetailsin the third stage of the transfer process. The author ac-knowledges that this model has its limitations due to the fact that all humans have different abilities to interpret visual stimuli, but it is at least a general guideline for using Knowledge Visualization [8].
Fig. 1. The Knowledge Visualization Model [8]
3 CONNECTIONS TO OTHER FIELDS OF RESEARCH
Knowledge Visualization is a very interdisciplinary field of research that combines findings of various sciences. Therefore it is not sur-prising that its concept, which has among others relationships to the communication-, business and computer sciences, was introduced by an architect. This interdisciplinary approach inspires other researchers to study into similar directions. Silke Lang [23] for example uses the ideas of Knowledge Visualization in order to merge knowledge from the different disciplines architecture, engineering, management, and nature sciences to find a common language among these different schools of thinking. This chapter describes the roots of Knowledge Visualization and its relations to other fields of research.
3.1 Information Visualization
There is a big relationship between Knowledge- and Information Vi-sualization as they both help to visualize different abstraction levels of data (see chapter 2.1). Therefore this subchapter discusses the similar-ities and differences between Knowledge- and Information Visualiza-tion.
3.1.1 Definition of Information Visualization
The term ”Information Visualization” is not exclusively used in the context of computer science, for example psychologists use it as ”[...] an umbrella term for all kinds of visualization” [21] (p.7). Card et al. define it as ”the use of computer-supported, interactive, visual representation of abstract non-physically based data to amplify cog-nition” [14] (p.7). Its methods allow ”to explore and derive new in-sights through the visualization of large sets of information” [8] (p.23). The theories of Information Visualization are based on information design, computer graphics, human-computer interaction and cognitive science. Users can explore data in real time and discover specific pat-terns visually with Information Visualization applications. These ap-plications are interactive, dynamic and embed details in context, what means that the user first gets an overview, then the visualized infor-mation is reduced by zooming in and filtering and then last but not least details are accessible on demand. Working with Information Vi-sualization methods is much more efficient than working with normal database queries when the knowledge about the data is very low, be-cause the human perception can identify information patterns visually that are very hard to find by working on the pure data [14], [8], [21]. 3.1.2 Differences and Similarities
Information- and Knowledge Visualization are both based on the abil-ities of the human perception system, which is able to process visual representations very effectively, but the content and the process of the respective discipline differ [8]. The major limitations of Information Visualization in contrast to Knowledge Visualization are the very strict
focus on computer-based visualizations. Non-computer based visual-izations (like sketches) and knowledge types, which cannot be put into a digital carrier (like a database), are ignored [5].
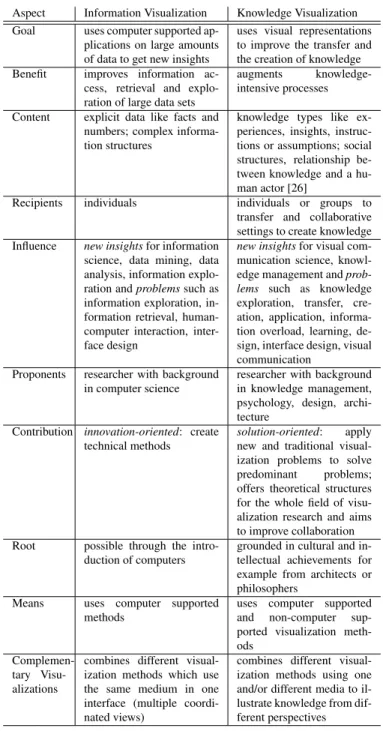
Table 1compares ten aspects concerning the goals, the origins and the techniques of both fields of research:
Aspect Information Visualization Knowledge Visualization Goal uses computer supported
ap-plications on large amounts of data to get new insights
uses visual representations to improve the transfer and the creation of knowledge Benefit improves information
ac-cess, retrieval and explo-ration of large data sets
augments knowledge-intensive processes Content explicit data like facts and
numbers; complex informa-tion structures
knowledge types like ex-periences, insights, instruc-tions or assumpinstruc-tions; social structures, relationship be-tween knowledge and a hu-man actor [26]
Recipients individuals individuals or groups to transfer and collaborative settings to create knowledge Influence new insightsfor information
science, data mining, data analysis, information explo-ration andproblemssuch as information exploration, in-formation retrieval, human-computer interaction, inter-face design
new insightsfor visual com-munication science, knowl-edge management and prob-lems such as knowledge exploration, transfer, cre-ation, appliccre-ation, informa-tion overload, learning, de-sign, interface dede-sign, visual communication
Proponents researcher with background in computer science
researcher with background in knowledge management, psychology, design, archi-tecture
Contribution innovation-oriented: create technical methods
solution-oriented: apply new and traditional visual-ization problems to solve predominant problems; offers theoretical structures for the whole field of visu-alization research and aims to improve collaboration Root possible through the
intro-duction of computers
grounded in cultural and in-tellectual achievements for example from architects or philosophers
Means uses computer supported methods
uses computer supported and non-computer sup-ported visualization meth-ods
Complemen-tary Visu-alizations
combines different visual-ization methods which use the same medium in one interface (multiple coordi-nated views)
combines different visual-ization methods using one and/or different media to il-lustrate knowledge from dif-ferent perspectives Table 1. Information Visualization vs. Knowledge Visualization [5]
3.2 Visual Perception
The human visual perception system and its vast abilities are the result of the evolution of mankind. In former times it was for example neces-sary for surviving to improve the skills of motion detection for hunting and color detection for seeking fruits. These perceptions are processed pre-attentively and very fast by the human information processing sys-tem and are therefore accessible intuitively without the need for active
cognition. After processing the visual information it has to be inte-grated and perceived in ones mind as a combination of sensory in-formation and previous experiences. Burkhard sums up the findings of some empirical studies with the conclusion, that ”visual represen-tations are superior to verbal represenrepresen-tations in different tasks” [8] (p.42). The principles of the Gestalt psychology are good examples for the perceptual phenomena. The viewer of some simple graphics based on these principles recognizes patterns, which are actually not there but added by his perception system [8]. Ralph Lengler [24] iden-tifies the basic visual core competences and refers to them as ”visual literacy”. He also assumes that the ability to process visualizations will raise similar to the finding, that the average intelligence quotient raised over the last decades. The future generations are ought to cope with much more complex visualizations as the processing capabili-ties for visualizations are for example trained by playing 3D computer games. A deep understanding of the human visual perception system is necessary to enable the creation and the use effective knowledge visualizations.
3.3 Learning Theories
As one of the goals of Knowledge Visualization is the transfer of knowledge where a ”receiver” has to understand the given information from a ”sender”. This can be seen as a learning process and there-fore it is obviously useful to consider the findings form educationalists and learning psychologists. Learning theories help to understand how knowledge is created from information and how this process is related to social interaction with others [26]. Three major learning theories propose advises how to design the learning process.
• Behaviorismgrounds on the assumption, that learning bases on the principle of stimulus and response without respect to the mental model of the learner, which is considered as a ”black box”. It recommends that knowledge should be split up and transferred in small learning steps
• Cognitivismgoes one step further and opens this ”black box”. The cognitive process, which is necessary to transform infor-mation into knowledge, is the focus of this theory. Therefore knowledge should be transferred in a way that it can be used for problem solving.
• Constructivism sees learning as an ”active process in which learners construct new ideas or concepts based upon their cur-rent/past knowledge” [8] (p.24). Therefore the learner has to create the knowledge based on his own experiences.
The findings of these theories have to be considered when knowledge has to be transferred with the help of visualizations, deepening on the type of knowledge [8], [29].
3.4 Visual Communications Science
In a lot of different isolated research fields people are seeking for the effective design of information, which are summed up here with the term ”Visual Communications Science”.
• Information design is the science of preparing information so that it is comprehensible, retrievable and easy to translate into actions. It focuses on mainly static visual formats like maps or posters and not on computer-supported techniques like Informa-tion VisualizaInforma-tion.
• Information Architectureconcentrates on graphic-, interface, in-teraction and human computer design and focuses in contrast to information design more on structural than on presentational matters.
• Information Art focuses on aesthetic and emotional issues to show possibilities of digital visual communication design. All these fields of research contribute to the topic of an effective visual transfer of knowledge, but a framework is necessary to combine their findings [8].
3.5 Communication Science
The communication science offers models that describe the communi-cation of individuals and groups of individuals. As visualizing knowl-edge is mainly engaged in communicating the knowlknowl-edge from one stakeholder to another one, an effective transfer of knowledge depends on an effective communication of the content for example concerning the participants, the transferred message and the used channels. The Knowledge Visualization Model, which is introduced in chapter 2.5, is grounded on six different communication models. These models and their respective contribution to the Knowledge Visualization Model are described in detail by Burkhard [8].
3.6 Knowledge Management
Burkhard [8] (p.227) defines that ”Knowledge Management is a man-agement perspective that offers theories, strategies, and methods to manage, i.e., to identify, access, share, and create knowledge in orga-nizations, with the aim to help an organization to compete by being more innovative, effective, and thus more profitable.” This definition shows some similarities with the definition of Knowledge Visualiza-tion, especially concerning the tasks of sharing and creating knowl-edge, but Knowledge Management contains a much broader spectrum of tasks like storing or retrieving knowledge. Thus it is possible to classify Knowledge Visualization as a component of Knowledge Man-agement, particularly because the knowledge transfer process is a key process in knowledge intensive organizations [5], [8].
3.7 Knowledge Communication
Martin Eppler defines Knowledge Communication as an ”activity of interactively conveying and co-constructing insights, assessments, ex-periences or skills through verbal and non-verbal means.” [18] (p.5). It includes the successful transfer of how, why, know-what and know-who through face-to-face ore media based interac-tions. Knowledge Communication focuses on the communication pro-cess between domain experts and decisions makers in management and analyzes the difficulties between those two stakeholders. The re-search area includes Knowledge Management, Communication stud-ies, Expertise and Decision Making. The fields of Knowledge Visu-alization and Communication have a big intersection in their roots as well as in their goals. This is not astonishing as Eppler and Burkhard share very similar research interests and published some papers to-gether, for example [20]. Knowledge communication is in some re-spects like the strict focus on decision makers and experts a restriction to the concept of Knowledge Visualization, but on the other hand an extension as it does not concentrate on the visualization topic so much. Nevertheless they are two very related fields of research. Eppler was also involved in developing the tool ”Lets focus”, which is a powerful tool to visualize knowledge in various ways (available at http://de.lets-focus.com) [18].
4 TYPES OFKNOWLEDGEVISUALIZATION
Until the work of Burkhard [8] a taxonomy of visualizations based on the type of visualization was missing. Therefore he took the most common seven visualization tool categories of architects - which are in his opinion experts in using different visualizations for different target groups and purposes - and evolved them to general categories for types of Knowledge Visualization. These seven types are presented in this chapter in Burkhard’s sequence, enriched with contributions of other authors and some practical examples.
4.1 Sketch
Sketches are simple drawings that help to visualize the key features and the main idea very quickly. They are relatively old since already Leonardo da Vinci used them to visualize his insights and investiga-tions. Sketches can be used in group reflections and communication processes as they make knowledge debatable. Additionally they allow room for own interpretations and thus stimulate the creativity and keep the attention of a group fixed on the discussed object [5], [8].
4.2 Diagram
Diagrams are abstract, schematic representations that are used to dis-play, explore and explain relationships. They reduce complexity, make abstract concepts accessible and amplify cognition. Unlike sketches they are precise and determined. Examples for diagrams are bar- and pie charts, Gantt-, Fenn- or process diagrams [8].
4.3 Map
Maps or plans are in the architectural context used to present enti-ties on a different scale and to bring three-dimensional objects into a two-dimensional visualization. Maps present overview and detail at the same time, help to structure information, motivate and activate employees, establish a common story and ease access to information. Maps are a very busy field of interest in the context of Knowledge Vi-sualization and therefore presented relatively detailed in this chapter by introducing knowledge- and Concept Maps as well as by showing some example usages of maps [11], [8], [20]. Burkhard uses the map visualization ofFigure 6in a case study for the Knowledge Visualiza-tion Framework in chapter 5.1.2.
4.3.1 Knowledge Maps
A Knowledge Map is defined in as a ”Guide to, or inventory of, an organization’s internal or external repositories or sources of informa-tion or knowledge.” [12]. According to Eppler [17] Knowledge Maps consist of two components: Thecontext, which should be easy to un-derstand for all users of the map, like a network of experts or a project, is represented by a ground layer whileindividual elementslike experts and project milestones are mapped within this context. The elements are grouped in order to show their relationships, locations or qualities [11], [8].
Eppler [17] differs between five kinds of Knowledge Maps: 1. Knowledge source mapsstructure a population of company
ex-perts along relevant search criteria
2. Knowledge asset mapsqualify the existing stock of knowledge of persons, groups or organizations
3. Knowledge structure mapsoutline the global architecture of a knowledge domain and its relationships
4. Knowledge application mapsshow which type of knowledge has to be applied at a certain process stage or in a specific business situation
5. Knowledge development mapsdepict the necessary stages to de-velop a certain competence
Figure 2shows an example of an Knowledge asset map, which is the stock of knowledge of a consultant company [17].
Fig. 2. A exemplary knowledge asset map of a consulting company [17]
4.3.2 Concept Maps
Donald Dansereau [16] describes the principles of Node-Link map-ping, which was found already in 1972. Node-Link maps are used in the fields of education, counseling, and business. They consist of nodes, which contain information, and links that show the relationship between the different pieces of information. The idea of maps built
from nodes and links are the basis for Concept Maps, which Sigmar-Olaf Tergan [30] utilizes in his approach to use maps for managing knowledge and information. The term ”Concept Map” was introduced by Novak and Godwin in their book ”Learning how to learn” [28]. Concept maps are intended ”to represent meaningful relationships be-tween concepts in the form of propositions. Proposition are two or more concept labels linked by words in a semantic form.” [28] (p.15)
Figure 3shows a Concept Map that recursively displays the the node-link structure of Concept Maps. Tergan [30] analyzes the possibili-ties of digital Concept Maps to support individual knowledge man-agement and gives an overview about some already existing concepts. He discusses together with Burkhard and Keller if digital concept can be a bridging technology, that could overcome some shortcomings of Information- and Knowledge Visualization [31].
Fig. 3. A Concept Map of the node-link structure of a Concept Map [30]
4.3.3 Example applications for maps
The following paragraphs outline some exemplary usages of maps in the context of Knowledge Visualization
Personal Knowledge Maps: Jaminko Novak et al. [27] discuss an agent-based approach to discover, visualize and share knowledge through personalized learning in large information spaces. Therefore they use a Knowledge Map, which consists of a content map that vi-sually clusters related documents, and a Concept Map, that extracts documents from the content map and visualizes relationships in be-tween them. The ideas are realized on the Internet platform netzspan-nung.org, which is a knowledge portal that aims to provide insight in the intersections between digital art, culture and information technol-ogy.
Kmap: Zhang Yongjin et al. [32] developed the platform and application ”Kmap”, that supports the creation and visualization of knowledge through Node-Link like maps. They focus on the transfor-mation from implicit / tacit knowledge, which is highly personal and difficult to formalize and thus difficult to communicate and share, into explicit knowledge, which can be expressed symbolically in words and pictures and thus be shared in the form of data or visualizations [21].
CmapTools: Canas et al. [13] introduce a software based on Con-cept Maps, which empowers users to either individually or collabora-tively represent, share and publish knowledge. CmapTools is able to organize repositories of different kinds of information and allows easy browsing of and searching within this organized information. It is available for free at http://cmap.ihmc.us.
Webster: Sherman R. Alpert [1] presents the concept of Webster, which is a Concept Map based tool for personal knowledge manage-ment that helps to organize knowledge and information resources for reference and learning purposes. The main idea is to integrate all kinds of digital information like text, sound or video to enable the learner to gain a deep understanding of the domain of interest.
LEO: The Learning Environment Organizer LEO, described by John W. Coffey [15], is a extension of the software tool CmapTools which support courseware design and delivery. It serves as a meta-cognitive tool for course designers and an advance organizer for stu-dents and supports course designers or instructors in visualizing and planning courses, which are afterwards presented to the students.
4.4 Images
Images can be renderings, photographs or paintings that may repre-sent the reality but can also be artistic. They are able to address emo-tions and can inspire, motivate or energize the audience and thus often used for advertisements. Special kinds of images arevisual metaphors, which are - as they were already used by Aristotle - ancient, but pow-erful tools for transferring insights. They are ”graphic depictions of seemingly unrelated graphic shapes (from other than the discussed do-main area) that are used to convey an abstract idea by relating it to a concrete phenomenon” [20] (p. 15). This can be a natural phe-nomenon like an iceberg, man-made objects like a bride, activities like climbing or abstract concepts like war. Images can be used to get at-tention, inspire recipients, address emotions, improve recall or initiate discussions [20], [8].
4.5 Objects
Architects use physical models to show projects from different per-spectives. They allow to explore an object in the third dimension, which helps to attract recipients for example on exhibitions and fos-ters learning. Interactive 3D models can maybe have similiar effects as they allow different perspectives as well. Objects strongly amplify the effect of visual metaphors if these two visualization types are com-bined [8].
4.6 Interactive Visualization
Computer-based interactive visualizations allow to access, control, ex-plore, combine and manipulate different types of complex data, infor-mation and knowledge. They also fascinate the recipients and enable interactive collaborations and thus help to create new insights. Infor-mation Visualization makes heavy usage of interactive visualizations as they fit the requirements of this field of research very well. Anima-tions can be interactive visualizaAnima-tions as well. They allow to recognize for example important changes over a certain period of time [8]. 4.7 Visions / Stories
Visions or Stories are non physical, imaginary mental visualization, which help to transfer knowledge across time and space. They also help to discuss potential influences of ideas and concepts on future scenarios as well as they enable to establish a shared vision and a co-herent story that motivates and activates the recipients [8].
5 CLASSIFYINGMETHODS FORKNOWLEDGEVISUALIZATION Nowadays a lot of different possibilities and methods for visualizing knowledge are existing. But this is both a blessing and a curse: The more methods are existing the more confusing and complex it gets for non-professional visualizers to choose the right tools for each vi-sualizing task. Therefore it is necessary to classify the methods and build models which proposes for each purpose a set of good visualiz-ing methods. Three approaches to do this are presented in this chapter. 5.1 A Framework for Knowledge Visualization
Burkhard introduces a Framework for Knowledge Visualization dur-ing the creation of his dissertation [8]. The main reasons for dodur-ing this were on the one hand the poor integration of visualization research into knowledge management and communication science research and on the other hand the missing mediating element between the mostly isolated fields of research presented in chapter 3 [8]. Burkhard and Ep-pler had also in mind not only to introduce the framework to structure the Visualizations but also to give practitioners some aid in choos-ing the right visualization. Burkhard [7] mentions for this reason the Knowledge Visualization cube and Eppler [20] shows some example relations between the different perspectives of visualization.
5.1.1 Four Different Perspectives
To transfer and create knowledge efficiently Burkhard proposes four perspective types(see figure 4)that should be considered in this con-text. The first perspective concerns the aim or the function that should be achieved. Thus this category is called the function type, that can
Fig. 4. The Knowledge Visualization Framework [8]
be coordination, attention, recall, motivation, elaboration or new in-sights. The second perspective concerns the content type of knowl-edge that should be transferred. The knowlknowl-edge can be declarative (Know-What facts are relevant), procedural (Know-How things are done), experimental Why things occur), orientational (Know-Where information can be found) and individual (Know-Who are the experts). Third there is the recipient perspective type that regards the target group and the context of the recipient, which can be individuals, groups, organisations or networks. The last perspective concerns the visualization types, which form the transporting medium. They are already discussed in detail in chapter 4.
5.1.2 Case Studies for the Knowledge Visualization Model Burkhard proofed the concept of his framework by accomplishing four case studies, which are shortly presented in the next four paragraphs. An overview about the different test settings is available infigure 5.
Fig. 5. Overview of the Case Studies [8]
Metaview: This case study is about a new approach for a visual document search in digital libraries. While users were able to get an overview about available books by leafing through real books in a traditional library, e-Book libraries normally allow only filtering and searching for keywords or other meta data. Burkhard developed a new search method that combined query driven filtering and a collection overview. Through evaluating he found that the complementary visu-alization was preferred by users compared to the traditional keyword search [8].
Tube Map: The tube map visualization is a Knowledge Map based on the visual metaphor of a tube plan, where the tube lines rep-resent a group of recipients and the stations project milestones.Figure 6shows an example of a tube map. The evaluation showed that the tube map was successful in communication a complex project to dif-ferent target groups, built up a mutual story, attracted and motivated employees, provided overview and detail in one image, initiated dis-cussions and fostered understanding. It confirmed that it is useful as a complementation to traditional project plans like Gantt diagrams in long term projects with different target groups [11], [8]. A later com-parative study of Burkhard et al. [6] shows further that tube maps are even more effective than Gantt diagrams.
Business Knowledge Visualization for Architects (BKV4A): This case study deals with the gap between decision makers and ar-chitects, which normally do not use business diagrams. Therefore business diagrams were integrated into the method toolbox of archi-tects. This problem is by the way very similar to the field of interest of
Fig. 6. An example of a Tube map [20]
Knowledge Communication (see chapter 3.7). The result of the case study is again that the use of complementary visualization can im-prove communication, knowledge transfer and fosters the engagement of decision makers in presentations. Moreover it reduces information overload, prevents misinterpretation, increases the information quality and last but not least improved the making of decisions [8].
Science City ETH: This case study used all visualizations types to find their limitations. The object of interest was the planning pro-cess of a ”Science City” at the ETH Z¨urich. It again found evidence that it is reasonable to use different visualization types complementary, especially in early stages of a project [8]. In that context Burkhard in-troduced the term ”Strategy Visualization”, which is defined as ”the systematic use of complementary visual representations to improve the analysis, development, formulation, communication, and imple-mentation of strategies in organizations” [4] (p. 1).
The conclusion of all case studies is that the framework and the Knowledge Visualization model assist to reflect on a specific visual-ization problem from different perspectives. This can help to find good strategies for visualizing knowledge in real world problems. The case studies also show an exemplary mapping between different problem settings and possible usages of visualizations.
5.2 A Pragmatic Taxonomy of Knowledge Maps
Eppler [19] tries to find a taxonomy of Knowledge Maps that should give an overview and help to select the appropriate type of a Knowl-edge Map to a specific purpose. He considers five types of clas-sifications as reasonable: These are the intended purpose or usage, the graphical form, the content, the application level and the cre-ation methods. He created on this basis the ”selection matrix” of fig-ure 7, which uses the dimension of purpose and format as rows and columns. Letters represent the content type, whereas capital letters imply a strong and small letters in brackets weak recommendations for this combination. The best format of a Knowledge Map for the creation of knowledge through concepts would be metaphoric, while cartographic and diagrammatic formats are a good selection and tables may be used in some cases. According to Eppler this mapping lacks of empiric validation, but can serve as the basic for further studies and discussions.
5.3 Periodic Table for Visualization
Ralph Lengler and Martin Eppler use the visual metaphor of the pe-riodic table of chemical elements to classify 100 different methods of visualization [25]. The original table of chemical elements was found by the Russian chemist Dmitri Mendeleev in order to show periodic trends in the properties of chemical elements. The vertical columns contain groups of elements with similar properties, while the rows correspond to the number of electron shells (period) and thus to the complexity of a chemical element. This idea was transferred into
Fig. 7. A selection matrix for Knowledge Maps [19]
the context of visualization methods. Groups, recognizable through the same background color, contain visualizations of the same appli-cation area, which are categorized into data-, information-, concept-, metaphor-, strategy- and compound visualization, while the complex-ity of the methods is represented by the number of the period. The higher the row number the more complex is the visualization method within its group. Each element contains further information about its task (detail, overview or both), the required cognitive process (conver-gent vs. diver(conver-gent thinking) and the represented information (structure vs. process Information) The ”periodic table of visualization meth-ods” - poster(see figure 8)gives a great overview over a big variety of different visualizations methods and helps to find the different visual-ization methods for the correspondent problems.
6 CONCLUSION ANDOUTLOOK
Although Knowledge Visualization is a very young discipline it seems to be a promising approach to support the creation and transfer of knowledge. The proposed concept of Knowledge Visualization as a mediating science between different disciplines might be able to cre-ate a synergetic effect that helps all participcre-ated fields of research to widen their perspective. Therefore the proposed framework would be a good basis, if other fields of research would accept it. Unfor-tunately it seems that it did not have the desired success yet as it is only cited in relatively few publications. Nevertheless the call for vi-sualization as scientific discipline on its own by Burkhard [9] should still be considered seriously. The aim of offering help for visualiza-tion non-experts to choose the best formats of visualizavisualiza-tion for each problem is very reasonable, but it is still in the fledging stages. The presented solutions in chapter 5 still need empirical validation and / or firm establishment. Visualization struggles some problems as well which are often ignored. Bresciani and Eppler [3] detect social, cogni-tive and emotional problems either form the point of the user or from the point of the designer, like the ignoring of economic aspects or the misunderstanding of information. To circumvent those pitfalls of vi-sualization it is necessary that they are categorized and analyzed like it is done in the paper ”The Risk of Visualization” [3]. Nevertheless the methods of Knowledge Visualization are used by researchers and in practice, like the examples in chapter 4.3.3 show. Burkhard points out two main trends for visualization at the end of his dissertation [8]: On the one hand new carrier of information will change the appearance of visualizations. Especially the topics of Ubiquitous Computing and Augmented Realities will enable the users for a much richer multi-sensory experience and will move visualizations away from screens or projectors. On the other hand visualization will evolve from simple static objects to iterative, collaborative processes, which are able to create visualizations and new knowledge dynamically. He also sees the Semantic Web - an extension to the world wide web that makes it understandable for machines - as possible field of application [10].
REFERENCES
[1] S. R. Alpert. Comprehensive mapping of knowledge and information resources: The case of webster. InKnowledge and Information Visual-ization, pages 220–237, Berlin/Heidelberg, Germany, 2005. Springer. [2] G. Bellinger, D. Castro, and A. Mills. Data, information, knowledge, and
wisdom. http://systems-thinking.org/dikw/dikw.htm, 2004. visited 7.12.2008.
[3] S. Bresciani and M. J. Eppler. The risks of visualization: A classification of disadvantages associated with graphic representations of information.
ICA Working Paper, 2008(1), 2008.
[4] R. A. Burkard. Strategy visualization: A new research focus in knowl-edge visualization and a case study. InProceedings of I-KNOW ’05, Graz, Austria, 2005.
[5] R. A. Burkard. Towards a framework and a model for knowledge vi-sualization: Synergies between information and knowledge visualiza-tion. In Knowledge and Information Visualization, pages 238–255, Berlin/Heidelberg, Germany, 2005. Springer.
[6] R. A. Burkard, M. Meier, P. Rodgers, M. T. J. Smis, and J. Stott. Knowl-edge visualization: A comparative study between project tube maps and gantt charts. InProceedings of I-KNOW 05, Graz, Austria, 2005. [7] R. A. Burkhard. Learning from architects: the difference between
knowl-edge visualization and information visualization. InIV ’04: Proceedings of the Information Visualisation, Eighth International Conference, pages 519–524, Washington, DC, USA, 2004. IEEE Computer Society. [8] R. A. Burkhard. Knowledge visualization: The use of complementary
visual representations for the transfer of knowledge. A model, a frame-work, and four new approaches. PhD thesis, Eidgen¨ossische Technische Hochschule ETH Zurich, 2005.
[9] R. A. Burkhard. Is it now time to establish visualization science as a scientific discipline? InIV ’06: Proceedings of the conference on In-formation Visualization, pages 189–194, Washington, DC, USA, 2006. IEEE Computer Society.
[10] R. A. Burkhard. Knowledge visualization - die naechste herausforderung fuer semantic web forschende? InSemantic Web - Wege zur vernetzten
Wissensgesellschaft, pages 201–212, Berlin/Heidelberg, Germany, 2006. Springer.
[11] R. A. Burkhard and M. Meier. Tube map visualization: Evaluation of a novel knowledge visualization application for the transfer of knowl-edge in long-term projects. Journal of Universal Computer Science, 11(4):473–494, 2005.
[12] BusinessDictionary.com. knowledge map. www. businessdictionary.com/definition/knowledge-map. html, 2008. visited 7.12.2008.
[13] A. J. Canas, R. Carff, G. Hill, M. Carvalho, M. Arguedas, T. C. Eskridge, J. Lott, and R. Carvajal. Concept maps: Integrating knowledge and infor-mation visualization. InKnowledge and Information Visualization, pages 205–219, Berlin/Heidelberg, Germany, 2005. Springer.
[14] S. K. Card, J. D. Mackinlay, and B. Shneiderman. Readings in informa-tion visualizainforma-tion: using vision to think. Morgan Kaufmann Publishers Inc., San Francisco, CA, USA, 1999.
[15] J. W. Coffey. Leo: A concept map based course visualization tool for instructors and students. InKnowledge and Information Visualization, pages 285–301, Berlin/Heidelberg, Germany, 2005. Springer.
[16] D. F. Dansereau. Node-link mapping principles for visualizing knowl-edge and information. In Knowledge and Information Visualization, pages 61–81, Berlin/Heidelberg, Germany, 2005. Springer.
[17] M. J. Eppler. Making knowledge visible through intranet knowledge maps: Concepts, elements, cases. InHICSS ’01: Proceedings of the 34th Annual Hawaii International Conference on System Sciences -Volume 4, page 4030, Washington, DC, USA, 2001. IEEE Computer Society. [18] M. J. Eppler. Knowledge communication problems between
ex-perts and managers - an analysis of knowledge transfer in decision processes.www.bul.unisi.ch/cerca/bul/pubblicazioni/ com/pdf/wpca0401.pdf, 2004.
[19] M. J. Eppler. Toward a pragmatic taxonomy of knowledge maps: Clas-sification principles, sample typologies, and application examples. Infor-mation Visualisation, International Conference on, pages 195–204, 2006. [20] M. J. Eppler and R. A. Burkard. Knowledge visualization - towards a new discipline and its fields of application.www.bul.unisi.ch/cerca/ bul/pubblicazioni/com/pdf/wpca0402.pdf, 2004. [21] T. Keller and S.-O. Tergan. Visualizing knowledge and information: An
introduction. InKnowledge and Information Visualization, pages 1–23, Berlin/Heidelberg, Germany, 2005. Springer.
[22] K. Kornwachs. Entsorgung von wissen. Wissen f¨ur die Zukunft II: Ver¨offentlichte Arbeiten (Textteil), pages 17–33, 1999.
[23] S. B. Lang. Merging knowledge from different disciplines in search of potential design axioms. InInformation Visualisation, International Con-ference on, pages 183–188, Los Alamitos, CA, USA, 2006. IEEE Com-puter Society.
[24] R. Lengler. Identifying the competencies of ’visual literacy’ - a prerequi-site for knowledge visualization.Information Visualisation, International Conference on, 0:232–236, 2006.
[25] R. Lengler and M. J. Eppler. Towards a periodic table of visualization methods for management. InGVE 2007: Graphics and Visualization in Engineering. Acta Press, 2007.
[26] J. Novak and M. Wurst. Collaborative knowledge visualization for cross-community learning. InKnowledge and Information Visualization, pages 95–116, Berlin/Heidelberg, Germany, 2005. Springer.
[27] J. Novak, M. Wurst, M. Schneider, M. Fleischmann, and W. Strauss. Dis-covering, visualizing and sharing knowledge through personalized learn-ing knowledge maps. InAgent-Mediated Knowledge Management, pages 213–228, Berlin/Heidelberg, Germany, 2003. Springer.
[28] J. D. Novak and D. B. Gowin. Learning How to Learn. Cambridge University Press, 32 East 57th St., New York, NY 10022, 1985. [29] H. Skowronek. Lernen und lerntheorien. InPaedagogik, pages 212–222,
Munich, Germany, 2001. Oldenburg Schulbuchverlag GmbH.
[30] S.-O. Tergan. Digital concept maps for managing knowledge and infor-mation. InKnowledge and Information Visualization, pages 185–204, Berlin/Heidelberg, Germany, 2005. Springer.
[31] S.-O. Tergan, T. Keller, and R. A. Burkard. Integrating knowledge and information: digital concept maps as a bridging technology.Information Visualization, 5(3):167–174, 2006.
[32] Z. Yongjin, H. Xinyan, X. Jiancang, and W. Zhiguo. Study on the knowl-edge visualization and creation supported kmap platform. International Workshop on Knowledge Discovery and Data Mining, 0:154–159, 2008.
![Figure 2 shows an example of an Knowledge asset map, which is the stock of knowledge of a consultant company [17].](https://thumb-us.123doks.com/thumbv2/123dok_us/1738037.2744536/5.918.477.852.314.460/figure-shows-example-knowledge-asset-knowledge-consultant-company.webp)
![Fig. 4. The Knowledge Visualization Framework [8]](https://thumb-us.123doks.com/thumbv2/123dok_us/1738037.2744536/6.918.466.838.75.204/fig-the-knowledge-visualization-framework.webp)
![Fig. 8. A periodic table for visualization Methods [25]](https://thumb-us.123doks.com/thumbv2/123dok_us/1738037.2744536/7.918.486.850.783.1058/fig-a-periodic-table-for-visualization-methods.webp)
