IMPORTANT DISCLOSURES REGARDING COMPANIES THAT ARE THE SUBJECT OF THIS REPORT AND AN EXPLANATION OF RECOMMENDATIONS CAN BE FOUND AT THE END OF THIS DOCUMENT.
All eyes on the debt re-fi
2Q production was in line with our expectations. The planned debt re-financing, assisted by the rapid de-risking of Maules Creek, is key to alleviate market concerns around the balance sheet in 2015. WHC remains a higher risk counter-cyclical Buy.
Our valuation revises to A$1.84ps (from A$2.00ps) which we equate to our target. Our base case assumes WHC will source alternative debt arrangements to alleviate balance sheet risks in FY15.
Strong 1Q production
2Q Production and sales were in line with our expectations, with WHC drawing down coal inventories to smooth out the sales profile during the November longwall changover. Our FY15 sales forecasts are conservative in our view given that Maules is now ramping up ahead of schedule. Thanks to the declining AUD and lower costs, we calculate that WHC is holding its cash margins around steady in the high single digit A$ per tonne range. We forecast WHC to generate around A$40m in EBITDA at the upcoming 1H15 result which should neither overly thrill nor concern investors in itself.
Catalysts to watch
We look toward completion of the planned debt refinancing as a key trigger to ease investor concerns around the balance sheet in 2015. Available terms for a possible refinancing into the US debt market
appear to be prohibitive given the upheaval in credit markets servicing the US hydrocarbon industries. However we believe that domestic banking syndicates are not out of the picture and infer that a timely ramp-up (and de-risking) of Maules Creek will greatly assist WHC in securing debt refinance from mid 2015.
Investment view
WHC is still 2 years away from generating meaningful profitability from its A$1.4bn market cap, but is successfully insulating itself from the worst of the coal price cycle. To Buy WHC here, investors must agree with our baseline assumptions that; 1) production and costs performance can be sustained (recently strong) ; 2) Maules Creek ramps-up on schedule (on track); and 3) coal pricing enjoys a modest recovery within the next 2-3 years (perhaps too tenuous for comfort). Our detailed sensitivities from Page 2 show that WHC is a Buy for higher risk, counter-cyclical investors.
Whitehaven Coal
COMPANY NOTEWHC AU / WHC.AX
Current A$1.21
Market Cap Avg Daily Turnover Free Float Target A$1.84
US$1,008m
US$3.64m 15.0%
Prev. Target A$2.00A$1,241m A$4.29m 1,026 m shares Up/Downside 52.1%
Conviction| | Tom SARTOR T (61) 7 3334 4503 E tom.sartor@morgans.com.au WHC150115 57.0 65.3 73.7 82.0 90.3 98.7 107.0 1.00 1.20 1.40 1.60 1.80 2.00 2.20
Price Close Relative to S&P/ASX 200 (RHS)
Source: Bloomberg
5 10 15 20
Jan-14 Apr-14 Jul-14 Oct-14
Vo
l m
Financial Summary
Jun-12A Jun-13A Jun-14A Jun-15F Jun-16F
Revenue (A$m) 618 622 755 802 1,266
Operating EBITDA (A$m) 149.2 (11.1) 75.3 88.6 274.7
Net Profit (A$m) 62.54 (82.16) (38.39) (61.47) 26.82
Normalised EPS (A$) 0.14 (0.08) (0.04) (0.06) 0.03
Normalised EPS Growth (5%) (157%) (54%) 60% NA
FD Normalised P/E (x) 8.64 NA NA NA 47.04 DPS (A$) 0.53 0.00 0.00 0.00 0.00 Dividend Yield 43.8% 0.0% 0.0% 0.0% 0.0% EV/EBITDA (x) 8.16 NA 26.02 25.38 7.82 P/FCFE (x) 2.16 NA 73.31 NA 12.49 Net Gearing (1.9%) 14.3% 21.4% 31.0% 27.5% P/BV (x) 0.37 0.38 0.40 0.40 0.40 ROE 6.52% (2.47%) (1.19%) (1.94%) 0.85%
% Change In Normalised EPS Estimates (26.5%) (3.1%)
Normalised EPS/consensus EPS (x) 1.18 0.78
1.21
1.83
1.11 2.00
Target
52-week share price range
Current
SOURCE: MORGANS, COMPANY REPORTS
Balance sheet and Valuation sensitivities
We stress test WHC’s earnings, balance sheet and NPV under 3 coal price scenarios. Our base case forecasts apply steady improvements to FY15-17 coal prices but still sees WHC failing its Dec-15 covenant (ICR > 3.5 times). In this scenario, WHC’s net debt and gearing peaks at around A$1bn and
30% respectively (D/E) in FY15. The Interest Cover Ratio improves strongly from 1.4 times in late 2015 to ~5 times in FY17 which supports the idea that providers of longer dated debt are seeing solid incentives to lend to WHC. However, we show that earnings and balance sheet leverage to both stronger
and weaker coal markets is high. Each US$1/t movement in thermal coal prices in FY15-16 varies NPAT by A$7-10m.
In our a Bear case coal price scenario, we show that WHC would only cover its Interest liabilities by 1.6 times in FY16. This is cutting it fine for the comfort of equity investors and places higher pressure on production and cost delivery.
Similarly, we show that the variance in NPV from Bearish to Bullish price scenarios ranges from A$1.25-2.84 per share, explaining how WHC is managing to polarise short versus long term investors.
Chart 1: US$ Thermal coal price scenarios Chart 2: US$ LV PCI coal price scenarios
65 63 66 74 80 85 85 55 65 75 85 95 105 2014 2015 2016 2017 2018 2019 2020
Base - 3 yr Recovery Bull Bear
92 90 100 115 128 135 140 70 80 90 100 110 120 130 140 150 160 2014 2015 2016 2017 2018 2019 2020
Base - 3 yr Recovery Bull Bear
SOURCE: Morgans forecasts SOURCE: Morgans forecasts
Chart 3: NPAT scenarios Chart 4: Total Net cashflow scenarios
-38.4 -59.9 27.0 100.9 -150 -100 -50 0 50 100 150 200 250 2014 2015 2016 2017
Base Bull Bear
-7.3 -41.0 76.2 167.6 257.8 -100 -50 0 50 100 150 200 250 300 350 400 2014 2015 2016 2017 2018
Base Bull Bear
SOURCE: Morgans forecasts SOURCE: Morgans forecasts
We show that WHC’s earnings, balance sheet and NPV leverage is uncomfortably high.
Projected net debt and WHC’s ability to service it is the crux of the issue for potential WHC investors in our view.
Chart 5: Projected EBITDA / Net interest debt coverage vs coal price scenarios 1.4 1.2 2.8 4.0 5.9 0 1 2 3 4 5 6 7 8 9 10 2014 2015 2016 2017 2018
Base Bull Bear
December 15 covenant test date
3.5x ICR Covenant
SOURCE: Morgans forecasts
Chart 6: Base case cashflow assumptions versus net debt
472 685 966 865 672 390 -600 -400 -200 0 200 400 600 800 1000 1200 2013 2014 2015 2016 2017 2018
NOPCF Dividends Capex Net debt
SOURCE: Morgans forecasts
Chart 7: NPV sensitivities to coal price assumptions
1.25 1.84 2.84 0.00 0.50 1.00 1.50 2.00 2.50 3.00
Bear Base Bull
SOURCE: Morgans forecasts
We think the market
underestimates WHC’s alternative funding options should the bear case pricing scenario play out. In this scenario, we are
comfortable that WHC has a number of options before it need consider new dilutive equity. These include; 1) pursuit of replacement US debt on more lenient terms, and 2) sourcing additional JV funds from a sell-down at Vickery.
The latter may even be a preferred scenario over our base case given that strategic investors have a long track record of valuing long life coal assets well above our own estimates and the market.
Changes to earnings and NPV
We have again lowered our coal price assumptions following market
movements, offset but a downward adjustment to our near term AUD forecasts. Our valuation revises to A$1.84ps (from A$2.00ps) which we now equate to our target price. We believe that WHC will source alternative debt arrangements, and/or JV funding to alleviate balance sheet risks in FY15.
Table 1: Changes to earnings and NPV
. 2014A 2015F 2016F 2017F NPV
Earnings revisions
NPAT normalised – previous -48.6 27.7 151.0 2.00 NPAT normalised – revised -38.4 -59.9 27.0 100.9 1.84
Change -11.3 -0.6 -50.1 -0.16
Change (%) 23.2% -2.3% -33.2% -8.0%
Market assumptions 2014A 2015F 2016F 2017F 2018F
AUD Exchange Rate 0.93 0.86 0.82 0.84 0.85 Thermal Coal (US$/t) 65.00 63.00 66.00 74.00 80.00 LV PCI (US$/t) 91.50 90.00 100.00 115.00 127.50
SOURCE: Morgans forecasts
Valuation and risks
We set our target price in-line with our DCF based valuation. Fundamental risks to our target price relate to the ramp-up of Narrabri, the efficient construction of Maules Creek, the performance of port and rail infrastructure, fluctuations in coal pricing and currency and the ability to control capital and operating costs.
Company overview
Whitehaven is an established coal producer and early mover the in the emerging Gunnedah basin in NSW. The company currently produces thermal, PCI and semi-soft coals from a portfolio of open cut mines with a capacity of around 9Mtpa on a 100% managed basis. The company is ramping up a high-capacity longwall at Narrabri and will move aim to construct its flagship Maules Creek asset over FY13-14, taking productive capacity toward 20Mtpa.
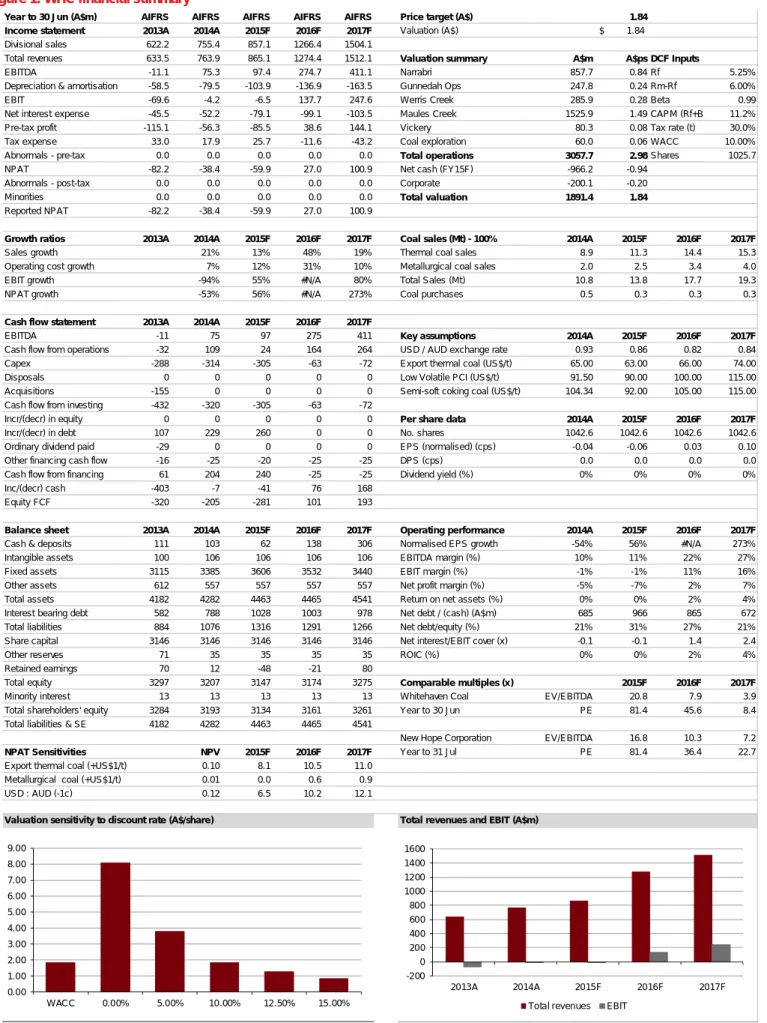
Figure 1: WHC financial summary
Year to 30 Jun (A$m) AIFRS AIFRS AIFRS AIFRS AIFRS Price target (A$) 1.84 Income statement 2013A 2014A 2015F 2016F 2017F Valuation (A$) $ 1.84 Divisional sales 622.2 755.4 857.1 1266.4 1504.1
Total revenues 633.5 763.9 865.1 1274.4 1512.1 Valuation summary A$m A$ps DCF Inputs
EBITDA -11.1 75.3 97.4 274.7 411.1 Narrabri 857.7 0.84 Rf 5.25%
Depreciation & amortisation -58.5 -79.5 -103.9 -136.9 -163.5 Gunnedah Ops 247.8 0.24 Rm-Rf 6.00%
EBIT -69.6 -4.2 -6.5 137.7 247.6 Werris Creek 285.9 0.28 Beta 0.99
Net interest expense -45.5 -52.2 -79.1 -99.1 -103.5 Maules Creek 1525.9 1.49 CAPM (Rf+B 11.2% Pre-tax profit -115.1 -56.3 -85.5 38.6 144.1 Vickery 80.3 0.08 Tax rate (t) 30.0%
Tax expense 33.0 17.9 25.7 -11.6 -43.2 Coal exploration 60.0 0.06 WACC 10.00%
Abnormals - pre-tax 0.0 0.0 0.0 0.0 0.0 Total operations 3057.7 2.98Shares 1025.7
NPAT -82.2 -38.4 -59.9 27.0 100.9 Net cash (FY15F) -966.2 -0.94
Abnormals - post-tax 0.0 0.0 0.0 0.0 0.0 Corporate -200.1 -0.20
Minorities 0.0 0.0 0.0 0.0 0.0 Total valuation 1891.4 1.84
Reported NPAT -82.2 -38.4 -59.9 27.0 100.9
Growth ratios 2013A 2014A 2015F 2016F 2017F Coal sales (Mt) - 100% 2014A 2015F 2016F 2017F
Sales growth 21% 13% 48% 19% Thermal coal sales 8.9 11.3 14.4 15.3
Operating cost growth 7% 12% 31% 10% Metallurgical coal sales 2.0 2.5 3.4 4.0
EBIT growth -94% 55% #N/A 80% Total Sales (Mt) 10.8 13.8 17.7 19.3
NPAT growth -53% 56% #N/A 273% Coal purchases 0.5 0.3 0.3 0.3
Cash flow statement 2013A 2014A 2015F 2016F 2017F
EBITDA -11 75 97 275 411 Key assumptions 2014A 2015F 2016F 2017F
Cash flow from operations -32 109 24 164 264 USD / AUD exchange rate 0.93 0.86 0.82 0.84 Capex -288 -314 -305 -63 -72 Export thermal coal (US$/t) 65.00 63.00 66.00 74.00
Disposals 0 0 0 0 0 Low Volatile PCI (US$/t) 91.50 90.00 100.00 115.00
Acquisitions -155 0 0 0 0 Semi-soft coking coal (US$/t) 104.34 92.00 105.00 115.00 Cash flow from investing -432 -320 -305 -63 -72
Incr/(decr) in equity 0 0 0 0 0 Per share data 2014A 2015F 2016F 2017F
Incr/(decr) in debt 107 229 260 0 0 No. shares 1042.6 1042.6 1042.6 1042.6
Ordinary dividend paid -29 0 0 0 0 EPS (normalised) (cps) -0.04 -0.06 0.03 0.10
Other financing cash flow -16 -25 -20 -25 -25 DPS (cps) 0.0 0.0 0.0 0.0
Cash flow from financing 61 204 240 -25 -25 Dividend yield (%) 0% 0% 0% 0%
Inc/(decr) cash -403 -7 -41 76 168
Equity FCF -320 -205 -281 101 193
Balance sheet 2013A 2014A 2015F 2016F 2017F Operating performance 2014A 2015F 2016F 2017F Cash & deposits 111 103 62 138 306 Normalised EPS growth -54% 56% #N/A 273%
Intangible assets 100 106 106 106 106 EBITDA margin (%) 10% 11% 22% 27%
Fixed assets 3115 3385 3606 3532 3440 EBIT margin (%) -1% -1% 11% 16%
Other assets 612 557 557 557 557 Net profit margin (%) -5% -7% 2% 7%
Total assets 4182 4282 4463 4465 4541 Return on net assets (%) 0% 0% 2% 4%
Interest bearing debt 582 788 1028 1003 978 Net debt / (cash) (A$m) 685 966 865 672
Total liabilities 884 1076 1316 1291 1266 Net debt/equity (%) 21% 31% 27% 21%
Share capital 3146 3146 3146 3146 3146 Net interest/EBIT cover (x) -0.1 -0.1 1.4 2.4
Other reserves 71 35 35 35 35 ROIC (%) 0% 0% 2% 4%
Retained earnings 70 12 -48 -21 80
Total equity 3297 3207 3147 3174 3275 Comparable multiples (x) 2015F 2016F 2017F
Minority interest 13 13 13 13 13 Whitehaven Coal EV/EBITDA 20.8 7.9 3.9
Total shareholders' equity 3284 3193 3134 3161 3261 Year to 30 Jun PE 81.4 45.6 8.4 Total liabilities & SE 4182 4282 4463 4465 4541
New Hope Corporation EV/EBITDA 16.8 10.3 7.2
NPAT Sensitivities NPV 2015F 2016F 2017F Year to 31 Jul PE 81.4 36.4 22.7
Export thermal coal (+US$1/t) 0.10 8.1 10.5 11.0 Metallurgical coal (+US$1/t) 0.01 0.0 0.6 0.9
USD : AUD (-1c) 0.12 6.5 10.2 12.1
Valuation sensitivity to discount rate (A$/share) Total revenues and EBIT (A$m)
0.00 1.00 2.00 3.00 4.00 5.00 6.00 7.00 8.00 9.00 WACC 0.00% 5.00% 10.00% 12.50% 15.00% -200 0 200 400 600 800 1000 1200 1400 1600 2013A 2014A 2015F 2016F 2017F
Total revenues EBIT
6
DISCLAIMER
The information contained in this report is provided to you by Morgans Financial Limited as general advice only, and is made without consideration of an individual’s relevant personal circumstances. Morgans Financial Limited ABN 49 010 669 726, its related bodies corporate, directors and officers, employees, authorised representatives and agents (“Morgans”) do not accept any liability for any loss or damage arising from or in connection with any action taken or not taken on the basis of information contained in this report, or for any errors or omissions contained within. It is recommended that any persons who wish to act upon this report consult with their Morgans investment adviser before doing so. Those acting upon such information without advice do so entirely at their own risk.
This report was prepared as private communication to clients of Morgans and is not intended for public circulation, publication or for use by any third party. The contents of this report may not be reproduced in whole or in part without the prior written consent of Morgans. While this report is based on information from sources which Morgans believes are reliable, its accuracy and completeness cannot be guaranteed. Any opinions expressed reflect Morgans judgement at this date and are subject to change. Morgans is under no obligation to provide revised assessments in the event of changed circumstances. This report does not constitute an offer or invitation to purchase any securities and should not be relied upon in connection with any contract or commitment whatsoever.
Although CIMB Securities (Australia) Ltd (ABN 84 002 768 701), its related bodies corporate, directors and officers, employees, authorised representatives and agents ("CIMB Securities Australia") may have been involved in the preparation of certain content for this Research Report, this Research Report constitutes general advice provided by Morgans to the recipient of this report under its Australian financial services licence and Morgans is solely responsible for the content of this report. CIMB Securities Australia do not accept any liability for any loss or damage arising from or in connection with any action taken or not taken on the basis of information contained in this report, or for any errors or omissions contained within.
DISCLOSURE OF INTEREST
Morgans and CIMB Securities Australia may from time to time hold an interest in any security referred to in this report and may, as principal or agent, sell such interests. Morgans or CIMB Securities Australia may previously have acted as manager or co-manager of a public offering of any such securities. Morgans' affiliates or CIMB Securities Australia affiliates may provide or have provided banking services or corporate finance to the companies referred to in the report. The knowledge of affiliates concerning such services may not be reflected in this report. Each of Morgans and CIMB Securities Australia advises that it may earn brokerage, commissions, fees or other benefits and advantages, direct or indirect, in connection with the making of a recommendation or a dealing by a client in these securities. Some or all of Morgans' Authorised Representatives may be remunerated wholly or partly by way of commission.
RECOMMENDATION STRUCTURE
For a full explanation of the recommendation structure, refer to our website at https://www.morgans.com.au/research_disclaimer.
If you no longer wish to receive Morgans’ publications please advise your local Morgans office or write to Morgans, Reply Paid 202, Brisbane QLD 4001 and include your account details.
17.11.14
QUEENSLAND ORANGE (02) 6361 9166
BRISBANE - HEAD OFFICE (07) 3334 4888 PORT MACQUARIE (02) 6583 1735
BRISBANE - EDWARD STREET (07) 3121 5677 SCONE (02) 6544 3144
BRISBANE - TYNAN PARTNERS (07) 3152 0600 SYDNEY – LEVEL 7 CURRENCY HOUSE (02) 8216 5111
BUNDABERG (07) 4153 1050 SYDNEY – LEVEL 9 (02) 8215 5000
CAIRNS (07) 4222 0555 SYDNEY – HUNTER STREET (02) 9125 1788
CALOUNDRA (07) 5491 5422 (02) 9615 4500
EMERALD (07) 4988 2777 SYDNEY – REYNOLDS EQUITIES (02) 9373 4452
GLADSTONE (07) 4972 8000 WOLLONGONG (02) 4227 3022 GOLD COAST (07) 5581 5777 IPSWICH/SPRINGFIELD (07) 3202 3995 ACT KEDRON (07) 3350 9000 CANBERRA (02) 6232 4999 MACKAY (07) 4957 3033 MILTON (07) 3114 8600 VICTORIA MT GRAVATT/CAPALABA (07) 3245 5466 MELBOURNE (03) 9947 4111 NOOSA (07) 5449 9511 BRIGHTON (03) 9519 3555 REDCLIFFE (07) 3897 3999 CAMBERWELL (03) 9813 2945 ROCKHAMPTON (07) 4922 5855 CARLTON (03) 9066 3200
SPRING HILL (07) 3833 9333 FARRER HOUSE (03) 8644 5488
SUNSHINE COAST (07) 5479 2757 GEELONG (03) 5222 5128
TOOWOOMBA (07) 4639 1277 RICHMOND (03) 9916 4000
TOWNSVILLE (07) 4725 5787 SOUTH YARRA (03) 8762 1400
YEPPOON (07) 4939 3021 TRARALGON (03) 5176 6055
WARRNAMBOOL (03) 5559 1500
NEW SOUTH WALES
SYDNEY (02) 8215 5055 WESTERN AUSTRALIA
ARMIDALE (02) 6770 3300 PERTH (08) 6462 1999
BALLINA (02) 6686 4144 WEST PERTH (08) 6160 8700
BALMAIN (02) 8755 3333
BOWRAL (02) 4851 5515 SOUTH AUSTRALIA
CHATSWOOD (02) 8116 1700 ADELAIDE (08) 8464 5000
COFFS HARBOUR (02) 6651 5700 NORWOOD (08) 8461 2800
GOSFORD (02) 4325 0884
HURSTVILLE (02) 9570 5755 NORTHERN TERRITORY
MERIMBULA (02) 6495 2869 DARWIN (08) 8981 9555
NEUTRAL BAY (02) 8969 7500
NEWCASTLE (02) 4926 4044 TASMANIA