716 Stokely Management Center Knoxville, Tennessee 37996 Phone: (865) 974-5441 Fax: (865) 974-3100 http://cber.bus.utk.edu
Center for Business and Economic Research
404 James Robertson Parkway Suite 1900 Nashville, TN 37243 Phone: (615) 741-3605 http://www.tn.gov/thec/
Projections: 2008–2018
LeAnn Luna
Associate Professor
Center for Business and Economic Research
Matthew N. Murray
Associate Director
Center for Business and Economic Research
Vickie C. Cunningham
Research Associate
Center for Business and Economic Research
Prepared by the
Center for Business and Economic Research
College of Business Administration
The University of Tennessee
Knoxville, Tennessee
April 2011
ACKNOWLEDGEMENTS
The authors gratefully acknowledge the contributions of the following individuals in the conceptualization,
design, and dissemination of this report.
Tennessee Department of Labor and Workforce Development
Martha Wettemann
Tennessee Higher Education Commission
Chris Brewer
Linda Doran
James Hawkins
Betty Dandridge Johnson
Mike Krause
Indrani Ojha
David Wright
Takeshi Yanagiura
Tennessee Business Roundtable
Gordon Fee
Ellen Thornton
Introduction . . . . 3
Methodology . . . . 5
Supply of Academic Awards . . . . 5
Table 1: Types of Awards . . . . 5
Table 2: Institutions Included in Analysis . . . . 6
Occupational Demand Projections . . . . 7
Table 3: Types of Education Experience Requirements . . . . 8
Analyzing Supply and Demand . . . . 8
Table 4: Career Clusters and Cluster Definitions . . . . 11
Table 5: Career Paths and Their Presence in Tennessee . . . . 12
Supply Projections . . . . 14
Regional Awards . . . . 14
Aggregate Awards . . . . 14
Table 6: Summary of 2008 Awards by Labor and Workforce Investment
Area . . . . 14
Figure 1: Summary of 2008 Awards by Labor Workforce Investment Area 15
Figure 2: Certificate Awards by Academic Year . . . . 16
Figure 3: Degree Awards by Academic Year . . . . 17
Figure 4: Post-BA, Post-MA, and First-Professional Awards by Academic
Year . . . . 17
Instructional Programs and Awards . . . . 18
Table 7: Instructional Program Forecast, Instructional Programs
Summary, Awards by Academic Year . . . . 19
Table 8: Top 10 Growing Instructional Programs . . . . 20
Table 9: Top 10 Slowest Growing
or
Declining Instructional Programs . . . . 21
Table 10: Top Science, Technology, Engineering and Mathematics
Instructional Programs by Number of Awards . . . . 23
Table 11: Number of Programs Forecasted to Produce Zero Graduates in
2018 . . . . 23
Supply and Demand Analysis . . . . 24
Table 12: Top 10 Under-Supplied Paths . . . . 24
APPENDIX 1: Number of Awards of Public and Private Institutions by Local
Workforce Investment Area, 2008
APPENDIX 2: Projected Awards by Individual Instructional Program, Including
Certificates from Institutions that offer Associates or More
Advanced Awards
APPENDIX 3: Share of 2008 Awards Granted by Public versus Private
Institutions
APPENDIX 4: Award Categories Projected to Produce No Graduates in 2018
APPENDIX 5: Share of 2008 Award Recipients Working in Tennessee Three
Quarters After Graduation
APPENDIX 6: Career Pathways—Supply and Demand Projections
APPENDIX 7: High-Need Field Crosswalk
cooperative effort between the Tennessee Higher
Education Commission and the University of
Tennessee’s Center for Business and Economic
Research. Using historical data from 2000-2008
as a guide, we project academic awards for
various instructional programs and disciplines for
Tennessee’s public, private for-profit and private
non-profit post-secondary institutions through
2018. We link the academic award projections on
the supply side of the labor market to anticipated
job openings by occupation on the demand side of
the labor market. The results provide insight into
how well the output of Tennessee’s educational
institutions matches the anticipated demands of
the state’s employers. This information can be used
by policymakers at all levels in Tennessee, from the
legislative and executive branches down to the level
of an academic award producing unit, as well as by
business and city planners, guidance counselors
and employers.
The instructional programs showing the largest
projected increase in number of awards are in
fields related to healthcare, business, education,
and liberal arts. Our projections reflect the
growing importance of the healthcare profession
in our education system and economy, as seven of
the top fifteen and fourteen of the top fifty fastest
growing programs are in the healthcare profession.
We also examine the top STEM (science,
technology, engineering, and mathematics)
programs and find that the number of graduates
in eight of the top ten fastest growing STEM fields
is expected to more than double by 2018; these
fields are growing from a small base while demand
is growing rapidly. Programs that are contracting
the fastest include general business, management
/computer information systems, administrative
assistant and secretarial science, and journalism.
Approximately 360 instructional programs at
various award levels are projected to produce zero
awards by 2018. In some cases, these programs
are ending, but in many cases, programs are being
reorganized.
Educational output is especially meaningful
to the extent it meets the needs of private and
many occupations do not require a highly specific
educational award, we aggregate the data into
functional groups–career pathways–and perform
one-to-one matching of groups of academic
programs with groups of occupations. The analysis
of supply and demand within the pathways
allows identification of gaps between projected
educational awards and projected job openings.
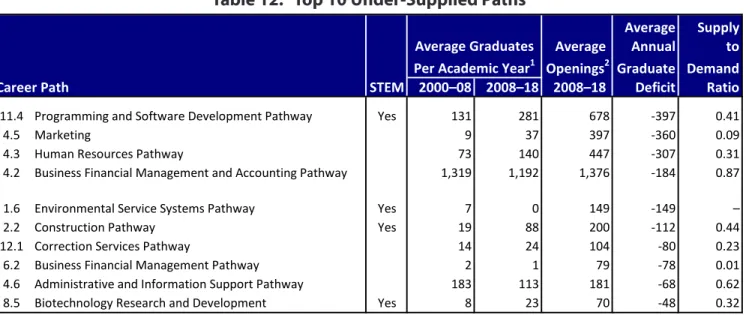
The largest under-supplied career pathways
include programming and software development,
marketing, human resources, business financial
management and accounting, environmental
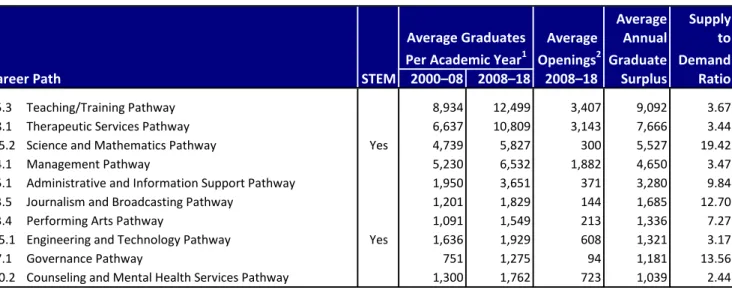
service systems, and construction. The largest
over-supplied career pathways include teaching,
therapeutic services, science and mathematics,
management, administrative and information
support, and journalism. The estimated surplus of
awards for teaching and therapeutic services is an
artifact of the breadth of the career pathways and
serves as a caution in interpreting and applying the
data to policy. As noted in the report, more refined
analyses of the markets for public elementary
and secondary teachers and licensed practical
nurses and registered nurses show significant
shortfalls between projected award production and
occupational demand.
Linking academic programs with specific
occupations is very difficult for several reasons.
First, the linkage between minimum educational
requirements and specific occupations will likely
be quite accurate for highly specialized awards,
especially at the Associate’s level and for many
advanced degrees. However, many Bachelors’
degree fields are more problematic because
individuals have the opportunity to work across
a range of occupations. Using aggregated career
pathways to match sets of academic programs to a
range of potential occupations is necessary but can
mask underlying surpluses or deficits for specific
award-occupation combinations.
Second, business and industry composition vary
markedly across the state, and the production of
post-secondary awards also varies across the state.
Thus, demand for an occupation may be high
relative to supply in one community while low
and PhDs, are more likely to migrate in pursuit of
employment opportunities elsewhere. Finally, our
projections are based on historical data from
2000-2008; therefore, it is difficult to accurately project
awards for newly-emerging fields and impossible
notice that demand data will play an increasingly
large role in academic program approval and
termination, development of performance funding
incentives for institutions, and student advising.
the receipt of a large federal Race to the Top grant
and passage of several important education-related
legislative initiatives. Especially notable was the
Complete College Tennessee Act of 2010 which
was signed into law by Governor Bredesen in
January. While the state’s public higher education
institutions have historically been funded based
largely on enrollment, the new outcomes-based
funding formula will place greater emphasis on
retention and graduation. The initiatives that
Tennessee is embarking on offer the potential to
fundamentally transform the state’s educational
pipeline to the betterment of state residents and the
state economy.
Outcomes-based funding will place greater
pressures on the institutional planning process.
Resources will need to be carefully allocated to
support growing instructional programs, especially
those that reflect the strategic interests of the state
and those that have strong employer demand.
These decisions will have to be made in an
extraordinarily difficult budget environment, and
at least in the near term, in the face of weak state
and national labor markets.
The research presented in this report is
a cooperative effort between the Tennessee
Higher Education Commission (THEC) and the
University of Tennessee’s Center for Business
and Economic Research (CBER) and is intended
to support the institutional planning process in
Tennessee. The report includes projections of
awards by instructional program extending out
to 2018. Identified are awards and instructional
programs that are expected to grow as well as
those expected to contract based on historical
trends between 2000 and 2008. These projections
can be utilized by education policymakers at
virtually all levels in Tennessee, from the legislative
and executive branches down to the level of an
academic award-producing unit.
Also presented in the report are projections of
occupational demand between 2008 and 2018, as
reflected by anticipated annual position openings
by occupation. These estimates, developed by the
Tennessee Department of Labor and Workforce
academic awards by career programs of study and
are discussed more fully below. The occupational
demand and academic award supply projections
together can support the analysis of potential
supply and demand imbalances anticipated in the
years ahead. However, the projection process is
complex, as is the changing environment within
which Tennessee’s institutions of higher education
operate. As such, the projections presented here
cannot be used in isolation but must take into
account other information and trends that are
occurring on both the supply and demand sides of
the market.
The following section of the report discusses
the methodology used to develop the supply and
demand projections and important caveats that
need to be considered when using the estimates.
Subsequent sections present key findings,
beginning with an overview of broad trends in
projected awards and closing with an analysis
of potential supply and demand imbalances.
Appendices of the report provide documentation
and a series of detailed tables that are intended to
support the academic planning process.
Appendix
1
shows 2008 award production for Local
Workforce Investment Area (LWIA) regions of the
state. Detailed projections of awards by individual
program of instruction appear in
Appendix 2
.
Appendix 3
presents the public and private shares
of award production for 2008. These data can
help shed light on the projections because all of
forecasts of award supply are aggregated across
public and private institutions of higher education.
A significant number of award categories for
specific instructional programs are projected
to produce no graduates in 2018, and these are
reported in
Appendix 4
.
Appendix 5
shows the
share of graduates from Tennessee institutions of
higher education that are working in the state three
quarters after the receipt of a degree. These data
can be used for a number of purposes, including
the analysis of possible in-state imbalances
between the supply of awards and the demand
for workers across occupational categories. Data
for
Appendix 5
were drawn from the series of
occupational demand are developed independently
and then linked together using career clusters and
career pathways. The discussion below outlines
the methodology used to develop the projections
and highlights important caveats that need to be
considered when using the data, especially in the
context of examining possible imbalances between
supply and demand.
Supply of Academic Awards
Postsecondary awards for individual
instructional programs are projected to 2018.
Table 1
shows the various award levels produced
by post-secondary institutions in Tennessee and
used in this analysis. Concentrations and minors
are not included because there is no way to directly
link these awards to the minimum educational
requirements of occupations on the demand side
of the labor market. As discussed below, it is
especially difficult to precisely match supply and
demand at the bachelor’s level. The reason is that
a bachelor’s degree in a field can support many
possible occupations, while a given occupation
may draw students from an array of different fields
of study.
The Classification of Instructional Programs
(CIP) for 2000 is used to categorize the fields of
instruction. The supply projections account for
all institutions in Tennessee that grant Associate’s
degrees or more advanced degrees, including
all public, private non-profit and private
for-student financial aid program. Aggregate
projections that encompass all post-secondary
institutions are reported in this study including the
appendix tables.
Table 2
provides a listing of the
postsecondary institutions included in the analysis.
Data supporting the projections come from the
federal Integrated Post-Secondary Education Data
System (IPEDS). In analyzing the IPEDS data, it
became apparent that the CIP definitions have not
always been applied consistently by postsecondary
institutions in Tennessee. One problem is that
some schools define programs as “general” while
other schools may designate a specific degree. A
second problem is that some schools reported their
data based on the 1990 CIP system for fields of
study not present under the 2000 CIP taxonomy.
CBER reassigned some data for years 2000–2003
using the national crosswalk between the 1990 and
2000 CIP system to address these issues.
The projections of award production by award
level and instructional program are based on
regression analysis and from historical data for
2000–2008. Historical trends in award production
as reported in IPEDS and the resident population
in the 20 to 29 age group provide the foundation
for the regression analysis. The 20 to 29 age group
was chosen because it represents the primary age
cohort for college students and corresponds to an
age classification used in the most recent statewide
population projections developed by CBER. The
projection of the historical trend, along with
CBER’s population projection for the 20 to 29 age
group, enables the long-term forecast of individual
awards by CIP to 2018.
The historical awards trend proved to have a
greater impact on the supply projections than
population demographics, which explained only
a small share of the variance. As a result, if the
number of awards showed historical growth
between 2000 and 2008, it is likely that the
projections produced a continuation of this growth
trend. (In practice there may be some exceptions
based on the up-and-down pattern of award
granting for individual years in the 2000-2008
time window.) On the other hand, if the number
Types of Awards
Awards of less than 1 academic year
Awards of at least 1 but less than 2 academic years Associate degrees
Awards at least 2 but less than 4 academic years Bachelor's degrees Postbaccalaureate certificates Masters degrees Post-Masters certificates Doctoral degrees First-professional degrees First-professional certificates
Chattanooga State Community College Tusculum College Cleveland State Community College Union University Columbia State Community College University of the South Dyersburg State Community College Vanderbilt University
Jackson State Community College Watkins Institute College of Art and Design Motlow State Community College
Nashville State Community College Private Institutions Northeast State Community College American Baptist College Pellissippi State Community College Argosy University-Nashville Roane State Community College Church of God Theological Seminary Southwest Tennessee Community College Concorde Career Institute Volunteer State Community College Crichton College / Victory University Walters State Community College DeVry University-Tennessee
Draughons Junior College / Daymar Institute-Clarksville Tennessee Board of Regents, 4-Year Universities Draughons Junior College / Daymar Institute-Murfreesboro
Austin Peay State University Draughons Junior College / Daymar Institute-Nashville East Tennessee State University Electronic Computer Programming College Inc. Middle Tennessee State University Emmanuel School of Religion
Tennessee State University Harding University Graduate School of Religion Tennessee Technological University High-Tech Institute-Memphis
University of Memphis High-Tech Institute-Nashville
Hiwassee College
The University of Tennessee System International Academy of Design and Technology The University of Tennessee ITT Technical Institute-Chattanooga
The University of Tennessee Health Science Center ITT Technical Institute-Cordova The University of Tennessee-Chattanooga ITT Technical Institute-Knoxville The University of Tennessee-Martin ITT Technical Institute-Nashville
John A. Gupton College Tennessee Independent Colleges & Universities Association MedVance Institute-Cookeville
Aquinas College MedVance Institute-Nashville
Baptist Memorial College of Health Sciences Memphis Theological Seminary
Belmont University Miller-Motte Technical College-Chattanooga
Bethel College Miller-Motte Technical College-Clarksville
Bryan College Miller-Motte Technical College-Goodlettsville
Carson-Newman College Nashville Auto Diesel College Inc.
Christian Brothers University National College of Business and Technology-Nashville
Cumberland University North Central Institute
Fisk University Nossi College of Art
Free Will Baptist Bible College O'More College of Design
Freed-Hardeman University Remington College
Johnson Bible College Richmont Graduate University
King College South College
Lambuth University Southeast College of Technology
Lane College Southeastern Paralegal Institute
Le Moyne-Owen College Temple Baptist Seminary
Lee University Tennessee Institute of Electronics / Fountainhead
Lincoln Memorial University Institute of Technology
Lipscomb University Tennessee Temple University
Martin Methodist College The Art Institute of Tennessee-Nashville
Maryville College University of Phoenix-Chattanooga Campus
Meharry Medical College University of Phoenix-Memphis Campus Memphis College of Art University of Phoenix-Nashville Campus Middle Tennessee School of Anesthesia Vatterott College-Memphis
Milligan College Virginia College-School of Business and Health
Rhodes College Visible School-Music and Worships Arts College
Southern Adventist University West Tennessee Business College Southern College of Optometry William Moore College of Technology Tennessee Wesleyan College Williamson Christian College Trevecca Nazarene University
year-by-year pattern of award production.) For
a number of awards/instructional programs, the
supply projections went to zero, indicating the
absence of award production.
As valuable as regression analysis is in providing
a foundation for forecasting, it cannot account
for any significant changes in the pattern of
award granting or demographics not captured
in the historical data. For example, it is difficult
to accurately project awards for newly-emerging
fields and impossible to project awards for fields
of study that have yet to be put in place. Similarly,
if students experience a significant shift in interest
for a program of study in the years ahead, this will
not be reflected in the supply forecast. Historical
patterns of award production may also reflect
the reallocation of resources that may have
caused award numbers to shrink or expand. For
example, a new program of study might have
been introduced in 2000 with enrollment capped
in 2008. In such a case, the supply projections
would assume a continuation of enrollment growth
because there is no way to deal with the enrollment
cap. Factors like this need to be taken into account
when using the projections contained in this
report.
Occupational Demand Projections
Projections of employer demand for
occupational categories delineated under the
standard occupational classification (SOC) system
begin with industry-level employment forecasts
extending to 2018. Industry data are categorized
using the North American Industrial Classification
(NAIC) system. Industry employment forecasts
were developed using the Annual Tennessee
Econometric Model (ATEM) maintained by
CBER. In support of this project, CBER created
employment projections at a more disaggregated
level of industry detail than is typically produced
as a part of the annual forecasting cycle reported
in the Economic Report to the Governor of the State
of Tennessee (http://cber.bus.utk.edu/tefslist.htm).
None of the more highly-aggregated estimates
previously reported by CBER were altered through
this re-estimation process.
of employment by industry using the CBER
projections as reference points. The DLWD
forecasts were then run
through a NAIC-to-SOC
crosswalk matrix that has
been developed specifically
for Tennessee (based on a
number of data sources,
including in-state employer
surveys). The
demand-side crosswalk maps the
projections of employment
by industry to specific
occupational categories and
their minimum educational
and training requirements.
To understand this
step it is important to
recognize that a business
in any given industry can
be expected to employ
workers across an array
of occupational categories. For example, a
manufacturing firm will typically employ relatively
large numbers of production workers with a
range of formal education and training, as well
as on-the-job training. The same firm will also
employ workers in other occupational categories,
such as engineers, computer and information
systems managers, human resource managers and
operation managers. The NAIC-to-SOC crosswalk
is the tool used to translate industry employment
projections to various occupational categories using
actual patterns of occupational employment and
educational attainment and training in Tennessee.
Industries are characterized by employment
growth through new business starts and firm
expansion as well as employment decline through
firm contraction and business closure. The
employment projections by industry are intended
to capture the net influence of these dynamics on
the number of jobs in the state economy. However,
employer demand and annual position openings
will also be affected by workplace dynamics
like worker promotions and various forms of
separation, such as quits, deaths, and retirements.
The historical
awards trend
proved to have
a greater impact
on the supply
projections than
population
demographics,
which explained
only a small share
for the college graduate. The modeling work of the
DLWD translates employment into occupational
demand and annual position openings and
accounts for this
type of workplace
dynamic.
Because of the
presence of worker
transitions, the
annual number
of replacements
needed within
an occupational
category in a given
year generally
will not match
the change in
employment.
The level of
employment in
an industry and
the number of
worker positions
in an occupational
category (for
example, the
number of
engineering
manager positions)
might be static and show little or no change from
year to year. However, worker separations will give
rise to the need to find replacements even if there
is no change in the overall level of employment and
the number of occupational positions as with the
example above. Even industries and occupations
showing a net downward trend in employment
and occupational positions may need to hire
replacement workers on an annual basis due to
separations. An example is engineering managers.
The number of occupational positions in this SOC
category is expected to fall from 3,156 to 3,023
between 2008 and 2018 in Tennessee. However,
average openings for this occupation are expected
to tally 64 per year.
forms of training and education along with other
specific skill sets. The minimum educational
and training requirements in the SOC system are
based on what is typically observed for a given
occupational category in the economy. There
certainly will be exceptions to these minimum
requirements within business establishments,
and they will likely change over time. For
example, the prevailing minimum requirement
for an occupation might be a Master’s degree, but
someone with a Bachelor’s degree might be eligible
for the position by virtue of accruing on-the-job
training and having access to a firm’s internal
job ladder. Further, individuals with higher
levels of training and educational attainment will
potentially qualify for the job. For example, an
occupation with a typically-observed minimum
requirement of a Bachelor’s degree would
conceivably be open to a person with a Master’s
degree or a PhD.
The linkage between minimum educational
requirements and specific occupations will likely
be quite accurate for highly specialized awards,
especially at the Associate’s level and for many
advanced degrees. On the other hand, many
Bachelors’ degree fields will be more problematic
because individuals will have the opportunity
to work across a range of occupations. The
methodology used here reflects the prevailing
pattern of occupations and educational
requirements for individuals in Tennessee, and
there will be exceptions to this prevailing pattern
in practice.
First professional degree Doctoral degree Master's degree
Bachelor's or higher degree, plus work experience Bachelor's degree
Associate degree
Postsecondary vocational training Work experience in a related occupation Long-term on -the-job training Moderate-term on -the-job training Short-term on -the-job training
Table 3: Types of Education Experience
Requirements
The linkage between
minimum educational
requirements and
specific occupations will
likely be quite accurate
for highly specialized
awards, especially at the
Associate’s level and for
many advanced degrees.
On the other hand, many
Bachelors’ degree fields
will be more problematic
because individuals will
have the opportunity to
work across a range of
of educational awards for workers in different
occupations. Employment is linked to occupations
through the NAICS-to-SOC crosswalk. A
practical problem with linkages between supply
and demand at a highly disaggregated level is
the absence of a one-to-one mapping between
instructional awards and occupations. For
example, a given instructional program may supply
multiple occupations
yielding a
“one-to-many” assignment. It
is also the case that
multiple instructional
awards may supply
multiple occupations
producing a
“many-to-many” assignment.
Focusing on
disaggregated data
that produce a
one-to-many or
many-to-many assignment
produces too much
ambiguity to be of
use for most planning
purposes.
Therefore, the
approach taken
in this report is to
make assignments
between groups of
instructional awards
and occupational
groupings that
produce a one-to-one
matching. A problem
with this approach is
the inability to match
specific awards with specific occupations—but
as noted immediately above, this is generally not
possible regardless of methodological approach.
The one-to-one matching between groups of
instructional programs and groups of occupations
is achieved by using the Perkins IV Crosswalk.
This linkage mechanism ties together career
clusters and career pathways on the supply side of
the market and the SOC system on the demand
side of the market. The 16 career clusters in the
Perkins model are shown in
Table 4
while
Table
5
shows the breakdown of the more specific
career pathways that are present in Tennessee. It
is important to emphasize the focus on career
pathways, which may take students through
a series of instructional programs and award
levels to prepare themselves for a career and
employment. As described in the documentation
for the Perkins IV Crosswalk:
“This…might be more convenient to use for
planning and administrative purposes, when both
instructional programs and occupations need to be
considered and where double-counting of students or
the jobs that they employ is concern. One potential
application is the prioritization of programs of
study and/or technical skill assessment development
according to which clusters or pathways have more
students, lead to more jobs or lead to jobs that are
high skill, high wage or high demand.”
The state-level orientation of the projections
needs to be taken into account when analyzing
potential supply and demand imbalances. The
demand analysis is built around statewide
be taken into account when
analyzing potential supply
and demand imbalances.
The demand analysis is built
around statewide employer
needs in Tennessee while the
supply analysis focuses on
the production of awards
and degrees from public
and private post-secondary
institutions in the state.
The
one-to-one matching
between groups
of instructional
programs and groups
of occupations
is achieved by
using the Perkins
IV Crosswalk. This
linkage mechanism
ties together career
clusters and career
pathways on the
supply side of the
market and the
SOC system on the
demand side of the
composition, and thus
occupational patterns, vary
markedly across the state,
while the production of
post-secondary awards also
varies across the state. This
means that the demand
for an occupation may be
high relative to supply in
one community while low
relative to supply in another
community.
Another implication of the
statewide focus is that it does
not account for employer
needs at the broader regional, national and
international levels. Graduates of post-secondary
institutions in Tennessee commonly migrate
outside the state in pursuit of jobs. Paralleling
this phenomenon on the supply side of the labor
requiring low or modest levels
of training and education
because individuals with
such traits tend to be less
mobile and typically can
be found in local labor
markets. Mobility is more
problematic for occupations
requiring higher levels of
educational attainment
because the demand for these
occupations may be national
or international in scope.
As a result, individuals with
higher levels of educational
attainment—especially Master’s degrees and
PhDs—are more likely to migrate in pursuit of
employment opportunities elsewhere.
Worker mobility is
more problematic for
occupations requiring
higher levels of education,
as highly educated
individuals are more likely
to migrate in pursuit of
employment opportunities.
fiber, wood products, natural resources, horticulture, and other plant and animal products/resources.
2 Architecture and Construction Cluster Careers in designing, planning, managing, building and maintaining the built environment.
3 Arts, Audio/Video Technology and Communications Cluster
Designing, producing, exhibiting, performing, writing, and publishing multimedia content including visual and performing arts and design, journalism, and entertainment services.
4 Business, Management and Administration Cluster
Business Management and Administration careers encompass planning, organizing, directing and evaluating business functions essential to efficient and productive business operations. Business Management and
Administration career opportunities are available in every sector of the economy.
5 Education and Training Cluster Planning, managing and providing education and training services, and related learning support services.
6 Finance Cluster Planning, services for financial and investment planning, banking, insurance, and business financial management.
7 Government and Public Administration Cluster Executing governmental functions to include Governance; National Security; Foreign Service; Planning; Revenue and Taxation; Regulation; and
Management and Administration at the local, state, and federal levels.
8 Health Science Cluster Planning, managing, and providing therapeutic services, diagnostic services, health informatics, support services, and biotechnology research and development.
9 Hospitality and Tourism Cluster Hospitality & Tourism encompasses the management, marketing and operations of restaurants and other foodservices, lodging, attractions, recreation events and travel related services.
10 Human Service Cluster Preparing individuals for employment in career pathways that relate to families and human needs.
11 Information Technology Cluster Building Linkages in IT Occupations Framework: For Entry Level, Technical, and Professional Careers Related to the Design, Development, Support and Management of Hardware, Software, Multimedia, and Systems Integration Services.
12 Law, Public Safety, Corrections and Security Cluster
Planning, managing, and providing legal, public safety, protective services and homeland security, including professional and technical support services.
13 Manufacturing Career Cluster Planning, managing, and performing the processing of materials into intermediate or final products and related professional and technical support activities such as production planning and control, maintenance and manufacturing/process engineering.
14 Marketing Sales and Service Cluster Planning, managing, and performing marketing activities to reach organizational objectives.
15 Science, Technology, Engineering and Mathematics Cluster
Planning, managing, and providing scientific research and professional and technical services (e.g., physical science, social science, engineering) including laboratory and testing services, and research and development services.
16 Transportation, Distribution, and Logistics Cluster
Planning, management, and movement of people, materials, and goods by road, pipeline, air, rail and water and related professional and technical support services such as transportation infrastructure planning and management, logistics services, mobile equipment and facility maintenance.
Code Career Path TN Supply? 1.1 Food Products and Processing Systems Pathway Y
1.2 Plant Systems Pathway Y
1.3 Animal Systems Pathway Y
1.4 Power Structural and Technical Systems Pathway
1.5 Natural Resources Systems Pathway Y
1.6 Environmental Service Systems Pathway Y
1.7 Agribusiness Systems Pathway
2.1 Design/Pre-Construction Pathway Y
2.2 Construction Pathway Y
2.3 Maintenance/Operations Pathway Y
3.1 Audio and Video Technology and Film Pathway Y
3.2 Printing Technology Pathway Y
3.3 Visual Arts Pathway Y
3.4 Performing Arts Pathway Y
3.5 Journalism and Broadcasting Pathway Y
3.6 Telecommunications Pathway Y
4.1 Management Pathway Y
4.2 Business Financial Management and Accounting Pathway Y
4.3 Human Resources Pathway Y
4.4 Business Analysis Pathway Y
4.5 Marketing Y
4.6 Administrative and Information Support Pathway Y 5.1 Administrative and Information Support Pathway Y
5.2 Professional Support Services Pathway Y
5.3 Teaching/Training Pathway Y
6.1 Financial and Investment Planning Pathway Y
6.2 Business Financial Management Pathway Y
6.3 Banking and Related Services Pathway Y
6.4 Insurance Services Pathway Y
7.1 Governance Pathway Y
7.2 National Security Pathway
7.3 Foreign Service Pathway Y
7.4 Planning Pathway Y
7.5 Revenue and Taxation Pathway 7.6 Regulation Pathway
7.7 Public Management and Administration Pathway Y
8.1 Therapeutic Services Pathway Y
8.2 Diagnostic Services Pathway Y
8.3 Health Informatics Pathway Y
8.4 Support Services Pathway Y
8.5 Biotechnology Research and Development Y
9.1 Restaurants and Food/Beverage Services Pathway Y
9.2 Lodging Pathway Y
9.3 Travel and Tourism Pathway Y
9.4 Recreation, Amusements and Attractions Pathway
10.1 Early Childhood Development and Services Pathway Y 10.2 Counseling and Mental Health Services Pathway Y
10.3 Family and Community Services Pathway Y
10.4 Personal Care Services Pathway Y
Code Career Path TN Supply?
11.2 Information Support and Services Pathway Y
11.3 Interactive Media Pathway Y
11.4 Programming and Software Development Pathway Y
12.1 Correction Services Pathway Y
12.2 Emergency and Fire Management Services Pathway Y
12.3 Security and Protective Services Pathway Y
12.4 Law Enforcement Services Pathway Y
12.5 Legal Services Pathway Y
13.1 Production Pathway Y
13.2 Manufacturing Production Process Development Pathway Y 13.3 Maintenance, Installation and Repair Pathway Y
13.4 Quality Assurance Pathway Y
13.5 Logistics and Inventory Control
13.6 Health, Safety and Environmental Assurance
14.1 Management and Entrepreneurship Pathway Y
14.2 Professional Sales and Marketing Pathway Y
14.3 Buying and Merchandising Pathway Y
14.4 Marketing Communications and Promotion Pathway 14.5 Marketing Information Management and Research Pathway 14.6 Distribution and Logistics Pathway
14.7 E-Marketing Pathway Y
15.1 Engineering and Technology Pathway Y
15.2 Science and Mathematics Pathway Y
16.1 Transportation Operations Pathway Y
16.2 Logistics Planning and Management Services Pathway 16.3 Warehousing and Distribution Center Operations Pathway
16.4 Facility and Mobile Equipment Maintenance Pathway Y 16.5 Transportation Systems/ Infrastructure Planning, Management, & Regulation Pathway
16.6 Health, Safety and Environmental Management Pathway 16.7 Sales and Service Pathway
Note: Career paths are subsets of clusters.
Source: Perkins Collaborative Resource Network for Program and Data Quality. Table 7: Primary Occupation and CIP in Pathways Cluster-Pathway-SOC-CIP Crosswalk file <http://cte.ed.gov/accountability/crosswalks.cfm>.
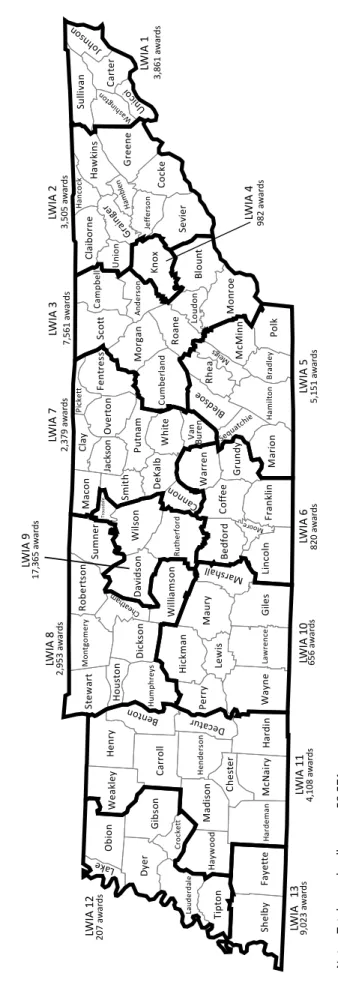
Tennessee is rich in educational institutions
with over 100 institutions spread across 13
different local workforce investment areas (LWIA).
Institutions range from the large campuses of the
UT system to much smaller community colleges
serving the specialized needs of local communities.
Many students (particularly students with graduate
degrees) will ultimately leave the area following
graduation. However, those students contribute
to the local economy while in school and add to
the area’s attractiveness for local employers who
can recruit those students who desire to stay in the
local area.
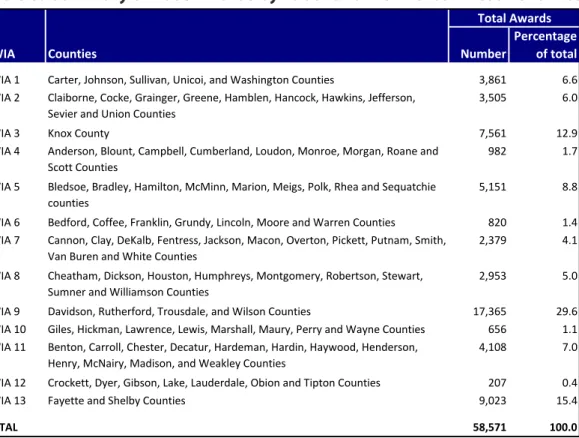
Table 6
presents the total 2008 degree
awards for each of the LWIAs (see also,
Figure 1
).
Detail by type of award can be found in
Appendix 1
.
The Nashville area (LWIA 9) leads the state in
awards, with area institutions granting more than
17,000 awards in 2008. Schools in the Memphis
area (LWIA 13) granted approximately 9,000
awards, followed by Knox County institutions
Schools in LWIA 5 (Chattanooga area) granted
5,100 awards, followed by LWIA 11 in West
Tennessee with about 4,100 awards granted.
As
Appendix 1
illustrates, the regions differ
dramatically on the mix of award types granted.
In Knox County, almost 75 percent of all awards
consisted of Bachelor’s or Master’s degrees. In
contrast, in LWIA 10, about 90 percent of 656
degrees were either Associate’s degrees (75 percent)
or Bachelor’s degrees (16 percent). In LWIA 13
(Memphis area), about 22 percent of the total
awards granted in that area consisted of awards of
less than one academic year, the highest percentage
of such awards in the state.
Aggregate Awards
The following discussion presents the results for
our supply projections. We begin our discussion
with an aggregate picture of the total number of
awards by type and by year. We present three
Table 6: Summary of 2008 Awards by Labor and Workforce Investment Area
Percentage
LWIA Counties Number of total
LWIA 1 Carter, Johnson, Sullivan, Unicoi, and Washington Counties 3,861 6.6 LWIA 2 Claiborne, Cocke, Grainger, Greene, Hamblen, Hancock, Hawkins, Jefferson,
Sevier and Union Counties
3,505 6.0
LWIA 3 Knox County 7,561 12.9
LWIA 4 Anderson, Blount, Campbell, Cumberland, Loudon, Monroe, Morgan, Roane and Scott Counties
982 1.7
LWIA 5 Bledsoe, Bradley, Hamilton, McMinn, Marion, Meigs, Polk, Rhea and Sequatchie counties
5,151 8.8
LWIA 6 Bedford, Coffee, Franklin, Grundy, Lincoln, Moore and Warren Counties 820 1.4 LWIA 7 Cannon, Clay, DeKalb, Fentress, Jackson, Macon, Overton, Pickett, Putnam, Smith,
Van Buren and White Counties
2,379 4.1
LWIA 8 Cheatham, Dickson, Houston, Humphreys, Montgomery, Robertson, Stewart, Sumner and Williamson Counties
2,953 5.0
LWIA 9 Davidson, Rutherford, Trousdale, and Wilson Counties 17,365 29.6 LWIA 10 Giles, Hickman, Lawrence, Lewis, Marshall, Maury, Perry and Wayne Counties 656 1.1 LWIA 11 Benton, Carroll, Chester, Decatur, Hardeman, Hardin, Haywood, Henderson,
Henry, McNairy, Madison, and Weakley Counties
4,108 7.0
LWIA 12 Crockett, Dyer, Gibson, Lake, Lauderdale, Obion and Tipton Counties 207 0.4
LWIA 13 Fayette and Shelby Counties 9,023 15.4
TOTAL 58,571 100.0
Jack son Me igs Hamblen Chea tham LWIA 2 3,505 a w ar ds LWIA 4 982 a w ar ds LWIA 5 5,151 a w ar ds LWIA 3 7,561 a w ar ds LWIA 7 2,379 a w ar ds LWIA 6 820 a w ar ds LWIA 12 207 a w ar ds LWIA 8 2, 953 a w ar ds LWIA 10 656 a w ar ds LWIA 11 4, 108 a w ar ds LWIA 13 9, 023 a w ar ds LWIA 9 17, 365 a w ar ds Not e: T ot al a w ar ds, all ar eas: 58,571.
Figur
e 1: Summar
y of 2008 Aw
ar
ds b
y Labor W
orkf
or
ce In
ves
tmen
t Ar
ea
Figur
e 1: Summar
y of 2008 A
w
ar
ds b
y L
ab
or
W
or
kf
or
ce I
nv
estmen
t A
rea
digit level, and also by award type.
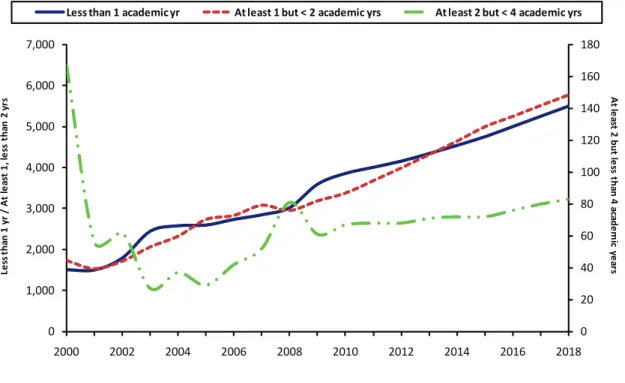
Figure 2
presents projections for awards by year
for the lowest levels of educational attainment
required. Specifically, we look at awards that
require less than one academic year, those that
require at least one but less than two years, and
finally awards that normally require at least two
but less than four academic years.
The overall trend for the number of graduates
with certificates awarded with less than one
academic year, and awards requiring at least one
but less than two academic years is very similar,
both increasing by approximately 4,000 graduates
between 2000 and 2018. Specifically, the number
of graduates receiving certificates requiring less
than one academic year is projected to be 5,500
in 2018 (left scale). Medical/Clinical assistant
is the largest category of award of less than one
academic year. The number of graduates receiving
certificates requiring at least one but less than
two academic years is projected to be 5,770 in
diesel mechanics technician. On the other hand
the number of graduates with at least two but less
than four academic years is projected to decline
from 2000, with less than 100 certificates awarded
in 2018 (right scale). However, note that the
number of awards is similar to the number in 2008.
This category contains very specialized degrees
(e.g. pre-ministerial studies, bible/biblical studies,
HVAC), with radiation therapists comprising over
half of total graduates in this category by 2018.
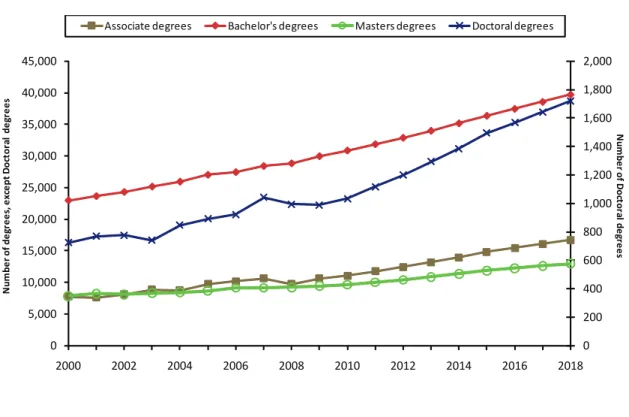
Figure 3
reflects our projections for the number
of Associate’s, Bachelor’s, Master’s, and Doctoral
degrees through 2018. In all four cases, we project
an increase in the number of awards. We project
the fastest growth for Associate’s and Doctoral
degrees over the next decade, increasing by 71 and
73 percent, respectively. Bachelor’s degrees is the
largest category of degree awards, and the number
of graduates is projected to reach 39,700 by 2018,
a 38 percent increase over the next decade. We
also project 40 percent growth in Master’s degrees,
Figure 2: Certificate Awards by Academic Year
0 20 40 60 80 100 120 140 160 180 0 1,000 2,000 3,000 4,000 5,000 6,000 7,000 2000 2002 2004 2006 2008 2010 2012 2014 2016 2018
Less than 1 academic yr At least 1 but < 2 academic yrs At least 2 but < 4 academic yrs
A t le as t 2 b ut le ss th an 4 a ca de m ic ye ar s Le ss th an 1 y r / A t le as t 1, le ss t ha n 2 yr s
0 200 400 600 800 1,000 1,200 1,400 1,600 1,800 2,000 0 5,000 10,000 15,000 20,000 25,000 30,000 35,000 40,000 45,000 2000 2002 2004 2006 2008 2010 2012 2014 2016 2018 N um be r o f d eg re es , e xc ep t D oc to ra l de gr ee s N um be r o f D oc to ra l d eg re es
Figure 4: Post-BA, Post-MA, and First-Professional Awards by Academic Year
1,200 1,250 1,300 1,350 1,400 1,450 1,500 1,550 0 500 1,000 1,500 2,000 2,500 3,000 3,500 2000 2002 2004 2006 2008 2010 2012 2014 2016 2018
Postbaccalaureate certificates
Post-Masters certificates
First-professional degrees N um be r o f P os t BA / P os t M A d eg re es Num be r o f F irs t-p ro fe ss io na l d eg re es
first-professional degrees. Post-baccalaureate
and Post-Master’s certificates are predominately
granted in various teaching and education
related categories. We project that the number
of graduates with post-baccalaureate and
Post-Master’s certificates will more than double in
the next decade. Specifically, we project that the
number of graduates with post-baccalaureate
certificates will increase from approximately
170 in 2008 to 400 by 2018. Further, we project
that the number of graduates with Post-Master’s
certificates will increase from
approximately 1,400 in 2008 to
3,000 by 2018.
First professional degrees
include (in descending order of
annual awards) law, medicine,
pharmacy, divinity, optometry,
dentistry, and veterinary
medicine. The historical data
for first-professional degrees
reflect a slow decline in degrees
from 2000 through 2007. Thus,
we do not project a significant
increase in the number in
first-professional degrees. Our projections reflect that
the number of students with first-professional
degrees will slowly increase from 2010 to 2018,
increasing from 1,321 degrees to 1,377 degrees in
2018.
Instructional Programs and Awards
The next series of tables reflects historical supply
data and projections for individual programs
using CIP codes. We begin with aggregated
CIPs, but detailed projections for each CIP are
located in
Appendix 2
. These data are for all
Tennessee institutions, both public and private.
Historical data on the share of awards granted by
public versus private institutions are provided in
Appendix 3
.
The conclusions in the following tables should
be of value for planning purposes and as a tool for
resource allocation. Educational institutions and
planners must consider projected increases in total
instructional programs. The goal is for the tables
to allow an examination of future trends at the
macro level of degree types as well as down to the
departmental level to examine specific majors and
the classes needed to fulfill major requirements.
Because our supply forecast is based on historical
trends, our projections assume that these broad
trends will continue. However, we cannot project
newly-emerging fields or fields that do not yet
exist; thus, some caution is warranted when using
these forecasts.
We first present the data
using a 2-digit CIP code in
Table 7
. These 38 programs
are listed in ascending CIP
order and include awards
at all levels of attainment.
We present the number of
graduates from 2000-2008,
followed by our forecast for
2018. We also present the
average number of graduates
for the period from 2000-2008
and 2008-2018 to allow for
smoothing of the endpoints.
The final column is the difference in these two
columns and reflects the change in number of
graduates.
Nearly every program is projected to grow
during the next decade when compared to the
previous eight years. The health profession and
related clinical sciences (CIP 51) is projected to
add the largest number of graduates, growing
from 11,124 graduates in 2008 to 21,559 by 2018.
This increase of approximately 10,400 graduates
is a 6.8 percent compounded annual growth rate.
By 2018, the number of graduates in the health
field will almost double the number of graduates
in business, the next largest CIP. Graduates
with a liberal arts degree (CIP 24) and graduates
with an education degree (CIP 13) are also
projected to grow quickly and to add a significant
number of graduates by 2018. Specifically, the
number of liberal arts graduates will increase by
approximately 2,600 students, a 4.9 percent annual
The health profession
and related clinical
sciences (CIP 51) is
projected to add the
largest number of
graduates, nearly
doubling by 2018.
O N TR A CT \M U RR A Y\M U RR 11 8c \T ab le s\C IP 2 s ummar y.x ls x In st ru ct io na l P ro gra m F ore ca st , 2 -D ig it C IP S umma ry Fo rec ast CI P Pr og ram 2000 2001 2002 2003 2004 2005 2006 2007 2008 2018 2000-08 2008-18 01 A gr icu ltu re, A gr icu ltu re Op er at ion s, & R ela te d S cie nce s 441 472 445 455 418 441 454 414 428 570 441 497 03 N at ura l Res ou rc es & C on serv at io n 217 171 172 172 157 179 153 142 139 108 167 124 04 A rch itect ur e & R ela ted S er vice s 92 108 64 96 80 64 77 109 77 105 85 83 05 A re a, E thni c, C ul tur al , & G ende r S tudi es 93 84 108 125 139 171 102 129 133 196 120 170 09 Com m un ica tion , J ou rn alis m , & R ela te d P rog ra m s 1, 001 1, 090 1, 219 1, 439 1, 360 1, 555 1, 442 1, 543 1, 487 2, 383 1, 348 1, 980 10 Com m un ica tion s T ech nolog ies /T ech nicia ns & S up por t S er vices 2 1 1 0 67 47 48 51 105 186 36 141 11 Com pu ter & In for m at ion S cien ce s & S up por t S er vices 752 816 1, 149 1, 344 1, 234 1, 261 1, 151 1, 123 1, 097 1, 933 1, 103 1, 599 12 Pe rs on al & C ulin ar y S er vices 79 76 93 101 110 95 107 198 266 354 125 294 13 Ed uca tion 4, 941 5, 242 5, 060 5, 552 5, 798 6, 255 6, 688 6, 707 6, 485 10, 635 5, 859 8, 518 14 En gin ee rin g 1, 426 1, 410 1, 427 1, 467 1, 575 1, 535 1, 411 1, 465 1, 497 1, 658 1, 468 1, 573 15 En gin ee rin g T ech nolog ie s/ Te ch nicia ns 1, 404 1, 226 1, 192 1, 175 1, 066 1, 114 1, 105 989 1, 006 1, 484 1, 142 1, 280 16 Fo re ig n L ang ua ge s, L ite ra tur es, & L ing ui st ic s 300 351 412 453 511 493 517 513 538 845 454 711 19 Fa m ily & C on su m er S cien ce s/ H um an S cie nce s 685 713 805 994 982 957 957 956 928 1, 357 886 1, 192 22 Leg al P rof es sion s & S tu dies 766 694 735 774 750 777 749 744 687 845 742 775 23 En gl is h L an gu ag e & L itera tu re/ Let ters . 1, 022 1, 048 1, 051 977 1, 042 1, 125 1, 132 1, 084 1, 052 1, 317 1, 059 1, 171 24 Lib er al A rt s & S cie nce s, G en er al S tu die s, & H um an ities 2, 882 2, 981 3, 108 3, 363 3, 407 4, 039 4, 145 4, 370 4, 319 6, 936 3, 624 5, 587 25 Lib ra ry S cien ce 42 78 95 78 79 95 88 88 99 135 82 120 26 Biolog ica l & B iom ed ica l S cien ce s 1, 214 1, 189 1, 181 1, 129 1, 157 1, 137 1, 188 1, 323 1, 378 1, 701 1, 211 1, 485 27 M at hem at ics & S ta tis tics 294 343 339 362 396 368 384 356 318 419 351 384 30 M ult i/ In ter dis cip lin ar y S tu die s 1, 422 1, 360 1, 328 1, 179 1, 236 1, 309 1, 491 1, 639 1, 710 2, 190 1, 408 1, 834 31 Pa rk s, R ec re at io n, L ei sur e & F itne ss S tudi es 816 811 922 823 858 919 962 1, 003 1, 021 1, 321 904 1, 150 32 Ba sic S kills 48 16 19 19 34 20 34 35 14 66 27 37 38 Ph ilos op hy & R elig iou s S tu dies 261 287 355 304 400 351 424 357 376 545 346 474 39 Th eolog y & R elig iou s V oca tion s 742 782 782 800 753 841 735 887 808 1, 138 792 943 40 Ph ys ica l S cie nce s 480 465 457 457 434 449 502 586 570 729 489 623 41 Scie nce T ech nolog ies /T ech nicia ns 218 260 178 187 157 250 213 155 152 169 197 154 42 Ps ych olog y 1, 698 1, 831 1, 894 1, 992 2, 064 2, 055 2, 064 2, 092 2, 090 2, 646 1, 976 2, 404 43 Se cu rit y & P rot ect iv e S er vice s 701 679 667 725 683 808 827 964 941 1, 443 777 1, 152 44 Pu blic A dm in is tr at ion & S ocia l S er vice P rof es sion s 741 658 677 694 745 744 778 713 864 952 735 896 45 Socia l S cie nces 1, 802 1, 827 2, 004 2, 146 2, 148 2, 083 2, 258 2, 143 2, 265 2, 660 2, 075 2, 531 46 Co nst ruc tio n T ra de s 42 56 46 51 58 78 46 87 102 149 63 119 47 M ech an ic & R ep air T ech nolog ies /T ech nicia ns 1, 416 1, 163 1, 161 1, 388 1, 536 1, 623 1, 805 1, 619 1, 506 2, 541 1, 469 2, 056 48 Pr ecis ion P rod uct ion 54 49 44 41 20 38 40 32 40 53 40 43 49 Tr an sp or ta tion & M at er ia ls M ov in g 54 54 73 88 113 104 150 158 127 315 102 222 50 Vis ua l & P er for m in g A rt s 1, 625 1, 704 1, 828 1, 833 2, 109 2, 077 2, 079 2, 202 2, 265 3, 255 1, 969 2, 774 51 H ea lth P rof es sion s & R ela te d C lin ica l S cie nces 6, 089 6, 005 6, 454 7, 349 8, 081 9, 071 10, 265 11, 300 11, 124 21, 559 8, 415 16, 095 52 Busi ne ss, M ana ge m ent , M ar ke ting , & R el at ed S uppo rt S er vi ce s 8, 394 8, 905 8, 961 9, 086 9, 160 9, 248 8, 990 9, 258 9, 114 11, 335 9, 013 10, 229 54 H is tor y (N ew ) 590 579 592 592 565 669 665 684 683 883 624 770 G ra dua te s H is to ric al d at a A ver age N um be r o f G ra dua te s
Table 7: I
nstr
uc
tional P
ro
gr
am F
or
ec
ast
, 2-D
igit CIP Summar
y, A
w
ar
ds b
y A
cademic
Year
20 Academic Program Supply and Occupational Demand Projections: 2008–2018 [UT Center for Business and Economic Research]
marketing or related business field (the second
largest CIP by graduates) are projected to increase
by approximately 2,200 students to 11,335, though
with a slower annual growth rate of 2.2 percent.
Several CIPs remain significant sources of
graduates but are not expected
to experience much growth
in the coming years. For
example, Engineering (CIP 14)
and Engineering Technologies
Technicians (CIP 15) together
had 2,500 graduates in 2008
but are expected to add only
500 graduates from
2008-2018. Likewise, psychology
will produce approximately
2,600 graduates in 2018, only
556 higher than the number of
graduates in 2008.
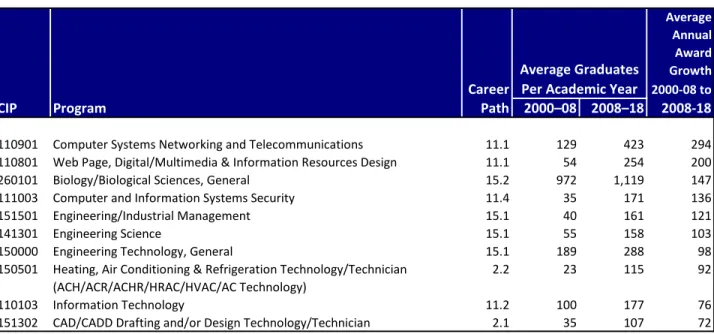
The next two tables—
Tables 8 and 9
—reflect
historical data and projections by program using
the 6 digit CIP code. We present results only for
the top ten largest growing and declining CIPs.
The full listing of programs by 6-digit CIP can be
found in
Appendix 2
.
The top ten categories confirm in large part
what was demonstrated in the previous table (see
Table 8
). The CIPs showing the largest expected
will show the largest growth in number of
graduates, and four of the top ten CIPs are in
the healthcare profession. This is an impressive
testament to the growing importance of the
healthcare profession in our education system and
economy, but the broader impact is
even more impressive. Seven out
of the top fifteen and fourteen
out of the top fifty fastest growing
CIPs are also in the healthcare
profession.
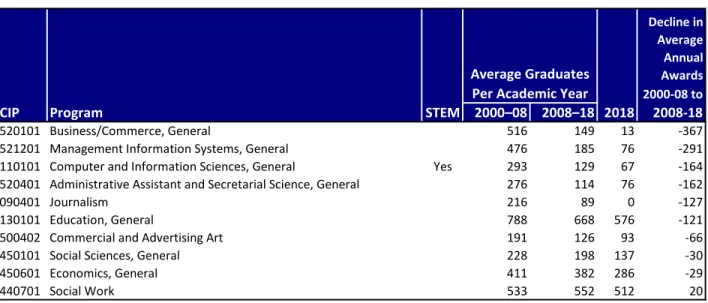
As we discussed in the
methodology section, the
colleges and universities assign
CIP codes to their graduates.
The CIPs showing the largest
expected decline in number of
graduates (
Table 9
) are in some
cases due to changes in classification. For example,
although the CIP with the largest estimated decline
is Business/Commerce, General (CIP 520101), a
similar CIP (520201) is fourth on the list of top
growing programs above (See
Table 8
). Similarly,
although Education, General (CIP 130101) is
showing a decline, education as a whole is expected
to grow substantially through 2018. Those
interested in the fields listed in
Table 9
are advised
to review the appendix to see if equivalent or near
Table 8: Top 10 Growing CIPs
DECLINING CIPS
mdb: S:\CONTRACT\CUNNINGHAM\MURRAY\2010\THEC\SUPPLY DEMAND.mdb
Top 10 Growing CIPs
Growth 2000-08 to
CIP Program STEM 2000–08 2008–18 2018 2008-18
511601 Nursing - Registered Nurse Training (RN, ASN, BSN, MSN) 2,251 4,532 5,983 2,280 240101 Liberal Arts and Sciences/Liberal Studies 3,317 5,179 6,317 1,862 510801 Medical/Clinical Assistant 948 2,483 3,420 1,535 520201 Business Administration and Management, General 4,092 5,718 6,392 1,625 130401 Educational Leadership and Administration, General 1,064 1,890 2,395 826 130499 Educational Administration and Supervision, Other 673 1,351 1,749 678 131202 Elementary Education and Teaching 555 995 1,300 440
510805 Pharmacy Technician/Assistant 196 593 840 397
131206 Teacher Education, Multiple Levels 242 617 819 375 510909 Surgical Technology/Technologist 174 515 718 340
Average Graduates Per Academic Year
Seven out of the top
fifteen and fourteen
out of the top fifty
fastest growing
programs are in the
healthcare profession.
21
Academic Program Supply and Occupational Demand Projections: 2008–2018 [UT Center for Business and Economic Research]
Table 9: Top 10 Slowest Growing
or
Declining CIPs
DECLINING CIPS
Top 10 Slowest Growing or Declining CIPs
2000-08 to
CIP Program STEM 2000–08 2008–18 2018 2008-18
520101 Business/Commerce, General 516 149 13 -367
521201 Management Information Systems, General 476 185 76 -291 110101 Computer and Information Sciences, General Yes 293 129 67 -164 520401 Administrative Assistant and Secretarial Science, General 276 114 76 -162
090401 Journalism 216 89 0 -127
130101 Education, General 788 668 576 -121
500402 Commercial and Advertising Art 191 126 93 -66
450101 Social Sciences, General 228 198 137 -30
450601 Economics, General 411 382 286 -29
440701 Social Work 533 552 512 20
Average Graduates Per Academic Year
Decline in Average Annual Awards