THE RP-2000 MORTALITY TABLES
Chapter Page
Executive Summary 1
1 Background and Collection of Data 4
2 Validation of Data and Final Data Set 8
3 Construction of Basic Table 20
4 RP-2000 Tables 30
5 Relative Mortality 43
6 Differences in Mortality Rates by Plan within Industry 58
7 Projections of Mortality Improvement after 2000 62
8 Comparison of RP-2000 to Other Tables 69
Table Description Page
2-1 Exposures Excluded from RP-2000 Base Tables 9
2-2 Distribution of Exposures by Industry 10
2-3 Male Employee Basic Data 11
2-4 Female Employee Basic Data 12
2-5 Male Retiree Basic Data 13
2-6 Female Retiree Basic Data 14
2-7 Male Beneficiary Basic Data 15
2-8 Female Beneficiary Basic Data 16
2-9 Male Disabled Annuitant Basic Data 17
2-10 Female Disabled Annuitant Basic Data 18
2-11 Summary of Basic Data 19
3-1 1992 Base Year Rates 27
4-1 Annualized Recent Mortality Improvement Trends – Male 31 4-2 Annualized Recent Mortality Improvement Trends – Female 32 4-3 Male Employee and Healthy Retiree Mortality Improvement Factors
Projection of Study Rates To 2000
33 4-4 Weighting Factors to Produce Combined Healthy Participant Table 34
4-5 Male RP-2000 Rates 35
4-6 Female RP-2000 Rates 38
5-1 Relative Amount – Weighted Mortality by Collar and Amount Male Healthy Annuitants, Ages 65 to 69
44
5-2 Relative Mortality by Size of Pension 45
5-3 Relative Mortality by Blue or White Collar 45
5-5 Ratio of Graduated Mortality Rates by Collar to Overall Mortality for Employees
49 5-6 Ratio of Graduated Mortality Rates by Collar and Amount to Overall
Mortality for Healthy Annuitants – Male Lives
50 5-7 Ratio of Graduated Mortality Rates by Collar and Amount to Overall
Mortality for Healthy Annuitants – Female Lives
51 6-1 Variation of Mortality by Plan Within Industry - 23 Plans in 4
Industries
59 6-2 Variation of Mortality by Plan Within Industry - 9 Plans with
Amount Information In One Industry
61 7-1 Annualized Long Term Mortality Improvement Trends – Male 63 7-2 Annualized Long Term Mortality Improvement Trends – Female 64
7-3 Mortality Projection Scale AA 66
8-1 Comparison of GAM-83, UP-94, UP-94 Projected to 2000, and RP-2000 Annuity Values - 5% Interest
70 8-2 Comparison of GAM-83, UP-94, UP-94 Projected to 2000, and
RP-2000 Annuity Values - 7% Interest
71 8-3 Comparison of GAM-83, UP-94, UP-94 Projected to 2000, and
RP-2000 Annuity Values - 9% Interest
72 8-4 Comparison of Current Liabilities Using PIMS Census Assuming 50%
Male 50% Female
74 8-5 Comparison of Current Liabilities Using PIMS Census Assuming 75%
Male 25% Female
75 8-6 Comparison of Current Liabilities Using PIMS Census Assuming 75%
Female 25% Male
75
B-1 Volume Summary 84
B-2 Raw Employee Death Rates 85
B-3 Raw Healthy Retiree Death Rates 85
B-4 Raw Beneficiary Death Rates 86
B-5 Raw Disabled Retiree Death Rates 86
C-1 Ratios of Multiemployer Mortality to RP-2000 Base – Healthy Annuitants
87
F-1 Mortality Comparison for Males Age 60-64 92
F-2 Mortality Comparison for Males Age 65-69 92
F-3 Mortality Comparison for Males Age 70-74 93
F-4 Mortality Comparison for Males Age 75-79 93
F-5 Mortality Comparison for Females Age 60-64 94
F-6 Mortality Comparison for Females Age 65-69 94
F-7 Mortality Comparison for Females Age 70-74 95
F-8 Mortality Comparison for Females Age 75-79 95
Figure Description Page
3-1 Female Retiree Raw and Graduated Amount Adjustment Factors 22 3-2 Male Retiree Raw and Graduated Amount Adjustment Factors 23 4-1 Comparison of RP-2000 Mortality Rates by Participant Status – Males
Ages 50-69
41 4-2 Comparison of RP-2000 Mortality Rates by Participant Status –
Females Ages 50-69
5-1 Relative Mortality by Collar for Male Employees 52
5-2 Relative Mortality by Collar for Male Retirees 53
5-3 Relative Mortality by Collar for Female Employees 54
5-4 Relative Mortality by Collar for Female Retirees 55
5-5 Relative Mortality by Amount for Male Retirees 56
5-6 Relative Mortality by Amount for Female Retirees 57
C-1 Ratios of Multiemployer Mortality to RP-2000 Base – Healthy Annuitants
88
Appendix Description Page
A Letter Requesting Data with Instructions 76
B Effect of Auto Manufacturers Data 84
C Multiemployer Mortality Rates 87
D Ratios of Graduated Mortality Rates for Beneficiaries and Retirees to All Healthy Annuitants
89
E Determination and Blending of Mortality Rates 90
F Mortality Comparisons by Collar and Amount 92
The RP-2000 Mortality Tables
Executive Summary
The Retirement Protection Act of 1994 (RPA) established mortality assumptions to be used when calculating Current Liabilities for pension plans. This was the first time that standard tables had been mandated for this purpose. The Secretary of the Treasury has the authority to promulgate a new table in the year 2000. The Society of Actuaries (SoA) conducted this study of uninsured pension plan mortality in response to RPA and to ensure that the Treasury Department would have current and thorough information available when it considers updating the mandatory mortality table. The SoA charged the Retirement Plans Experience Committee (RPEC) with the responsibility for conducting this study.
The purpose of this report is to provide actuaries with all of the significant findings of the RPEC along with full explanation of when and how these should be used in reviewing or setting mortality rates for specific plans. The report does not recommend specific tables to the Secretary of Treasury to adopt in conformance to RPA. The SoA believes it is appropriately the role of the American Academy of Actuaries to recommend tables to the Secretary based on this mortality study and other pertinent information.
This report presents the RP-2000 Tables, new graduated basic amount-adjusted mortality tables projected to the year 2000, and explains how the tables were developed. Scale AA is recommended for projecting the proposed mortality rates beyond the year 2000. The report compares experience by type of employment, amount of annuity, and industry. Actuaries should keep in mind that these tables were developed from experience on mortality for uninsured pension plans and are only recommended for use for those types of plans.
The final database used for this study reflects nearly 11 million life-years of exposure and more than 190,000 deaths, all from uninsured pension plans subject to RPA Current Liability rules. More than 100 pension plans submitted data in response to the request from the RPEC for experience from plan years 1990 through 1994. The RPEC determined that this volume of data was sufficient to produce valid mortality tables.
The contributors were asked to provide data defined by several characteristics including Standard Industrial Classification (SIC) and amount. The contributors indicated whether the plan covered hourly or salaried workers, and whether the plan was collectively bargained or not. Based on this information, plans were categorized as blue collar, white collar, or mixed collar. The data contributors summarized their mortality experience into cells by age, gender, and status (employees, retirees, disableds, and beneficiaries).
For each cell, the RPEC asked the submitter to provide the number of participants on the valuation date, the amounts of annual pay or annuities, the number of deaths during the year following the valuation date, and the amounts associated with those deaths. While all data contributors included the number of participants and the number of deaths, many did not provide information on amounts. About 60 percent of the exposed employee lives and 40 percent of the exposed annuitant lives included
information about amounts. The RPEC used data from plans providing amounts to adjust the lives-based mortality for the entire database to an amount-adjusted basis.
The RPEC generated separate tables by gender for employees, healthy annuitants, and disabled retirees. The RPEC agreed that there was sufficient data for credible tables for these groups and that the mortality among the groups differed sufficiently to justify use of separate tables. Where unisex tables are desirable, the RPEC recommends that the actuary should construct blended tables based on the proportion of each gender in the plan population.
The healthy annuitant table combines experience of healthy retirees and beneficiaries. A combined employee and healthy annuitant table was also produced as a more direct comparison to earlier tables and for actuaries to use if a combined table is needed. The RPEC encourages use of the separate employee and healthy annuitant tables.
Using the RP-2000 mortality table for healthy annuitants may overstate plan liabilities if used to value benefits for both healthy and disabled annuitants. However, the RP-2000 mortality table for disabled retirees may not be appropriate for valuing benefits of disabled annuitants in all cases. This table is based on the experience of all disabled annuitants whether or not they were eligible to receive Social Security disability benefits. Actuaries should use professional judgment when applying this table if the plan’s definition of disability is particularly strict or liberal.
The central year of the data for these tables was estimated as 1992 and the tables were projected to the base year 2000. Three sources of data were reviewed to study recent trends in mortality. These were Social Security, Federal Civil Service, and the data collected for this study. The RPEC developed
mortality improvement factors to project from 1992 to 2000 based on analysis of these sources. To study long-term trends in mortality the RPEC examined data from four sources: Social Security, Federal Civil Service, the Railroad Retirement Board, and the SoA group annuity mortality studies. The RPEC decided to recommend the use of Scale AA for projecting mortality rates beyond the year 2000. Scale AA was developed for use with the Group Annuity Reserving 1994 table. The RPEC recommends projection of mortality rates and encourages the use of generational mortality projection. In cases where it is not material or cost effective to incorporate generational mortality projection, the actuary should project mortality improvement on a comparable static basis.
Statistical analysis of the data showed that collar type and amount are both significant predictors of mortality for this data set. For example, for male annuitants age 65 to 69 the small amount mortality was 77 percent greater than the large amount mortality and blue collar mortality was 43 percent greater than white collar mortality. By comparison, male annuitant mortality was 31 percent greater than female mortality at age 67. Collar type is defined as blue or white depending on the characteristics of the group. Amount is defined as low, medium, or high based on the individual’s annuity. SIC was not found to be a consistently significant predictor of mortality.
The RPEC found that both collar and amount can bear a relationship to the underlying mortality characteristics of a retirement plan. The RPEC recommends that the individual characteristics and experience of a retirement plan be considered in selecting the mortality table. In certain cases either collar or amount may be appropriate factors to consider, subject to the theoretical concerns outlined in Chapter 5. While either factor was found to be a statistically significant indicator of differences in mortality, the RPEC recognizes that for the majority of plans subject to RPA legislation, adjustment of the standard mortality tables in a manner consistent with the data collection method and results of this study will be considerably more practical if the collar factor is used.
An analysis of the variability of mortality experience among plans in the same industry showed that differences were statistically significant in most cases tested. Actual deaths by plan ranged from about 20 percent below industry average to 30 percent above industry average. Significant differences were found even after adjusting for collar type and annuity size group.
Annuity values based on the RP-2000 Tables were calculated and compared to annuity values based on the GAM-83 and UP-94 tables. In general, the RP-2000 values are between two and nine percent higher for males and between three and five percent lower for females than the GAM-83 values. The RP-2000 values for males under age 80 are within two percent of the values based on the UP-94 table projected to 2000. For males at ages 80 and 90 the RP-2000 values are substantially lower than the projected UP-94 values. For females the RP-2000 values are lower than the projected UP-94 values by about two to four percent.
Chapter 1 - Background and Collection of Data
Reason for New Study
The Retirement Plans Experience Committee (RPEC) initiated the study in 1995 at the request of the Committee on Retirement Systems Research of the Society of Actuaries (SoA). This study is in response to provisions of the Retirement Protection Act of 1994 (RPA) which was passed as part of the General Agreement on Tariffs and Trade (GATT). The GATT legislation [PL 103-465] was signed by President Clinton on December 8, 1994.
The RPA changed the Current Liability provisions of the minimum funding standards in several ways. The change relevant to this study concerns the mortality assumptions used to calculate a plan’s Current Liability [IRC section 412(l)(7)(C)(ii)]. Through 1999, such plans must use the 1983 Group Annuity Mortality (GAM-83) tables for healthy lives as specified in Internal Revenue Service (IRS) Revenue Ruling 95-28 and disabled lives as specified in Revenue Ruling 96-7. The latter Revenue Ruling provides for separate gender-distinct mortality tables for annuitants who became disabled after 1994 and who are receiving Social Security disability benefits. The ruling also provides for separate gender-distinct mortality tables for annuitants who became disabled before 1995, regardless of their eligibility for Social Security disability benefits. The Secretary of the Treasury may, but is not required to,
promulgate a new table in 2000. Thereafter, the Secretary will be able to change the mortality standard every five years. IRS Announcement 2000-7 (January 21, 2000) states that the IRS and the Treasury Department “anticipate that in no event would there be any change in the mortality tables for plan years beginning before January 1, 2001.”
The Group Annuity Reserving 1994 (GAR-94) and Uninsured Pensioner 1994 (UP-94) tables had recently been published when GATT was passed. However, the SoA believed that there was sufficient interest in the RPA provisions to call for a new study of pension plan mortality. Since sufficient data were submitted to produce a set of new mortality tables, the RPEC asked the SoA for authorization to produce a set of mortality tables based on the experience submitted. The SoA approved the request. Role of the RPEC
Initially the RPEC had two goals for its work on the new mortality data. The first was the traditional role of performing a complete mortality study for actuaries to use in determining the best mortality rates for an individual plan. The second was to recommend a table or set of tables for the Secretary of Treasury to adopt in conformance with GATT legislation.
It soon became clear that these two goals could not both be met in one study. The RPEC could not produce a single report that both (1) presents the full range of tables and modifications that should be considered by actuaries in selecting the most appropriate mortality rate for a pension plan, and (2) presents a more narrow set of tables to be recommended to the Secretary of the Treasury for adoption in conformance with RPA.
We discussed this issue with officials of the Society of Actuaries and agreed that our report should focus on the traditional role of providing full information with appropriate caveats on the source and potential use of the mortality tables. This report is not a recommendation to the Secretary of the Treasury for tables to adopt in conformance with RPA. The SoA believes it is appropriately the role of the American Academy of Actuaries to recommend tables to the Secretary based on this mortality study and other pertinent information.
RPEC Process
All of the RPEC meetings have been open. Representatives of the four government agencies with a potential interest in the work were kept informed of the meetings throughout and often attended the meetings. The four agencies are the Office of Tax Policy of the Treasury Department, the Internal Revenue Service (IRS), the Pension Benefit Guaranty Corporation (PBGC), and the Pension and Welfare Benefits Administration (PWBA) of the Department of Labor. Other interested parties, including representatives of the American Academy of Actuaries and other committees of the SoA have attended meetings. The minutes of all of the meetings have been published in the Pension Section News.
RPEC Membership
The members of the RPEC are Vincent Amoroso, Kevin Binder, John Kalnberg, Lindsay Malkiewich, Julie Pope, Barthus Prien, Gregory Schlappich, and Diane Storm. The Chair is Edwin Hustead and the Vice-Chair is Michael Virga. Four of the members had participated in the committees that had
developed the UP-94 and GAR-94 mortality tables. Call for Data
The RPEC developed a set of data submission instructions, along with an explanatory cover letter requesting the data (see Appendix A). These were sent to all members of the Pension Section of the Society of Actuaries on September 29, 1995. A letter from representatives of four large industrial companies to many of their colleagues encouraged participation in the study.
The original deadline for submissions of December 31, 1995 was extended twice to allow for the submission of major sets of data that were being prepared. Eventually data collection was closed on June 1, 1996.
Data Requested
For each plan, actuaries were asked to provide a plan number assigned by the submitter, the plan sponsor’s Standard Industrial Classification (SIC) code, and the type of participants (salaried, hourly, union, non-union, or a combination). If the participants were not all of one type, the submitter was asked to estimate the percentage of each type in the plan. Submitters were also asked to provide a
brief summary of eligibility and benefit formulas, the disability provisions, and any other information that would be helpful in interpreting the data.
Actuaries were asked to submit data celled according to the following characteristics: • Valuation date
• Age nearest valuation date • Gender
• Participant status - employee, non-disabled retiree, disabled retiree, or beneficiary • Annuity size for retirees and beneficiaries - small (annuity of less than $6,000 a year),
medium ($6,000 to $14,400 a year) or large (more than $14,400 a year) For each cell, the submitter was asked to provide the following information:
• The number of participants on the valuation date • Total annual pay for employees
• Total annual benefit for retirees and beneficiaries
• Number and annual pay for deaths among employees during the year following the valuation date
• Number and annual benefit for deaths among retirees and beneficiaries during the year following the valuation date
The preferred period of measurement was plan years ending in 1990 through 1994. Data Collection Process
To ensure confidentiality, submissions were first received by Tom Edwalds, FSA, of the Society of Actuaries. The SoA staff checked that each submission contained both a computer diskette and hard copy of the data, along with a description of pertinent plan benefits. The three automobile industry submitters were concerned about confidentiality and asked for special processing of their data. The automobile industry submitted data split up into many small files in order to mask the identity of the contributor. The SoA staff verified that all of the small files used identical formats, that the hard copies all had the same appearance, and that the sum of the exposures and deaths by gender, collar, and status for the files submitted by each company matched the control totals provided. The small files were then copied onto four diskettes in such a way that each diskette contained some of the files submitted by each manufacturer. The hard copies of the data were placed into binders in the same order as the small files were organized on the diskettes. The list of plan numbers used by each manufacturer has been kept strictly confidential by SoA staff.
The data were then forwarded to the research team contracted to code, review, and summarize the data. The research team consisted of Kathleen S. Elder, FSA, and Laxman Hegde, Ph.D., at Frostburg State University. Ms. Elder is an Associate Professor of Actuarial Science with over 14 years
experience in the pension field. Dr. Hegde is a statistician with extensive consulting experience in statistical analysis and expertise in major statistical software.
Elder consolidated the type categories into blue or white collar. The type was set as blue collar if more than 70 percent of the participants were hourly or union. The type was set as white collar if more than 70 percent of the participants were salaried and non-union. If the type could not be determined from the available information, Elder called the submitting actuary to determine if one of the two types could be assigned. If the type still could not be determined, it was set as mixed collar.
Annuity size was coded as small, medium, or large based on the designation by the submitter using the definition provided by the RPEC. Other data were coded as unknown amount. Submitters were asked to use the straight-life equivalents of annuities, if possible. Only one plan submitted data that were specifically converted to the straight-life equivalent and most of the other submitters stated that the conversion was not made. The RPEC decided that combining all amounts as reported would not significantly distort the analysis.
In order to maintain the confidentiality of the data, Elder then stripped the plan identifiers from the database prepared for the RPEC. Every cell accessible to the RPEC contained data from at least two plans, so the RPEC had no way of analyzing data by plan or of identifying or reconstructing the experience of any plan.
Industry code was the initial two digits of the SIC code. Since there was only one plan in SIC 35xx (machinery except electrical) it was merged with the plans in industry code 36 (electrical and electronic machinery) to preserve confidentiality. After this combination and the exclusion of plans in two other codes for the reasons discussed in Chapter 2, there remained 35 industry codes in the data set. Thirty-eight percent of the submissions, including 58 percent of the exposure years, were for all plan years from 1990 through 1994. The rest covered a mix of years with some plans providing fewer than five years and others using a period that extended up to a year before or after the 1990 through 1994 plan years. The RPEC deemed a midpoint of 1992 to be appropriate for the combined data.
A summary of plan provisions, including eligibility for early retirement and disability benefits, was submitted for almost all of the plans. This information was used to check for data inconsistencies such as retirees who were too young to retire under the plan provisions.
Chapter 2 - Validation of Data and Final Data Set
The members of the RPEC and the research team reviewed all data for reasonableness. Elder discussed questions concerning potential errors with the submitters. Questions about the automobile industry data were relayed through Edwalds.
Reasonableness checks were applied to the data received for each pension plan, including: • aging of participant population by category from year to year
• significant increase/decrease in participant count by category from year to year • unusual ages (e.g. “old” employees or “young” retirees)
• proportions of population in various groups (e.g. male/female, active/retiree) • increases in salary from year to year
After the initial review, the number of deaths in each of the individual pension plans was compared to the expected number of deaths based on the total experience of the entire group by category as defined by participant gender, collar, and status. Submitters of pension plans with data outside a 95 percent confidence interval were contacted to determine if a correction should be made. Some of the data sets were accepted as valid based on explanations by the submitters. Other data sets were corrected by the submitters. This procedure was used for all data contributions, including the auto manufacturers data. The reasonableness checks on the automobile data were performed by Edwalds because of the confidentiality agreement. All questioned data were corrected to the satisfaction of the RPEC.
One of the auto manufacturers was among those who decided to resubmit corrected data. In order to maintain the confidentiality of all of the automobile contributors, Edwalds stripped the valuation date from the corrected submission and the submissions of the other firms from the automobile industry and combined them before forwarding the corrected data to the researchers. The RPEC voted to accept the auto manufacturers’ data, as corrected, into the final data set. Results were later compared with and without the auto manufacturers’ data. The RPEC found that the raw quinquennial death rates were quite similar both ways. Appendix B shows the effect of the auto manufacturers data.
Some data were submitted with ages based on attained age rather than nearest age on respective valuation dates. These data were adjusted to an age nearest birthday basis by assigning one-half of the exposures and deaths to the age shown and one-half of exposures and deaths to the next age.
Exclusions
The primary reason for excluding data was incomplete information. Data submissions that combined all inactive statuses (healthy retirees, beneficiaries, and/or disability retirees) or combined active employees
with one or more inactive statuses were excluded. Data submitted in 5-year groups rather than single ages were also excluded. Data with unknown participant status were excluded.
One plan was excluded because the measurement period for the deaths did not match the measurement period for the corresponding valuation cells of exposure. In other words, deaths reported by that plan included persons who were not in the exposure at the beginning of the year or who were included in the exposure at the end of the year of death.
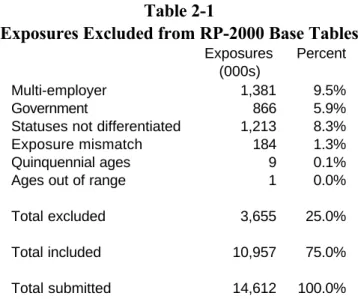
Records of retirees under age 28 and active employees under age 16 were excluded from the database. In addition, the RPEC excluded data of pension plans that are not directly affected by the RPA Current Liability rules so that the resulting mortality experience would be more appropriate for purposes of the Act. This resulted in the exclusion of data submitted for two large multiemployer pension plans in the transportation industry (industry code 42) and a large government pension plan (industry code 99). Table 2-1 summarizes the exposures excluded from the study by reason for exclusion.
Table 2-1
Exposures Excluded from RP-2000 Base Tables
Exposures (000s)
Percent
Multi-employer 1,381 9.5%
Government 866 5.9%
Statuses not differentiated 1,213 8.3%
Exposure mismatch 184 1.3%
Quinquennial ages 9 0.1%
Ages out of range 1 0.0%
Total excluded 3,655 25.0%
Total included 10,957 75.0% Total submitted 14,612 100.0%
Appendix C compares the mortality of the multi-employer data that was excluded from the final data base. Since the total multi-employer data were only from two plans, the comparison is presented as information only and should not be used to establish multi-employer mortality tables.
Resulting Data Set
The data set accepted by the RPEC as the basis for the mortality tables in this report included 10,957,103 exposed life-years and 190,928 deaths. Table 2-2 shows the distribution of these exposures by industry and gender.
Table 2-2
Distribution of Exposures by Industry
Males Females Total
SIC Industry Name Exposures (000s) Percent Exposures (000s) Percent Exposures (000s) Percent 37 Transportation 3,119 42% 1,142 33% 4,261 39% 36 Electronic Equipment 1,310 18% 516 15% 1,825 17% 48 Communications 552 7% 528 15% 1,080 10% 29 Petroleum 377 5% 101 3% 477 4%
33 Primary Metal Industries 373 5% 92 3% 465 4%
28 Chemicals 266 4% 148 4% 414 4%
26 Paper 120 2% 71 2% 192 2%
13 Oil and Gas Extraction 110 1% 43 1% 153 1%
All Other 1,216 16% 873 25% 2,089 19%
Total 7,443 100% 3,514 100% 10,957 100%
Table 2-2 shows that the Transportation industry data were 39 percent of the total and a substantial portion of the data in Transportation came from the auto industry. None of the auto industry data included the amount of salary or annuity. The RPEC reviewed the results with and without the auto industry to determine if the experience would have been substantially different without the auto industry. Results of that review are shown in Appendix B.
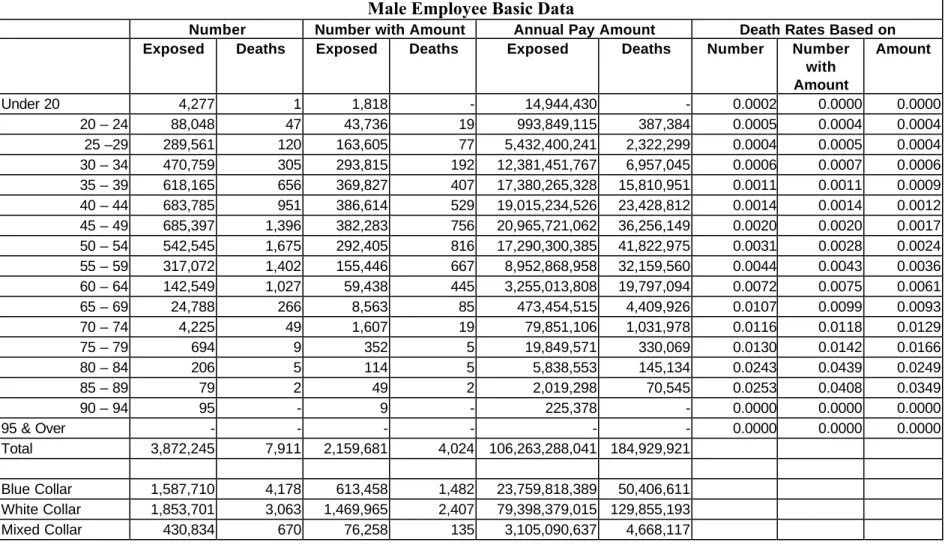
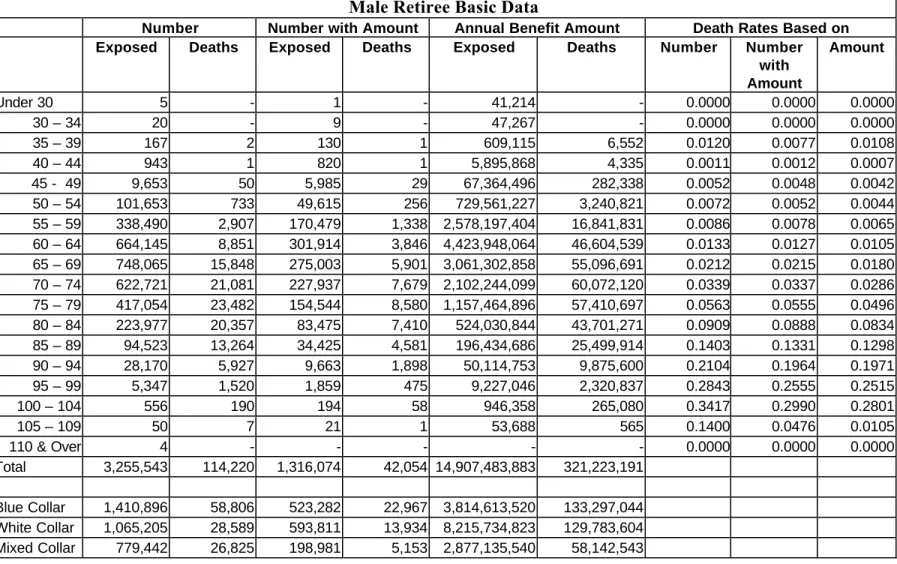
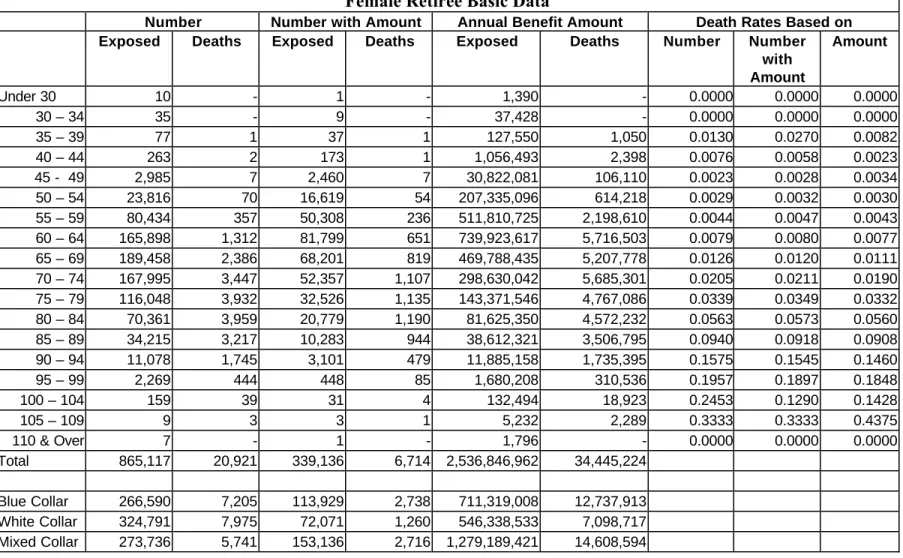
Tables 2-3 through 2-10 summarize the data for male and female exposures for employees, healthy retirees, beneficiaries, and disabled lives. Table 2-11 aggregates all data. Amounts were reported for 50 percent of the exposures. About 60 percent of the exposed employee life-years and 38 percent of the exposed annuitant life-years included information about amounts.
Tables 2-3 through 2-10 compare raw death rates computed by dividing deaths by exposures within age groups for three categories. The first is the death rates based on number from the entire data base. The second is the death rates based on number only for data for which amount was reported. The third is the death rates based on amount.
The comparison of the two death rates determined by number shows that, in general, there was not a substantial difference between the death rates for the entire data base and the data base limited to those with amount reported.
Table 2-3 Male Employee Basic Data
Number Number with Amount Annual Pay Amount Death Rates Based on
Exposed Deaths Exposed Deaths Exposed Deaths Number Number
with Amount Amount Under 20 4,277 1 1,818 - 14,944,430 - 0.0002 0.0000 0.0000 20 – 24 88,048 47 43,736 19 993,849,115 387,384 0.0005 0.0004 0.0004 25 –29 289,561 120 163,605 77 5,432,400,241 2,322,299 0.0004 0.0005 0.0004 30 – 34 470,759 305 293,815 192 12,381,451,767 6,957,045 0.0006 0.0007 0.0006 35 – 39 618,165 656 369,827 407 17,380,265,328 15,810,951 0.0011 0.0011 0.0009 40 – 44 683,785 951 386,614 529 19,015,234,526 23,428,812 0.0014 0.0014 0.0012 45 – 49 685,397 1,396 382,283 756 20,965,721,062 36,256,149 0.0020 0.0020 0.0017 50 – 54 542,545 1,675 292,405 816 17,290,300,385 41,822,975 0.0031 0.0028 0.0024 55 – 59 317,072 1,402 155,446 667 8,952,868,958 32,159,560 0.0044 0.0043 0.0036 60 – 64 142,549 1,027 59,438 445 3,255,013,808 19,797,094 0.0072 0.0075 0.0061 65 – 69 24,788 266 8,563 85 473,454,515 4,409,926 0.0107 0.0099 0.0093 70 – 74 4,225 49 1,607 19 79,851,106 1,031,978 0.0116 0.0118 0.0129 75 – 79 694 9 352 5 19,849,571 330,069 0.0130 0.0142 0.0166 80 – 84 206 5 114 5 5,838,553 145,134 0.0243 0.0439 0.0249 85 – 89 79 2 49 2 2,019,298 70,545 0.0253 0.0408 0.0349 90 – 94 95 - 9 - 225,378 - 0.0000 0.0000 0.0000 95 & Over - - - 0.0000 0.0000 0.0000 Total 3,872,245 7,911 2,159,681 4,024 106,263,288,041 184,929,921 Blue Collar 1,587,710 4,178 613,458 1,482 23,759,818,389 50,406,611 White Collar 1,853,701 3,063 1,469,965 2,407 79,398,379,015 129,855,193 Mixed Collar 430,834 670 76,258 135 3,105,090,637 4,668,117
Table 2-4
Female Employee Basic Data
Number Number with Amount Annual Pay Amount Death Rates Based on
Exposed Deaths Exposed Deaths Exposed Deaths Number Number
with Amount Amount Under 20 5,538 - 2,776 - 21,462,175 - 0.0000 0.0000 0.0000 20 – 24 90,411 9 57,403 7 1,146,112,727 111,447 0.0001 0.0001 0.0001 25 –29 230,182 45 155,858 33 4,352,463,785 766,918 0.0002 0.0002 0.0002 30 – 34 310,377 126 220,944 95 7,409,980,625 2,716,448 0.0004 0.0004 0.0004 35 – 39 329,607 198 236,324 149 8,465,073,137 5,190,039 0.0006 0.0006 0.0006 40 – 44 330,240 289 241,862 219 8,885,989,499 7,472,737 0.0009 0.0009 0.0008 45 – 49 251,168 355 178,383 263 6,673,208,286 9,271,146 0.0014 0.0015 0.0014 50 – 54 165,253 338 111,499 227 3,932,203,561 7,814,004 0.0020 0.0020 0.0020 55 – 59 94,103 270 59,157 173 1,853,462,893 5,130,346 0.0029 0.0029 0.0028 60 – 64 44,312 199 24,757 103 710,337,381 2,879,525 0.0045 0.0042 0.0041 65 – 69 9,236 67 4,629 31 124,074,071 885,120 0.0072 0.0067 0.0071 70 – 74 1,659 13 808 10 17,371,121 269,434 0.0078 0.0124 0.0155 75 – 79 202 2 103 - 2,163,687 - 0.0099 0.0000 0.0000 80 – 84 31 - 8 - 176,301 - 0.0000 0.0000 0.0000 85 – 89 6 - 1 - 4,435 - 0.0000 0.0000 0.0000 90 – 94 32 - 1 - 49,500 - 0.0000 0.0000 0.0000 95 & Over 1 - - - 0.0000 0.0000 0.0000 Total 1,862,358 1,911 1,294,513 1,310 43,594,133,184 42,507,164 Blue Collar 628,438 833 388,681 519 10,775,671,329 13,922,012 White Collar 926,708 807 790,419 705 29,608,349,947 26,500,749 Mixed Collar 307,212 271 115,413 86 3,210,111,908 2,084,403
Table 2-5 Male Retiree Basic Data
Number Number with Amount Annual Benefit Amount Death Rates Based on
Exposed Deaths Exposed Deaths Exposed Deaths Number Number
with Amount Amount Under 30 5 - 1 - 41,214 - 0.0000 0.0000 0.0000 30 – 34 20 - 9 - 47,267 - 0.0000 0.0000 0.0000 35 – 39 167 2 130 1 609,115 6,552 0.0120 0.0077 0.0108 40 – 44 943 1 820 1 5,895,868 4,335 0.0011 0.0012 0.0007 45 - 49 9,653 50 5,985 29 67,364,496 282,338 0.0052 0.0048 0.0042 50 – 54 101,653 733 49,615 256 729,561,227 3,240,821 0.0072 0.0052 0.0044 55 – 59 338,490 2,907 170,479 1,338 2,578,197,404 16,841,831 0.0086 0.0078 0.0065 60 – 64 664,145 8,851 301,914 3,846 4,423,948,064 46,604,539 0.0133 0.0127 0.0105 65 – 69 748,065 15,848 275,003 5,901 3,061,302,858 55,096,691 0.0212 0.0215 0.0180 70 – 74 622,721 21,081 227,937 7,679 2,102,244,099 60,072,120 0.0339 0.0337 0.0286 75 – 79 417,054 23,482 154,544 8,580 1,157,464,896 57,410,697 0.0563 0.0555 0.0496 80 – 84 223,977 20,357 83,475 7,410 524,030,844 43,701,271 0.0909 0.0888 0.0834 85 – 89 94,523 13,264 34,425 4,581 196,434,686 25,499,914 0.1403 0.1331 0.1298 90 – 94 28,170 5,927 9,663 1,898 50,114,753 9,875,600 0.2104 0.1964 0.1971 95 – 99 5,347 1,520 1,859 475 9,227,046 2,320,837 0.2843 0.2555 0.2515 100 – 104 556 190 194 58 946,358 265,080 0.3417 0.2990 0.2801 105 – 109 50 7 21 1 53,688 565 0.1400 0.0476 0.0105 110 & Over 4 - - - 0.0000 0.0000 0.0000 Total 3,255,543 114,220 1,316,074 42,054 14,907,483,883 321,223,191 Blue Collar 1,410,896 58,806 523,282 22,967 3,814,613,520 133,297,044 White Collar 1,065,205 28,589 593,811 13,934 8,215,734,823 129,783,604 Mixed Collar 779,442 26,825 198,981 5,153 2,877,135,540 58,142,543
Table 2-6 Female Retiree Basic Data
Number Number with Amount Annual Benefit Amount Death Rates Based on
Exposed Deaths Exposed Deaths Exposed Deaths Number Number
with Amount Amount Under 30 10 - 1 - 1,390 - 0.0000 0.0000 0.0000 30 – 34 35 - 9 - 37,428 - 0.0000 0.0000 0.0000 35 – 39 77 1 37 1 127,550 1,050 0.0130 0.0270 0.0082 40 – 44 263 2 173 1 1,056,493 2,398 0.0076 0.0058 0.0023 45 - 49 2,985 7 2,460 7 30,822,081 106,110 0.0023 0.0028 0.0034 50 – 54 23,816 70 16,619 54 207,335,096 614,218 0.0029 0.0032 0.0030 55 – 59 80,434 357 50,308 236 511,810,725 2,198,610 0.0044 0.0047 0.0043 60 – 64 165,898 1,312 81,799 651 739,923,617 5,716,503 0.0079 0.0080 0.0077 65 – 69 189,458 2,386 68,201 819 469,788,435 5,207,778 0.0126 0.0120 0.0111 70 – 74 167,995 3,447 52,357 1,107 298,630,042 5,685,301 0.0205 0.0211 0.0190 75 – 79 116,048 3,932 32,526 1,135 143,371,546 4,767,086 0.0339 0.0349 0.0332 80 – 84 70,361 3,959 20,779 1,190 81,625,350 4,572,232 0.0563 0.0573 0.0560 85 – 89 34,215 3,217 10,283 944 38,612,321 3,506,795 0.0940 0.0918 0.0908 90 – 94 11,078 1,745 3,101 479 11,885,158 1,735,395 0.1575 0.1545 0.1460 95 – 99 2,269 444 448 85 1,680,208 310,536 0.1957 0.1897 0.1848 100 – 104 159 39 31 4 132,494 18,923 0.2453 0.1290 0.1428 105 – 109 9 3 3 1 5,232 2,289 0.3333 0.3333 0.4375 110 & Over 7 - 1 - 1,796 - 0.0000 0.0000 0.0000 Total 865,117 20,921 339,136 6,714 2,536,846,962 34,445,224 Blue Collar 266,590 7,205 113,929 2,738 711,319,008 12,737,913 White Collar 324,791 7,975 72,071 1,260 546,338,533 7,098,717 Mixed Collar 273,736 5,741 153,136 2,716 1,279,189,421 14,608,594
Table 2-7
Male Beneficiary Basic Data
Number Number with Amount Annual Benefit Amount Death Rates Based on
Exposed Deaths Exposed Deaths Exposed Deaths Number Number
with Amount Amount Under 20 13 - 4 - 17,588 - 0.0000 0.0000 0.0000 20 – 24 29 1 7 - 23,294 - 0.0345 0.0000 0.0000 25 – 29 38 1 23 - 51,754 - 0.0263 0.0000 0.0000 30 – 34 84 4 25 - 64,159 - 0.0476 0.0000 0.0000 35 – 39 156 6 73 2 206,446 4,124 0.0385 0.0274 0.0200 40 – 44 306 3 167 1 500,048 3,459 0.0098 0.0060 0.0069 45 – 49 517 11 305 7 891,343 27,065 0.0213 0.0230 0.0304 50 – 54 850 15 485 7 1,884,893 13,548 0.0176 0.0144 0.0072 55 – 59 1,465 31 772 18 2,478,958 37,456 0.0212 0.0233 0.0151 60 – 64 2,623 53 1,332 33 4,617,797 91,719 0.0202 0.0248 0.0199 65 – 69 4,508 144 2,157 68 7,214,567 217,818 0.0319 0.0315 0.0302 70 – 74 4,835 231 2,371 90 7,150,610 247,767 0.0478 0.0380 0.0346 75 – 79 3,893 270 1,861 97 5,501,201 322,994 0.0694 0.0521 0.0587 80 – 84 2,392 205 1,203 88 3,354,323 205,359 0.0857 0.0732 0.0612 85 – 89 942 108 570 51 1,818,461 176,601 0.1146 0.0895 0.0971 90 – 94 347 48 252 30 724,997 75,884 0.1383 0.1190 0.1047 95 – 99 28 7 17 5 40,190 10,284 0.2500 0.2941 0.2559 100 – 104 1 - - - 0.0000 0.0000 0.0000 105 – 109 5 - 4 - 10,608 - 0.0000 0.0000 0.0000 110 & Over 2 - - - 0.0000 0.0000 0.0000 Total 23,034 1,138 11,628 497 36,551,237 1,434,078 Blue Collar 11,924 539 4,949 154 11,954,402 367,096 White Collar 8,386 395 4,929 217 21,019,200 833,814 Mixed Collar 2,724 204 1,750 126 3,577,635 233,168
Table 2-8
Female Beneficiary Basic Data
Number Number with Amount Annual Benefit Amount Death Rates Based on
Exposed Deaths Exposed Deaths Exposed Deaths Number Number
with Amount Amount Under 20 17 - 2 - 2,996 - 0.0000 0.0000 0.0000 20 – 24 52 1 29 1 59,900 2,427 0.0192 0.0345 0.0405 25 – 29 121 2 65 - 190,119 - 0.0165 0.0000 0.0000 30 – 34 515 9 188 3 494,807 4,000 0.0175 0.0160 0.0081 35 – 39 1,677 5 615 1 1,834,354 710 0.0030 0.0016 0.0004 40 – 44 3,923 19 1,483 8 4,350,227 22,489 0.0048 0.0054 0.0052 45 – 49 8,566 30 2,856 11 9,072,133 20,353 0.0035 0.0039 0.0022 50 – 54 19,218 87 7,199 42 25,105,440 116,199 0.0045 0.0058 0.0046 55 – 59 37,947 285 14,246 138 53,115,671 461,591 0.0075 0.0097 0.0087 60 – 64 72,629 880 27,410 329 94,017,128 957,367 0.0121 0.0120 0.0102 65 – 69 118,110 2,138 43,206 760 131,641,568 2,044,862 0.0181 0.0176 0.0155 70 – 74 149,516 3,918 53,526 1,391 140,397,319 3,444,932 0.0262 0.0260 0.0245 75 – 79 141,176 5,398 46,355 1,628 103,269,138 3,490,732 0.0382 0.0351 0.0338 80 – 84 93,254 5,597 28,425 1,579 58,171,801 3,019,378 0.0600 0.0555 0.0519 85 – 89 44,665 4,316 12,568 1,084 24,356,125 2,055,072 0.0966 0.0863 0.0844 90 – 94 14,800 2,243 3,929 509 7,359,854 996,421 0.1516 0.1295 0.1354 95 – 99 2,685 593 782 137 1,518,716 242,734 0.2209 0.1752 0.1598 100 – 104 260 72 87 24 168,091 30,104 0.2769 0.2759 0.1791 105 – 109 34 6 11 1 11,695 36 0.1765 0.0909 0.0031 110 & Over 10 1 1 - 274 - 0.1000 0.0000 0.0000 Total 709,175 25,600 242,983 7,646 655,137,356 16,909,407 Blue Collar 435,866 16,245 108,870 3,241 199,855,451 5,437,415 White Collar 199,065 6,382 78,256 2,072 287,509,858 6,094,324 Mixed Collar 74,244 2,973 55,857 2,333 167,772,047 5,377,668
Table 2-9
Male Disabled Annuitant Basic Data
Number Number with Amount Annual Benefit Amount Death Rates Based on
Exposed Deaths Exposed Deaths Exposed Deaths Number Number
with Amount Amount Under 30 5 - 5 - 55,193 - 0.0000 0.0000 0.0000 30 – 35 130 4 15 - 22,583 - 0.0308 0.0000 0.0000 35 – 39 2,331 29 158 3 772,908 22,635 0.0124 0.0190 0.0293 40 – 44 8,323 139 937 25 5,854,688 151,671 0.0167 0.0267 0.0259 45 – 49 17,411 410 2,515 86 18,464,071 637,947 0.0235 0.0342 0.0346 50 – 54 26,683 783 4,569 136 34,936,344 1,235,866 0.0293 0.0298 0.0354 55 – 59 36,001 1,325 7,782 283 61,729,312 2,326,766 0.0368 0.0364 0.0377 60 – 64 51,231 2,280 12,064 509 89,975,061 3,919,260 0.0445 0.0422 0.0436 65 – 69 57,983 3,191 14,429 782 97,038,223 5,041,302 0.0550 0.0542 0.0520 70 – 74 48,139 3,439 12,872 911 79,031,912 5,403,689 0.0714 0.0708 0.0684 75 – 79 28,661 2,742 7,952 759 45,206,389 3,957,455 0.0957 0.0954 0.0875 80 – 84 11,371 1,521 3,300 445 17,280,919 2,212,304 0.1338 0.1348 0.1280 85 – 89 3,016 523 955 173 4,856,706 743,491 0.1734 0.1812 0.1531 90 - 94 754 154 206 57 1,031,359 272,007 0.2042 0.2767 0.2637 95 – 99 133 42 50 19 211,615 85,546 0.3158 0.3800 0.4043 100 & Over 10 2 1 - 6,382 - 0.2000 0.0000 0.0000 Total 292,182 16,584 67,810 4,188 456,473,665 26,009,939 Blue Collar 213,502 12,006 40,967 2,527 228,086,285 12,721,277 White Collar 46,605 2,517 11,441 687 97,952,954 5,402,883 Mixed Collar 32,075 2,061 15,402 974 130,434,426 7,885,779
Table 2-10
Female Disabled Annuitant Basic Data
Number Number with Amount Annual Benefit Amount Death Rates Based on
Exposed Deaths Exposed Deaths Exposed Deaths Number Number
with Amount Amount Under 30 2 - 1 - 1,963 - 0.0000 0.0000 0.0000 30 – 35 50 - 7 - 26,738 - 0.0000 0.0000 0.0000 35 – 39 984 3 125 3 663,811 12,178 0.0030 0.0240 0.0183 40 – 44 3,015 17 749 8 5,176,023 69,737 0.0056 0.0107 0.0135 45 – 49 5,358 49 1,494 24 10,660,044 172,103 0.0091 0.0161 0.0161 50 – 54 7,202 72 1,687 29 11,876,837 203,351 0.0100 0.0172 0.0171 55 – 59 8,723 173 2,414 62 15,335,219 469,523 0.0198 0.0257 0.0306 60 – 64 11,347 268 3,592 92 19,931,258 526,673 0.0236 0.0256 0.0264 65 – 69 12,842 362 4,507 133 20,861,206 668,552 0.0282 0.0295 0.0320 70 – 74 12,192 510 3,499 150 14,247,788 649,833 0.0418 0.0429 0.0456 75 – 79 8,206 501 1,918 129 6,768,822 416,487 0.0611 0.0673 0.0615 80 – 84 4,728 368 1,737 128 6,271,731 473,722 0.0778 0.0737 0.0755 85 – 89 2,235 219 1,110 108 4,075,631 394,454 0.0980 0.0973 0.0968 90 - 94 525 96 289 57 1,081,881 211,705 0.1829 0.1972 0.1957 95 – 99 49 13 22 6 82,362 21,837 0.2653 0.2727 0.2651 100 & Over 5 1 3 - 12,552 - 0.2000 0.0000 0.0000 Total 77,463 2,652 23,154 929 117,073,866 4,290,155 Blue Collar 53,656 1,792 8,120 369 34,410,784 1,482,027 White Collar 11,866 470 4,790 215 28,229,344 1,067,199 Mixed Collar 11,941 390 10,244 345 54,433,738 1,740,929
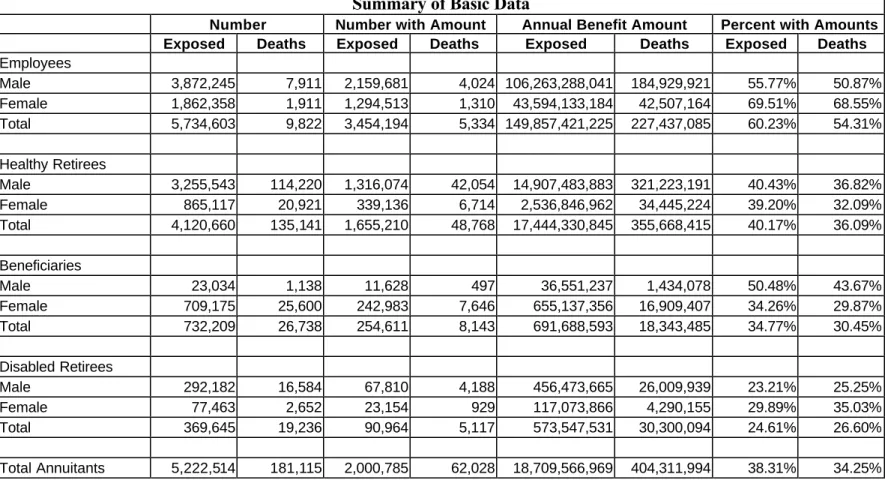
Table 2-11 Summary of Basic Data
Number Number with Amount Annual Benefit Amount Percent with Amounts
Exposed Deaths Exposed Deaths Exposed Deaths Exposed Deaths
Employees Male 3,872,245 7,911 2,159,681 4,024 106,263,288,041 184,929,921 55.77% 50.87% Female 1,862,358 1,911 1,294,513 1,310 43,594,133,184 42,507,164 69.51% 68.55% Total 5,734,603 9,822 3,454,194 5,334 149,857,421,225 227,437,085 60.23% 54.31% Healthy Retirees Male 3,255,543 114,220 1,316,074 42,054 14,907,483,883 321,223,191 40.43% 36.82% Female 865,117 20,921 339,136 6,714 2,536,846,962 34,445,224 39.20% 32.09% Total 4,120,660 135,141 1,655,210 48,768 17,444,330,845 355,668,415 40.17% 36.09% Beneficiaries Male 23,034 1,138 11,628 497 36,551,237 1,434,078 50.48% 43.67% Female 709,175 25,600 242,983 7,646 655,137,356 16,909,407 34.26% 29.87% Total 732,209 26,738 254,611 8,143 691,688,593 18,343,485 34.77% 30.45% Disabled Retirees Male 292,182 16,584 67,810 4,188 456,473,665 26,009,939 23.21% 25.25% Female 77,463 2,652 23,154 929 117,073,866 4,290,155 29.89% 35.03% Total 369,645 19,236 90,964 5,117 573,547,531 30,300,094 24.61% 26.60% Total Annuitants 5,222,514 181,115 2,000,785 62,028 18,709,566,969 404,311,994 38.31% 34.25%
Chapter 3
-
Construction of Basic Table
Selection and Production of Basic Tables
The primary tables produced by the RPEC are the following gender distinct tables: Employees
Healthy Annuitants (healthy retirees and beneficiaries combined) Disabled Retirees
The RPEC elected to publish separate tables for healthy annuitants and employees because the data for ages with substantial experience from both data sets indicated that mortality is
significantly lower for employees than for healthy annuitants. The RPEC found that there was a significant difference between the mortality for female beneficiaries and healthy female retirees. However, the RPEC decided that there was not enough data on male beneficiaries to determine male beneficiary mortality rates. While separate tables could have been produced for female retirees and beneficiaries, the RPEC believes that the practicing actuary need not use distinct tables for these groups.
For the purpose of calculating Current Liabilities, RR 96-7 mandates the use of the same mortality table for healthy annuitants and disabled annuitants when Social Security disability status is unknown and the disabilities occurred after 1994. This precludes the use of separate mortality tables for disabled annuitants in that case. The data contributors for this study did not provide information on the subgroup of disabled retirees who were also receiving Social Security benefits. Therefore, the RP-2000 mortality table for disabled annuitants presented in this report is not appropriate to predict the mortality of either of the post-1994 disabled
subgroups specified in RR 96-7 but it may be appropriate for mortality of those disabled before 1995. However, using the RP-2000 mortality table for healthy annuitants may overstate plan liabilities if used to value benefits for both healthy and disabled annuitants.
The tables were produced through the following steps, described in this chapter: • The raw qxs were determined based on lives
• Amount-adjusted qxs were determined by applying amount adjustment factors • Healthy retiree and beneficiary rates were blended to produce healthy annuitant
rates
Selection of Graduation Methods
Selection of an appropriate graduation method is critical to the production of an actuarial mortality table. In this case, as for previous published tables, the final rates were graduated to produce a set of rates that change continuously to reflect underlying mortality patterns.
Graduation was also used to determine the amount-adjusted qxs.
The selection of a graduation method involves a compromise between smoothness and fit. The task of the RPEC was to use methods that produced reasonably smooth tables but did not mask major underlying characteristics of mortality. For instance, the use of a Gompertz or Makeham formula creates very smooth rates but masks the deceleration of mortality increases at the very old ages.
The two methods used by the actuarial profession in the United States have been Whittaker-Henderson Type B and Karup-King. Whittaker-Whittaker-Henderson Type B is more precise for large bodies of data. Since the data set was very large, the RPEC decided to use the Whittaker-Henderson Type B graduation method for all graduation purposes. The key parameters for this method are the number of differences, and the h value. In particular, higher values of h result in greater smoothness. [London, Dick. 1985. Graduation: The Revision of Estimates]
Figures 3-1 and 3-2 show the raw amount adjustment factors (ratios of average amount for deaths to average amount exposed) and two different graduations of the raw rates. This highlights the differences between using the “regular” graduation that is often used for final smoothing and “heavy” graduation. The heavy graduation (achieved with fewer differences and higher h values) produces very smooth results but masks some of the key underlying trends. In the graph, the regular graduation uses third differences and an h value of 1,000,000. The heavy graduation uses second differences and an h value of 100,000,000.
The RPEC reviewed graduation tables within all of the reasonable ranges of h values and differences to select the graduation method most appropriate to each purpose and each set of data. Rates for healthy annuitants needed little graduation so the lightest variables were selected. At the other extreme, since graduation for amount-adjustment purposes was only to establish a smooth range of relative factors, a much heavier graduation was used.
The RPEC used the following criteria in selection of Whittaker-Henderson variables for the final graduation process:
• There should be no or a minimum number of occurrences of qx <0 • There should be no or a minimum number of occurrences of qx >1 • There should be no or a minimum number of occurrences of qx > qx+1
Figure 3-1
Female Retiree Raw and Graduated Amount Adjustment Factors
0.6 0.7 0.8 0.9 1 1.1 1.2 1.3 50 52 54 56 58 60 62 64 66 68 70 72 74 76 78 80 82 84 86 88 90 92 94 96 98 100 Age
Amount Adjustment Factor
Figure 3-2
Male Retiree Raw and Graduated Amount Adjustment Factors
0.6 0.7 0.8 0.9 1 1.1 1.2 1.3 1.4 50 52 54 56 58 60 62 64 66 68 70 72 74 76 78 80 82 84 86 88 90 92 94 96 98 100 Age
Amount Adjustment Factor
Determination of Raw qxs for Lives
For each age the number of deaths was divided by the number of life-years exposed to produce the raw qx value. Separate tables were produced by gender and status.
Amount-adjusted qxs
As with mortality tables for life insurance, the GAM-83, GAR-94, and UP-94 mortality tables were developed using amounts rather than lives, i.e. they were determined by dividing total annuity amounts for those who died by total annuity amounts for all exposed by age. This approach is equivalent to liability weighting. Liability-weighted mortality has been the general practice in developing mortality tables for the measurement of actuarial liabilities. Life insurance tables, for instance, are developed based on face amount of insurance as the base rather than number of individuals. The reason for using liability-weighted measures can be seen through an example.
Assume that a plan covers two groups of 1,000 annuitants age 65. The members of the first group all have a monthly annuity of $100 and the members of the second group all have a monthly annuity of $1,000. If the true present value of an annuity of $1 per year is 10.0 for members of the first group and 12.0 for members of the second group (resulting from lower mortality) then the total liability for the plan will be $156 million. A table that was not adjusted for differences in amount would produce an average present value factor of 11.0, which would result in an estimated liability of $145 million, thereby understating plan liabilities by $11 million or 7 percent. A liability-weighted present value factor of 11.81 applied to the entire group would produce the correct liability of $156 million.
Since the data for previous mortality studies were gathered predominately from group annuity data supplied by insurance companies, amount data were readily available. The data for the current study presented a new problem. A substantial portion of the submitters supplied only the number of lives exposed and the number of deaths and did not supply information on amounts.
As with previous studies, the current data set shows significantly higher mortality based on number of lives than based on amount of benefits for retirees or amount of salary for employees. Liabilities for pension plans are automatically weighted by amounts. Therefore, the RPEC decided to determine the mortality rates based on amounts.
The amount of salary was included for 60 percent of the employees but only 54 percent of employee deaths. The amount of benefit was included for 38 percent of the annuitants but only 34 percent of annuitant deaths. In total, information about amounts was included for 50 percent of participants and 35 percent of deaths.
a) Amount-based qxs, which are the total annuity amounts for deaths divided by total annuity amounts exposed, and
The RPEC assumed that the relationship between (a) and (b) for the subset of submissions that supplied information on amounts was representative of the entire data set (including submissions that did not provide information on amounts). After a thorough review of the data, the RPEC believed this assumption to be practical and plausible. Accordingly the RPEC adjusted the data for submissions which did not provide information on amounts.
The quotient of (a) divided by (b) is the "amount adjustment factor." The amount adjustment factor represents the difference of analyzing pension mortality data based on amounts versus analyzing only the number of deaths and exposures. Amount adjustment factors by age were determined separately for employees, healthy retirees, survivors, and disabled lives. For the submissions that only supplied the number of deaths and exposures, mortality rates were multiplied by the amount adjustment factors.
Since there was considerable variation in amount adjustment factors from one age to the next, the RPEC decided to first graduate these factors separately before applying them to the qx values for lives. The amount adjustment factors were graduated using the Whittaker-Henderson method with second differences and an h value of 100,000,000.
The ungraduated mortality rates based on number of lives were then multiplied by the graduated amount adjustment factors to produce ungraduated amount-adjusted mortality rates.
Blending of Healthy Retiree and Beneficiary Data
The graduated amount adjustment factors and ungraduated amount-adjusted mortality rates were determined separately for healthy retirees and beneficiaries. The RPEC decided to combine the healthy retiree and beneficiary rates into one “healthy annuitant” table. There were not sufficient data for a separate male beneficiary table but there were sufficient data for a separate female beneficiary table. However, the RPEC believed that a separate female beneficiary table would have added unnecessary complexity to valuations without substantially increasing validity. Appendix D shows the ratios of the graduated mortality rates for
beneficiaries and retirees to the graduated mortality rates for retirees and beneficiaries combined.
The ungraduated amount-adjusted mortality rates for healthy retirees and beneficiaries
combined were then determined as a weighted average of the corresponding amount-adjusted mortality rates.
The weights for healthy retirees and beneficiaries, respectively, at each age were the product of the total number of lives exposed at that age times the average amount exposed for those plans that did provide data on amounts.
Graduation of Amount-adjusted qxs
The resulting amount-adjusted mortality rates for employees, healthy annuitants, and disabled annuitants were graduated using Whittaker-Henderson with third differences and h values of 1,000,000 for healthy annuitants and 10,000,000 for employees and disabled lives.
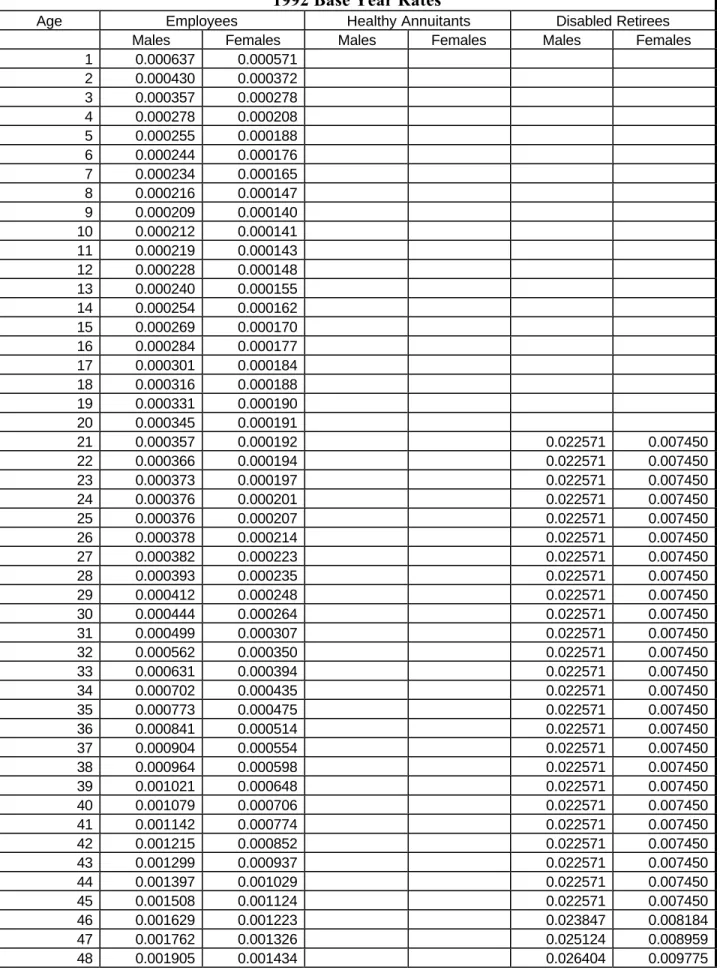
Mortality rates for disabled annuitants were set equal to the mortality rates for healthy annuitants at and after the point at which the graduated rates for disabled annuitants dropped below those for healthy annuitants. This occurred at age 89 for males and 91 for females.
Extension to Extreme Ages
The above process produced mortality rates between the following ages: Employee ages 30 through 70
Healthy annuitant ages 50 through 100 Disabled retiree ages 45 through 100
Mortality rates for employees were extended below age 30 to blend with the UP-94 table. Rates for ages 1 through 10 were set equal to the UP-94 table. Rates for ages 11 through 29 were interpolated from the UP-94 rate at age 10 to the current study rates at age 30 using cubic interpolation formulas that were designed to reproduce the general shape of the 1990 U.S. Life table at these ages.
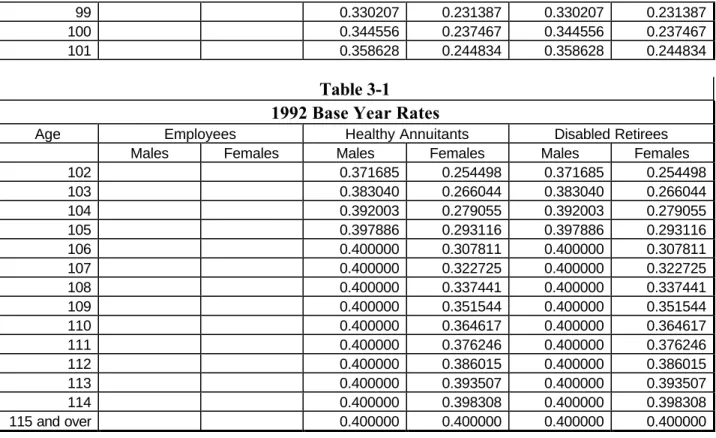
The RPEC did not find any reliable data for mortality rates over age 100. However, they agreed with the developers of the GAR-94 and UP-94 tables that the mortality curve decelerates at the older ages resulting in a limiting mortality rate below 1.00.
The rate of increase in the qxs diminishes after age 90 but the qxs are still increasing in the late 90s. The RPEC decided that there should be an upper limit to the mortality rate that would be the same for males and females and that would form a reasonable extrapolation of the rate of increase after age 95. A limiting qx of 0.4 fit these criteria. A cubic polynomial was selected for each gender such that the polynomial reproduced the value of qx at age 99 and 100 and
attained the limiting value of .4 at an age where the slope was 0, with no inflection points between age 100 and that age. This resulted in rates that hit the 0.4 limit at age 106 for males and 115 for females.
Since there was no discernible pattern of mortality rates for disabled retirees below age 45, these rates for disabled retirees from ages 21 to 44 were set equal to the rate at age 45. Other sets of data show that the mortality rates for young disabled retirees sometimes decline as age increases. However, this effect is usually related to the number of years after disability rather than age. As a result, the RPEC agreed that a table that used the same rate at all ages under 45 would be reasonable.
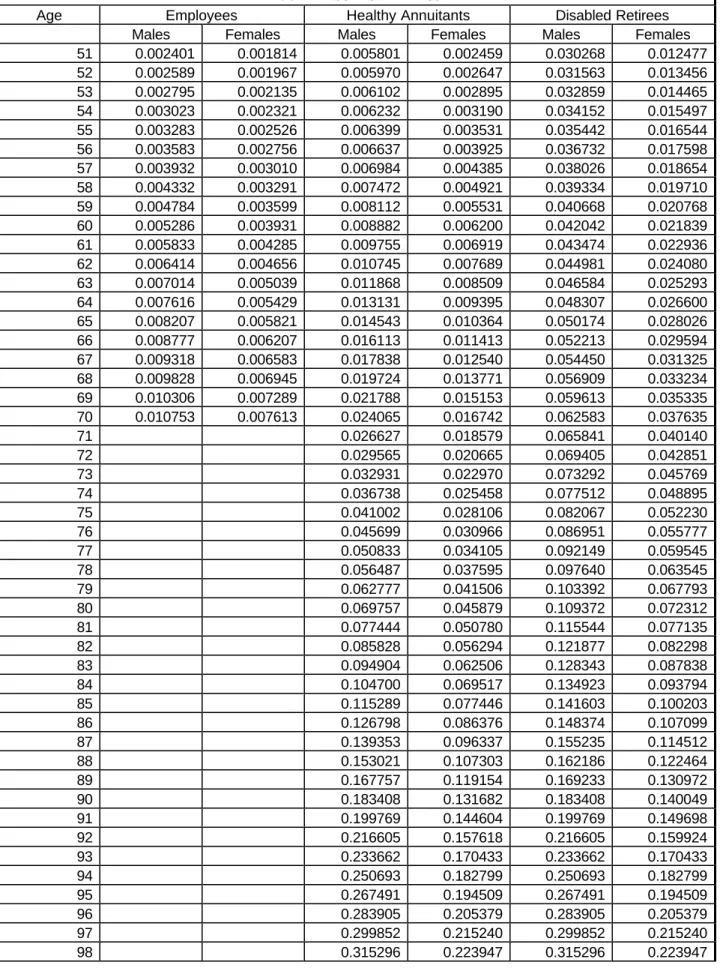
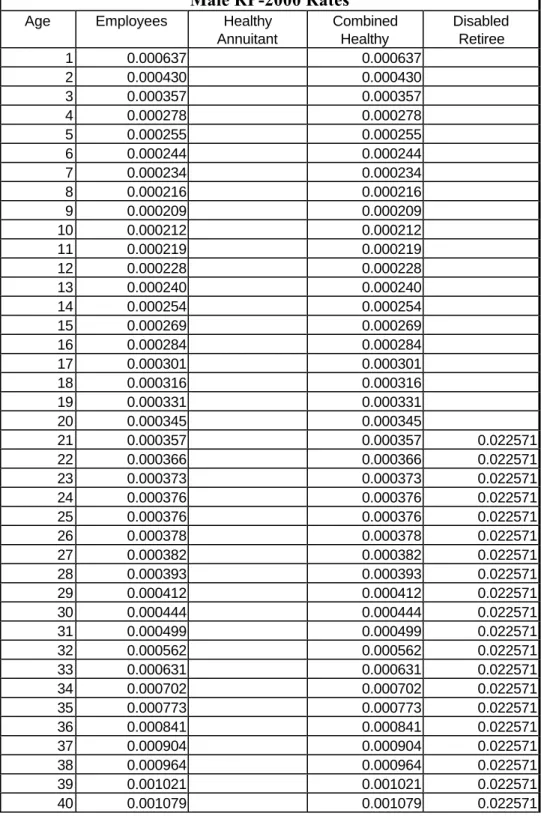
Table 3-1 1992 Base Year Rates
Age Employees Healthy Annuitants Disabled Retirees
Males Females Males Females Males Females
1 0.000637 0.000571 2 0.000430 0.000372 3 0.000357 0.000278 4 0.000278 0.000208 5 0.000255 0.000188 6 0.000244 0.000176 7 0.000234 0.000165 8 0.000216 0.000147 9 0.000209 0.000140 10 0.000212 0.000141 11 0.000219 0.000143 12 0.000228 0.000148 13 0.000240 0.000155 14 0.000254 0.000162 15 0.000269 0.000170 16 0.000284 0.000177 17 0.000301 0.000184 18 0.000316 0.000188 19 0.000331 0.000190 20 0.000345 0.000191 21 0.000357 0.000192 0.022571 0.007450 22 0.000366 0.000194 0.022571 0.007450 23 0.000373 0.000197 0.022571 0.007450 24 0.000376 0.000201 0.022571 0.007450 25 0.000376 0.000207 0.022571 0.007450 26 0.000378 0.000214 0.022571 0.007450 27 0.000382 0.000223 0.022571 0.007450 28 0.000393 0.000235 0.022571 0.007450 29 0.000412 0.000248 0.022571 0.007450 30 0.000444 0.000264 0.022571 0.007450 31 0.000499 0.000307 0.022571 0.007450 32 0.000562 0.000350 0.022571 0.007450 33 0.000631 0.000394 0.022571 0.007450 34 0.000702 0.000435 0.022571 0.007450 35 0.000773 0.000475 0.022571 0.007450 36 0.000841 0.000514 0.022571 0.007450 37 0.000904 0.000554 0.022571 0.007450 38 0.000964 0.000598 0.022571 0.007450 39 0.001021 0.000648 0.022571 0.007450 40 0.001079 0.000706 0.022571 0.007450 41 0.001142 0.000774 0.022571 0.007450 42 0.001215 0.000852 0.022571 0.007450 43 0.001299 0.000937 0.022571 0.007450 44 0.001397 0.001029 0.022571 0.007450 45 0.001508 0.001124 0.022571 0.007450 46 0.001629 0.001223 0.023847 0.008184 47 0.001762 0.001326 0.025124 0.008959 48 0.001905 0.001434 0.026404 0.009775
49 0.002060 0.001550 0.027687 0.010634 50 0.002225 0.001676 0.005566 0.002344 0.028975 0.011535
Table 3-1 1992 Base Year Rates
Age Employees Healthy Annuitants Disabled Retirees
Males Females Males Females Males Females
51 0.002401 0.001814 0.005801 0.002459 0.030268 0.012477 52 0.002589 0.001967 0.005970 0.002647 0.031563 0.013456 53 0.002795 0.002135 0.006102 0.002895 0.032859 0.014465 54 0.003023 0.002321 0.006232 0.003190 0.034152 0.015497 55 0.003283 0.002526 0.006399 0.003531 0.035442 0.016544 56 0.003583 0.002756 0.006637 0.003925 0.036732 0.017598 57 0.003932 0.003010 0.006984 0.004385 0.038026 0.018654 58 0.004332 0.003291 0.007472 0.004921 0.039334 0.019710 59 0.004784 0.003599 0.008112 0.005531 0.040668 0.020768 60 0.005286 0.003931 0.008882 0.006200 0.042042 0.021839 61 0.005833 0.004285 0.009755 0.006919 0.043474 0.022936 62 0.006414 0.004656 0.010745 0.007689 0.044981 0.024080 63 0.007014 0.005039 0.011868 0.008509 0.046584 0.025293 64 0.007616 0.005429 0.013131 0.009395 0.048307 0.026600 65 0.008207 0.005821 0.014543 0.010364 0.050174 0.028026 66 0.008777 0.006207 0.016113 0.011413 0.052213 0.029594 67 0.009318 0.006583 0.017838 0.012540 0.054450 0.031325 68 0.009828 0.006945 0.019724 0.013771 0.056909 0.033234 69 0.010306 0.007289 0.021788 0.015153 0.059613 0.035335 70 0.010753 0.007613 0.024065 0.016742 0.062583 0.037635 71 0.026627 0.018579 0.065841 0.040140 72 0.029565 0.020665 0.069405 0.042851 73 0.032931 0.022970 0.073292 0.045769 74 0.036738 0.025458 0.077512 0.048895 75 0.041002 0.028106 0.082067 0.052230 76 0.045699 0.030966 0.086951 0.055777 77 0.050833 0.034105 0.092149 0.059545 78 0.056487 0.037595 0.097640 0.063545 79 0.062777 0.041506 0.103392 0.067793 80 0.069757 0.045879 0.109372 0.072312 81 0.077444 0.050780 0.115544 0.077135 82 0.085828 0.056294 0.121877 0.082298 83 0.094904 0.062506 0.128343 0.087838 84 0.104700 0.069517 0.134923 0.093794 85 0.115289 0.077446 0.141603 0.100203 86 0.126798 0.086376 0.148374 0.107099 87 0.139353 0.096337 0.155235 0.114512 88 0.153021 0.107303 0.162186 0.122464 89 0.167757 0.119154 0.169233 0.130972 90 0.183408 0.131682 0.183408 0.140049 91 0.199769 0.144604 0.199769 0.149698 92 0.216605 0.157618 0.216605 0.159924 93 0.233662 0.170433 0.233662 0.170433 94 0.250693 0.182799 0.250693 0.182799 95 0.267491 0.194509 0.267491 0.194509 96 0.283905 0.205379 0.283905 0.205379 97 0.299852 0.215240 0.299852 0.215240 98 0.315296 0.223947 0.315296 0.223947
99 0.330207 0.231387 0.330207 0.231387
100 0.344556 0.237467 0.344556 0.237467
101 0.358628 0.244834 0.358628 0.244834
Table 3-1 1992 Base Year Rates
Age Employees Healthy Annuitants Disabled Retirees
Males Females Males Females Males Females
102 0.371685 0.254498 0.371685 0.254498 103 0.383040 0.266044 0.383040 0.266044 104 0.392003 0.279055 0.392003 0.279055 105 0.397886 0.293116 0.397886 0.293116 106 0.400000 0.307811 0.400000 0.307811 107 0.400000 0.322725 0.400000 0.322725 108 0.400000 0.337441 0.400000 0.337441 109 0.400000 0.351544 0.400000 0.351544 110 0.400000 0.364617 0.400000 0.364617 111 0.400000 0.376246 0.400000 0.376246 112 0.400000 0.386015 0.400000 0.386015 113 0.400000 0.393507 0.400000 0.393507 114 0.400000 0.398308 0.400000 0.398308 115 and over 0.400000 0.400000 0.400000 0.400000
Chapter 4 - RP-2000 Tables
Projection to 2000
The rates of Table 3-1 were projected to 2000 based on a review of three sets of data. These were Social Security data, federal retiree data, and the study data.
The RPEC analyzed the data Social Security actuaries used to prepare Actuarial Study 110, “Social Security Area Population Projections 1996” from the Office of the Actuary of the Social Security Administration (SSA) 1. Mortality rates by gender and five-year age groups
through 1994 were available. The RPEC used the Social Security data covering 1990 to 1994 because that was the subset of rates that centered on 1992, the mid-year of the experience period, and ended with 1994, the latest year in the data set.
The Federal Office of Personnel Management (OPM) provided mortality experience for Federal Civil Service annuitants through 1996. These data have the advantages of spanning a long time period and containing a large number of exposures confined to pension plan
participants only. The RPEC used the Federal Civil Service data covering 1988 to 1996 because that was the subset of rates that centered on 1992, the mid-year of the experience period, and ended with 1996, the latest year in the data set.
The RPEC analyzed the data collected for this study for trends in mortality rates for employees, beneficiaries, and healthy retirees separately, as well as all data combined, including only data for plans that submitted data for all five years. There were not sufficient consistent data to analyze trends for disabled retirees. The subset of study data that encompassed all years from 1990 through 1994 was approximately 8,000,000 exposures.
Even for very large data sets, such as Social Security data, clear mortality trends are difficult to observe from raw year-to-year data. To better observe the trends, the RPEC calculated least-squares regression lines through the logarithms of the raw mortality rates by year for each quinquennial age group for each gender for each data set. The best-fit log-linear mortality improvement trends were calculated using the slopes of these regression lines. For each regression line, the best-fit log-linear mortality improvement trend equals one minus the antilog of the slope.
Tables 4-1 and 4-2 compare the best-fit log-linear mortality improvement trends by data source. These tables compare recent mortality improvement from the data collected for this study on employees and healthy annuitants combined (1990-1994), from Social Security data (1990-1994), and from Federal Civil Service data (1988-1996). For illustrative purposes, these tables also include the comparable factors used to construct the GAR-94 table. As with the current study, the
1Death rates for ages under 65 were calculated using the number of deaths as tabulated in Vital
Statistics of the United States and using the latest census estimates of the population. For ages 65 and over, records of the Medicare program were used to determine the rates by age and gender.
developers of the GAR-94 table determined that there was a difference between the short-term projection trends needed to bring the table to the date of publication and the longer-term trends needed to project the table beyond the date of publication.
Table 4-1
Annualized Recent Mortality Improvement Trends Male Age Study Data 1990-1994 Social Security 1990-1994 Federal Civil Service 1988-1996 GAM 88-94 20-24 0.31% 1.70% 25-29 -1.07% 0.99% -0.10% 30-34 4.83% -1.58% -1.00% 35-39 2.15% -1.41% 0.70% 40-44 -1.78% -2.85% 1.90% 45-49 2.01% 0.06% 1.70% 50-54 3.63% 0.47% 1.80% 55-59 4.48% 1.83% 1.13% 1.80% 60-64 2.45% 1.26% 1.72% 1.80% 65-69 1.50% 0.96% 0.93% 1.20% 70-74 0.75% 1.06% 1.22% 1.70% 75-79 1.10% 1.08% 1.59% 2.30% 80-84 0.32% 0.47% 1.43% 1.80% 85-89 0.18% -0.49% 0.78% 1.30% 90-94 -0.81% -0.82% 0.41% 0.70%
Study Data: Best-fit log-linear mortality improvement for 1990 to 1994 from combined healthy data from study.
Social Security: Best-fit log-linear mortality improvement for 1990 to 1994 from data supplied by Social Security used to prepare Actuarial Study 110 for all employees and retirees.
Federal Civil Service: Best-fit log-linear mortality improvement for graduated mortality tables for 1988 to 1996 based on healthy retirees.
Table 4-2
Annualized Recent Mortality Improvement Trends Female Age Study Data 1990-1994 Social Security 1990-1994 Federal Civil Service 1988-1996 GAM 88-94 20-24 0.21% 1.60% 25-29 13.88% -0.59% 0.90% 30-34 -15.60% -1.24% 0.50% 35-39 -7.51% -2.19% 0.80% 40-44 -1.66% -1.42% 1.30% 45-49 -4.61% 0.56% 1.90% 50-54 -5.72% 0.94% 0.80% 55-59 5.27% 1.09% 0.92% 0.80% 60-64 -3.23% 0.49% 0.10% 0.00% 65-69 0.38% -0.07% 0.44% 0.70% 70-74 -1.00% 0.06% 1.07% 2.00% 75-79 -0.93% -0.13% 1.10% 1.50% 80-84 -0.24% -0.30% 0.64% 1.00% 85-89 -1.25% -0.49% 0.30% 0.90% 90-94 0.15% -0.47% 0.08% 0.90%
Study Data: Best-fit log-linear mortality improvement for 1990 to 1994 from combined healthy data from study.
Social Security: Best-fit log-linear mortality improvement for 1990 to 1994 from data supplied by Social Security used to prepare Actuarial Study 110 for all employees and retirees.
Federal Civil Service: Best-fit log-linear mortality improvement for graduated mortality tables for 1988 to 1996 based on healthy retirees.
GAM 88-94: Factors used to project GAR-94 tables from 1988 to 1994.
The five-year age groupings did not produce a pattern that could be directly applied to a graduated mortality table. However, it did enable the RPEC to develop a general pattern of mortality to project results from the mid-year of the experience, 1992, to the date of the table, 2000.
Measurement of mortality improvement requires voluminous, consistent data covering many years. While interesting, the study data were not subjected to the rigorous, consistent
methodology applied by SSA and OPM in the tracking of mortality trends. The study data also were not consistently submitted for all five years and even many of those plans that did have five years of data had sharp differences in exposure through the period. Therefore, the basis for selecting mortality improvement focussed on the Social Security and Federal Civil Service data. Mortality improvement trends for males from age 55 through age 80 for Social Security and Federal Civil Service were all significantly positive. Trends for males at other ages and trends for females at all ages produced mixed results including many negative and insignificant trends. The RPEC decided to use trends only for male employees and male healthy retirees.
The average improvement trend for males between ages 55 and 80 was close to 1.0 percent a year for the Social Security and Federal Civil Service data. The RPEC selected an annual