OBSERVATIONAL STUDY OF CELL PHONE AND TEXTING USE
AMONG CALIFORNIA DRIVERS 2015 AND COMPARISON TO
2011 THROUGH 2014 DATA
METHODOLOGICAL AND ANALYSIS REPORT
Conducted on Behalf of
The California Office of Traffic Safety
The Safe Transportation Research and Education Center -
University of California, Berkeley
2015 Ewald & Wasserman California Distracted Driving Study Report Page 2
TABLE OF CONTENTS
I. SUMMARY ... 3
Demographic characteristics of drivers and comparison to previous waves ... 3
Overall electronic device use and distracted driving due to electronic devices variable ... 3
Distracted driving due to electronic devices by gender, location, and age of driver ... 3
Distracted driving due to electronic devices by time of observation ... 3
Distracted driving due to electronic devices by age ... 3
Distracted driving due to electronic devices by region variable ... 3
Distracted driving due to electronic devices by presence of children, passenger and vehicle characteristics ... 4
II. INTRODUCTION ... 5
III. METHODS ... 6
A. Sample Methodology and Sample Site Selection ... 6
B. Observation Locations, Times, and Duration ... 9
C. Staff Training ... 9
Training procedures and pre-testing of observation form ... 9
D. Study Outcomes ... 10
Time frames of data collection and comparison to previous waves ... 10
Data site definitions and comparison to previous waves ... 11
Demographic characteristics of drivers and comparison to previous waves ... 11
IV. RESULTS ... 14
A. Statewide Results on Distracted Driving Due to Electronic Device Use ... 14
Overall electronic device use and distracted driving due to electronic devices variable ... 14
Distracted driving due to electronic devices by gender, location, and age of driver ... 15
Distracted driving due to electronic devices by time of observation ... 16
Distracted driving due to electronic devices by geography and age ... 16
B. Countywide and Regional Results on Distracted Driving ... 19
Overall electronic device use and distracted driving due to electronic devices variable by county ... 19
Distracted driving due to electronic devices by presence of children and passenger and vehicle characteristics ... 20
Distracted driving due to electronic devices combined with observation categories ... 21
Notes on Limitations ... 23 APPENDICES:
Appendix A: Observation Form
Appendix B:...………Hands Free Estimate Methodology Appendix C:...………Letter
2015 Ewald & Wasserman California Distracted Driving Study Report Page 3
I. SUMMARY
Demographic characteristics of drivers and comparison to previous waves
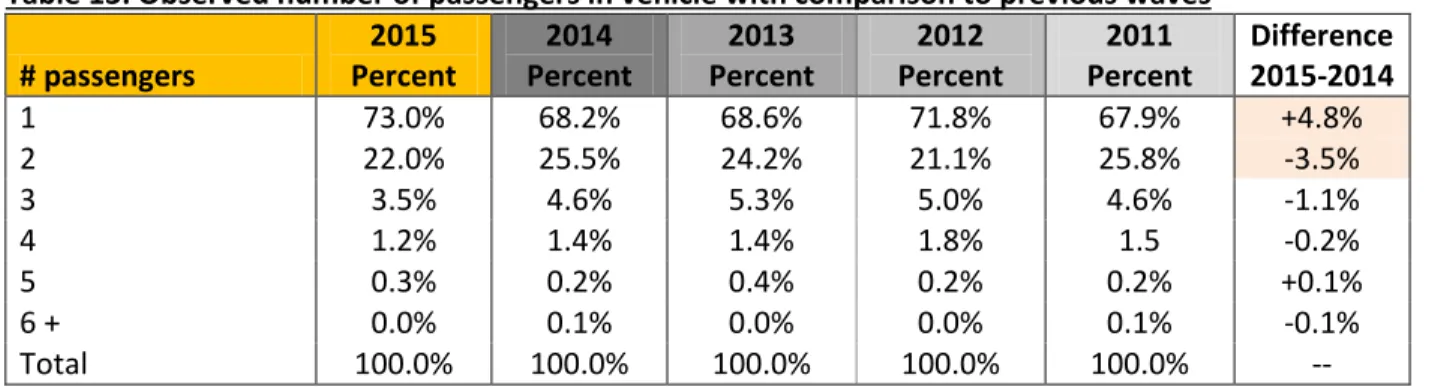
In the 2015 observations, the majority of drivers (73.0%) drove alone, and 22.0% had one passenger in the car. The increase of drivers driving alone since 2014 (4.8%) and the decrease (3.5%) of drivers driving with one passenger is significant (Table 13).
Overall electronic device use and distracted driving due to electronic devices variable
In total, 5.4% of all observed drivers displayed distracted driving due to device use, compared to 3.8% in 2014, a significant increase of 1.6% (Table 16).
Compared to 2014, holding a phone to the ear significantly increased by 0.6%, the use of
headsets/Bluetooth devices increased significantly by 0.5%, and manipulating a hand-held device while driving increased significantly by 1.1% (Table 17).
Distracted driving due to electronic devices by gender, location, and age of driver
There is no significant difference between males and females in the rate of distracted driving, but there is a 1.7% significant increase of male driver device use compared to 2014 (Table 18).
The difference in device use among the areas defined as rural, urban, or suburban is significant, with the highest observed device use in suburban areas (7.3%) and the lowest in rural areas (3.7%). Compared to 2014, the increase of electronic device use while driving was significantly higher in suburban areas (a 2.7% increase, Table 19).
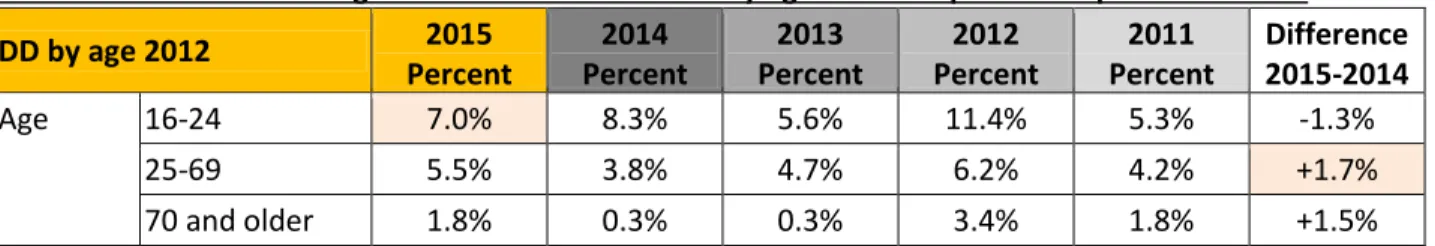
Overall, younger drivers are displaying significantly more electronic device use, with 7.0% of all 16-24-year-olds displaying this behavior. There is also a notable increase in the device use in all age groups since 2014, with a significant increase of 1.7% for 25-69-year-old drivers (Table 21).
Distracted driving due to electronic devices by time of observation
Distracted driving due to electronic devices use by time of observation does not show any significant differences among the rush hour, weekend, and all other times of data collection. The 1.8% increase in electronic device use since 2014 during rush hour as well as the 1.6% increase at other times except weekends is significant (Table 23).
Distracted driving due to electronic devices by age
In 2015, there is a significantly higher rate of 16-24-year-olds being observed holding a phone to their ear while driving (3.5%) compared to the other age groups (Table 24).
In comparison to the 2014 data, there is a significant 3.7% decrease among 16-24-year-olds in the manipulation of electronic devices while driving. At the same time, there is a significant increase in the observed manipulation of hand-held devices among 25-69-year-old drivers of 1.5% since 2015 (Table 24).
Distracted driving due to electronic devices by region variable
The region variable—North, South, and Central California—and the observation of drivers talking on a headset or Bluetooth device shows significant differences with a lower observation rate among Central region drivers (Table 30).
The increase of headset or Bluetooth use in Southern California by 0.7% compared to 2014 is significant as well (Table 30).
2015 Ewald & Wasserman California Distracted Driving Study Report Page 4
Distracted driving due to electronic devices by presence of children, passenger and vehicle
characteristics
Overall, there are significant differences in the incidence of distracted driving and the number of passengers in the car. Of drivers alone in a car, 6.2% were observed using an electronic device while driving; that percentage is reduced with more passengers in the vehicle (Table 33).
There has also been a significant 1.8% increase in instances of distracted driving due to device use for drivers alone in the car (Table 33).
Compensation for Difficulty in Observing Hands-Free Cell Phone Use
Use of hands-free devices is difficult to identify in observational studies because the device may not be visible to the observer. Consequently, "Talking with headset/Bluetooth" is likely to be underestimated at the observed level of 1.4% in 2015. The National Highway Traffic Safety Administration (NHTSA) has developed a methodology to correct for this difficulty.1 The correction raises the hands-free usage from 1.7% to 3.3%, and the overall cell phone usage rate from 7.3% to 9.2% (see also Appendix B).
1
2015 Ewald & Wasserman California Distracted Driving Study Report Page 5
II. INTRODUCTION
This methodological and analysis report outlines the procedures and findings for the fifth annual wave of the “Observational Survey of Cell Phone and Texting Use among California Drivers Study,” conducted by Ewald & Wasserman Research Consultants (E&W) on behalf of the California Office of Traffic Safety (OTS) and the Safe Transportation Research and Education Center (SafeTREC) at the University of California, Berkeley.
This combined report describes E&W’s survey research and data collection procedures implemented for the fifth wave of this longitudinal study, which collected data of a statistically representative sample on drivers’ distracted driving behaviors, including cell phone and other electronic device use.
The overall study design included the observation of California vehicle drivers at controlled intersections
-such as traffic lights and stop signs-using a data collection protocol similar to the National Occupancy Protection Use Study (NOPUS) methodology published by the National Highway Transportation Safety Administration (NHTSA) on electronic device use by drivers in their Traffic Safety Facts publications, DOT HS 811 372 and DOT HS 811 361. The data collection plan also incorporated sections of the
methodological outline of the Seat Belt Survey Regulation for Section 157 Surveys: 23CRF Part 1340, published by NHTSA.
2015 Ewald & Wasserman California Distracted Driving Study Report Page 6
III. METHODS
A. Sample Methodology and Sample Site Selection
The counties and sites included for site visits were the same as in the preceding waves of data collection. The original study sample frame was created in a multi-stage proportional random site selection based on the Daily Vehicle Miles Traveled (DVMT) on California roadways, using DVMT by county as the primary sampling units. The DVMT information was derived from the California Department of Transportation’s Highway Performance Monitoring System (HPMS) 2013 California Public Road Data. Tables listing the maintained daily vehicle miles traveled by jurisdictions and by county were summarized to create the overall main sample frame for the site selection.
In the first step of sample preparation, all ineligible jurisdictions (areas not open to the public, with limited access, or no roadways) were removed from the sample frame. The updated list of ineligible jurisdictions can be found in Table 1. All remaining jurisdictions were deemed eligible and included city jurisdictions, highways, and unincorporated land and were broken down by county.
Table 1. List of ineligible jurisdictions
Army Corps of Engineers State Department of Water Resources
Bureau of Indian Affairs State Forestry Service
Department of Defense State Park Services
Department of Energy U.S. Army
Golden Gate Bridge University of California
Indian Tribal Nation U.S. Bureau of Reclamation
National Park Service U.S. Fish & Wildlife Service
Port of Oakland U.S. Forest Service
San Diego Unified Port District U.S. Navy
U.S. MARINE CORPS
After removing ineligible jurisdictions, all counties in the State of California accounting for less than 1.0% each of the total DVMT in the State were excluded. In this process, ten of California’s 58 counties were removed, leaving the sample frame with counties and jurisdictions accounting for 99.2% of the total California DVMT. The ten excluded counties, which accounted for 0.8% of all DVMT in the state, were:
Amador Calaveras Plumas Mono Del Norte Modoc Trinity Mariposa Sierra Alpine
In the following step, a random selection of counties was included in the sample frame; the proportion determining inclusion was calculated based on the DVMT per county. For the eligible 48 counties and jurisdictions, a sample interval was created based on a target of 17 counties, a number defined by the original NOPUS design, which served as the random value for the first stage of site inclusion. All counties with a DVMT larger than the random value were automatically included in the sample frame due to their size and were excluded from the subsequent random selection list. These five counties included: Los Angeles, Riverside, San Bernardino, San Diego, and Orange counties. They accounted for 53.6% of all DVMT in the State of California.
The remaining 12 sites to be selected were pulled in a proportional randomized design which increased the probability of inclusion in the sample frame for counties with a higher DVMT volume. The final list of
2015 FINAL Ewald & Wasserman California Distracted Driving Study Report Page 6
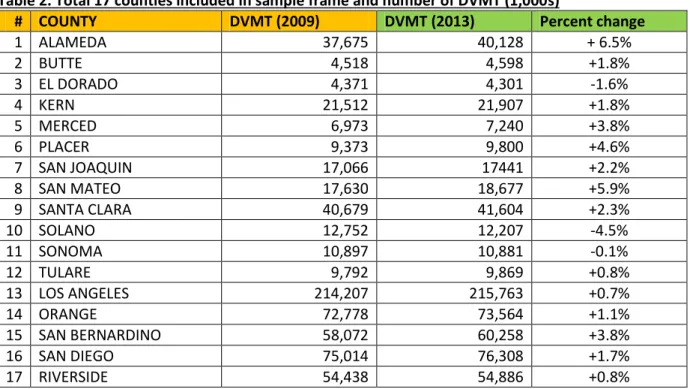
counties selected, together with their updated 2013 DVMT (in 1,000s), is shown in Table 2. This table also included the differences between the 2009 and 2013 DVMT by percentage, which did not affect the overall number of sites selected.
Table 2. Total 17 counties included in sample frame and number of DVMT (1,000s)
# COUNTY DVMT (2009) DVMT (2013) Percent change
1 ALAMEDA 37,675 40,128 + 6.5% 2 BUTTE 4,518 4,598 +1.8% 3 EL DORADO 4,371 4,301 -1.6% 4 KERN 21,512 21,907 +1.8% 5 MERCED 6,973 7,240 +3.8% 6 PLACER 9,373 9,800 +4.6% 7 SAN JOAQUIN 17,066 17441 +2.2% 8 SAN MATEO 17,630 18,677 +5.9% 9 SANTA CLARA 40,679 41,604 +2.3% 10 SOLANO 12,752 12,207 -4.5% 11 SONOMA 10,897 10,881 -0.1% 12 TULARE 9,792 9,869 +0.8% 13 LOS ANGELES 214,207 215,763 +0.7% 14 ORANGE 72,778 73,564 +1.1% 15 SAN BERNARDINO 58,072 60,258 +3.8% 16 SAN DIEGO 75,014 76,308 +1.7% 17 RIVERSIDE 54,438 54,886 +0.8%
In a subsequent step of the proportional random selection, the actual sites within each selected county were determined. The secondary sampling unit consisted of either: city or town jurisdictions,
unincorporated land, or State Highway jurisdictions. Using a proportional cell selection method, jurisdictions with higher volumes of DVMT had a higher probability to be included in the sample frame. This procedure resulted in 130 sites in the selected 17 counties (Table 3).
Table 3. List of sites per county
COUNTY JURISDICTION Total
ALAMEDA COUNTY (UNINCORP.) 4
LIVERMORE 1
OAKLAND 3
STATE HIGHWAYS 3
ALAMEDA Total 11
BUTTE STATE HIGHWAYS 1
BUTTE Total 1
EL DORADO STATE HIGHWAYS 1
EL DORADO Total 1
KERN BAKERSFIELD 1
COUNTY (UNINCORP.) 4
STATE HIGHWAYS 1
KERN Total 6
COUNTY JURISDICTION Total
ORANGE ANAHEIM 1 BREA 1 BUENA PARK 1 COSTA MESA 1 COUNTY (UNINCORP.) 1 GARDEN GROVE 1 HUNTINGTON BEACH 3 LA HABRA 1 SANTA ANA 3 SEAL BEACH 1 TUSTIN 1 ORANGE Total 15
MERCED COUNTY (UNINCORP.) 2
MERCED 1
STATE HIGHWAYS 4
2015 FINAL Ewald & Wasserman California Distracted Driving Study Report Page 7
Table 3. List of sites per county (continued)
COUNTY JURISDICTION Total
LOS ANGELES ALHAMBRA 1
ARCADIA 1 BALDWIN PARK 1 BEVERLY HILLS 1 COUNTY (UNINCORP.) 1 GARDENA 1 GLENDORA 1 HAWTHORNE 1 INDUSTRY 1 LA CANADA-FLINTRIDGE 1 LANCASTER 1 LAWNDALE 1 LONG BEACH 1 LOS ANGELES 1 MONROVIA 1 PASADENA 1 POMONA 1 REDONDO BEACH 1 SANTA CLARITA 1 SANTA MARINO 1 SOUTH GATE 2 STATE HIGHWAYS 1 TORRANCE 1
LOS ANGELES Total 24
PLACER COUNTY (UNINCORP.) 1
ROSEVILLE 2 STATE HIGHWAYS 3 PLACER Total 6 RIVERSIDE BLYTHE 1 CORONA 1 COUNTY (UNINCORP.) 1 INDIAN WELLS 1 MORENO VALLEY 1 PALM DESERT 2 RIVERSIDE 1 STATE HIGHWAYS 2 TEMECULA 1 RIVERSIDE Total 11
SAN BERNARDINO CHINO 3
COUNTY (UNINCORP.) 1 FONTANA 1 HESPERIA 1 ONTARIO 1 REDLANDS 1 STATE HIGHWAYS 1 VICTORVILLE 2
SAN BERNARDINO Total 11
COUNTY JURISDICTION Total
SAN DIEGO CARLSBAD 1
CHULA VISTA 1 COUNTY (UNINCORP.) 3 EL CAJON 1 OCEANSIDE 2 POWAY 1 SAN DIEGO 2 STATE HIGHWAYS 1
SAN DIEGO Total 12
SAN JOAQUIN STATE HIGHWAYS 4
STOCKTON 1
SAN JOAQUIN Total 5
SAN MATEO COUNTY (UNINCORP.) 1
SAN MATEO 1
STATE HIGHWAYS 2
SAN MATEO Total 4
SANTA CLARA COUNTY (UNINCORP.) 3
CUPERTINO 1
SAN JOSE 2
STATE HIGHWAYS 2
SANTA CLARA Total 8
SOLANO COUNTY (UNINCORP.) 1
FAIRFIELD 1
VALLEJO 1
SOLANO Total 3
SONOMA SANTA ROSA 1
STATE HIGHWAYS 1
SONOMA Total 2
TULARE COUNTY (UNINCORP.) 2
TULARE 1
TULARE Total 3
2015 Ewald & Wasserman California Distracted Driving Study Report Page 8
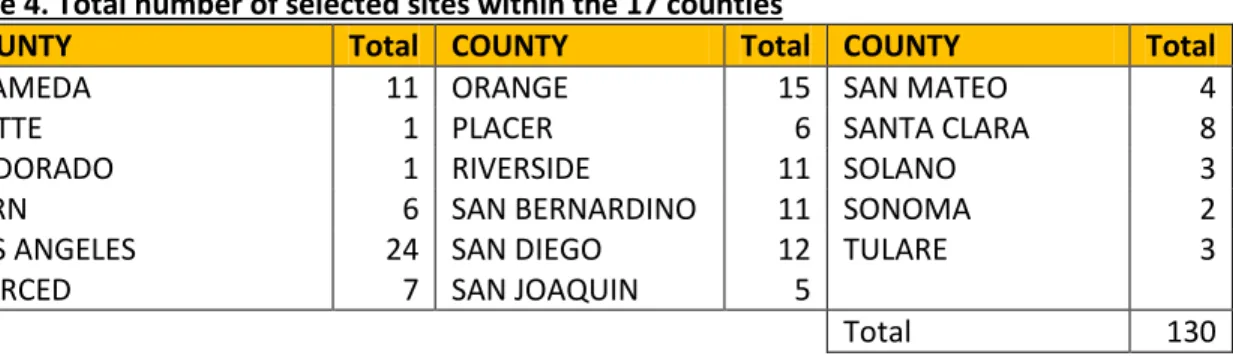
Table 4 shows the final list of selected counties and the number of selected sites within each county.
Table 4. Total number of selected sites within the 17 counties
COUNTY Total COUNTY Total COUNTY Total
ALAMEDA 11 ORANGE 15 SAN MATEO 4
BUTTE 1 PLACER 6 SANTA CLARA 8
EL DORADO 1 RIVERSIDE 11 SOLANO 3
KERN 6 SAN BERNARDINO 11 SONOMA 2
LOS ANGELES 24 SAN DIEGO 12 TULARE 3
MERCED 7 SAN JOAQUIN 5
Total 130
Of the 130 selected observation sites, 27 were highway sites and 25 were unincorporated land sites, all others were surface streets with controlled intersections. For the highway sites, only controlled exit ramps with either a stop sign or a traffic light were included. For the unincorporated sites, the controlled
intersection closest to the geographically determined site was selected.
After the selection of jurisdictions within each county, each site was pinpointed geographically, using mapping software. For jurisdiction sites with defined boundaries and where information on boundaries was available for the software, a random site selector was used to select a site within a defined area. For this process, the software created a random number stream based on the x- and y-axis of the jurisdiction boundaries, which were partitioned into polygons using a standard partitioning algorithm. Polygons were further geospatially partitioned into triangles of varying sizes. A number stream created two random numbers based on the axis length of the triangle, thus ensuring that the larger the target area, the higher the probability of selection. For geographic sites with limited geospatial information, a similar but manual process was employed, which determined the outer boundaries of the jurisdiction, the latitude and longitude of the area, and then randomly created a latitude and longitude number set for the target geographic area. The electronic maps used for this purpose were overlaid with a meter grid reference system (MGRS) to produce a grid layer of 1,000 x 1,000 meters and all selected locations were placed in the exact middle of that square kilometer.
During the first wave and original site definition, the final site selected was confirmed using Google Earth to ensure that a) an eligible roadway existed and b) it had an intersection or highway exit ramp that was controlled and eligible for data collection. Sites that did not qualify or those that could not be accessed safely by a field observer for their targeted 45-minute observation period were re-selected by either selecting the opposite side of the intersection, or, for highway exit ramps, selecting the exit ramp for traffic from the opposite travel direction.
For the fifth wave of the Observational Study of Cell Phone and Texting Use among California Drivers, the same site locations as those in the previous waves were selected. Minor differences to the original data collection locations occurred, mainly due to some exit ramps being reconfigured from a stop sign to a yield sign. Since the site had to be controlled, the next qualifying exit ramp of the same site was selected. Monitoring of the number of observations between the current and last wave identified any outlying
differences in traffic volume. These sites were flagged and the location re-visited at another time to confirm long-term changes in traffic volume and to avoid biases as a result of temporary traffic changes.
2015 Ewald & Wasserman California Distracted Driving Study Report Page 9
B. Observation Locations, Times, and Duration
Field observations were conducted between February 21, 2015, and April 6, 2015, within the same time frame as previous waves. A team of five E&W Field Observers based out of the San Francisco Bay Area, Los Angeles, and San Diego visited all 130 sample frame sites. Observation times ranged from 7:00 a.m. to 5:50 p.m. during non-rainy days during daylight hours and included weekdays as well as weekends. All staff were rigorously trained in the methodology and protocols and assigned defined location sites where they would conduct the 45-minute observation. The field observers were monitored and managed by the E&W Project Manager throughout the study period.
The Southern California team visited San Bernardino, San Diego, Riverside, Orange, Kern, and Los Angeles counties. The Bay Area team in Northern California was assigned Alameda, Butte, El Dorado, Merced, Placer, San Joaquin, San Mateo, Santa Clara, Solano, Sonoma, and Tulare counties for their data collection routes. For data collection sites that produced no vehicle traffic in the allocated time frame, as well as those that showed a substantial difference to the previous year data, staff re-visited the sites within the time frame defined in the sample frame (weekend/weekday/rush hour and other) to confirm the finding and control for outlying information.
C. Staff Training
Training procedures and pre-testing of observation form
All E&W Field Observer teams were trained in groups beginning with a formal review of the documents and forms, including a detailed review of data collection procedures and observation protocol and a rehearsal of coding categories. This was followed by a closely supervised on-site visit, a 45-minute round of test
observations, and a review of findings. The final version of the observation form can be found in Appendix A, a letter provided to staff to proof legitimacy of the study is shown in Appendix C.
All teams in the Bay Area, Los Angeles, and San Diego areas were trained in the second and third week of February 2015. The training team and Research Coordinator visited several selected sites for observation testing within each locale, practicing all aspects of data collection, including site positioning, identifying the accurate lane to code, and swift and accurate markings in the coding selections on the observation form. All observers were instructed on the coding categories in advance of the data collection, as outlined on the data collection form. During the practical training, the E&W Research Coordinator monitored all staff for accuracy and quality control.
The field observers were provided with materials including observation forms, assigned site location maps and images, a validation letter on UC Berkeley SafeTREC and OTS letterhead for respondents inquiring about the purpose of the observations, safety vests, and guidelines for procedures while in the field. The field observers also received explicit instructions on: a) locating and ensuring the accurate assigned location; b) confirming that the position and orientation of the observation direction was as specified on the detailed map for that location; and c) implementing an exact procedure for time recording, accurate lane selection, and coding accuracy.
2015 Ewald & Wasserman California Distracted Driving Study Report Page 10
D. Study Outcomes
Notes: Data differences between 2014 and 2015 observation waves are only indicated when they constitute large and/or significant differences. Any significant differences between the previous waves since 2011 can be found in their respective reports.
Statistical significance is defined as a two-tailed p value of less than p=0.05, all p values in this report are noted with two decimals. The p values less than 0.00 are noted as p=0.00.
Percentage comparison of values is calculated using the z-ratio and two-tail probabilities between assumed independent proportions.
All 17 counties were included in the sample frame and a total 5,349 observations were made. Vehicle traffic was observed in 128 out of 130 selected sites; two sites did not have any traffic and were re-visited a second time with the same outcome. One site had a change of lane observed, due to closure of the pre-selected lane. The number of observations per site ranged from 1 to 173; the average was 40 observations per site. Table 5 indicates the 17 counties with the numbers of observations per county, along with the number of observations in previous waves.
Table 5. Counties and number of observations per county with comparison to previous waves COUNTY # observations 2015 # observations 2014 # observations 2013 # observations 2012 # observations 2011 Alameda 629 478 556 483 567 Butte 23 25 28 26 21 El Dorado 83 104 80 74 40 Kern 116 110 182 134 182 Los Angeles 905 1,161 1,272 1,337 1,215 Merced 275 245 258 179 291 Orange 643 629 782 604 606 Placer 428 431 375 343 231 Riverside 202 204 203 181 289 San Bernardino 235 251 149 404 118 San Diego 461 771 824 890 553 San Joaquin 162 213 203 101 115 San Mateo 352 216 280 235 358 Santa Clara 409 488 464 459 418 Solano 130 101 101 102 78 Sonoma 71 14 41 28 164 Tulare 225 252 301 84 167 Total 5,349 5,693 6,099 5,664 5,413
Time frames of data collection and comparison to previous waves
The observational data was collected between February 21, 2015, and April 6, 2015. Data collection times ranged from 7:00 a.m. to 5:50 p.m., and included weekend days and weekdays, with a higher emphasis on data collection during morning and evening rush hours as described in the NOPUS methodology. About a third of all observations were completed during morning and evening rush hours, defined to be weekdays from 7:00 a.m. to 9:30 a.m. and from 3:30 p.m. to 5:00 p.m.
2015 Ewald & Wasserman California Distracted Driving Study Report Page 11
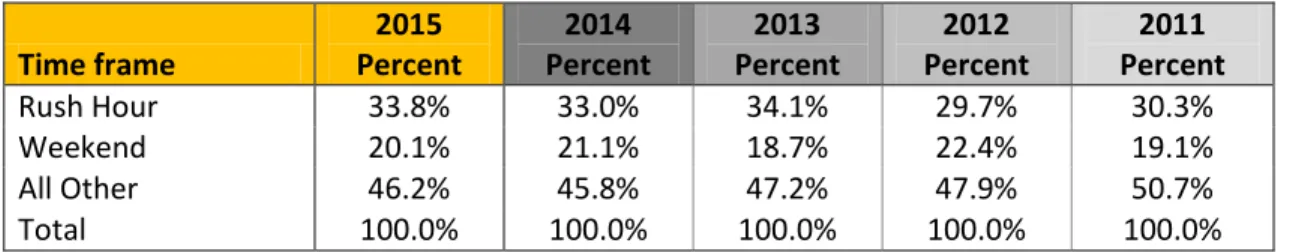
The data collection time frames of rush hour, weekend, and all other times are shown in Table 6, together with the previous waves. Similar to past years, 33.8% of all observations were collected during rush hour traffic, 20.1% on weekends, and 46.2% at all other times.
Table 6. Time points of data collection with comparison to previous waves Time frame 2015 Percent 2014 Percent 2013 Percent 2012 Percent 2011 Percent Rush Hour 33.8% 33.0% 34.1% 29.7% 30.3% Weekend 20.1% 21.1% 18.7% 22.4% 19.1% All Other 46.2% 45.8% 47.2% 47.9% 50.7% Total 100.0% 100.0% 100.0% 100.0% 100.0%
E&W also collected the exact time frame of the data observation shift for additional segmentation of the ‘rush hour’ time line as needed. However, for the purpose of this study, analysis adhered to the NOPUS methodology definition.
Data site definitions and comparison to previous waves
In total, 23.0% of all observations were made at highway exit ramps—including major California routes and freeways—and 77.0% of observations were made at controlled intersections on surface streets (Table 7).
Table 7. Road types of observations with comparison to previous waves Road type 2015 Percent 2014 Percent 2013 Percent 2012 Percent 2011 Percent
HWY exit ramp 23.0% 20.6% 21.2% 26.6% 28.8%
Surface Street 77.0% 79.4% 76.7% 72.8% 70.5%
Other 0.0% 0.0% 2.1% 0.5% 0.7%
Total 100.0% 100.0% 100.0% 100.0% 100.0%
Observation site area types assumed the three categories of rural, urban, and suburban, which were confirmed or changed by the interviewer in the field and are listed in Table 8. The rural locations
constituted 27.5% of the observations, 36.5% of observations were made at urban sites, and the remaining 36.0% observations were in suburban locations (Table 8).
Table 8. Area type of observations with comparison to previous waves Area type 2015 Percent 2014 Percent 2013 Percent 2012 Percent 2011 Percent Rural 27.5% 22.9% 24.4% 21.0% 20.6% Urban 36.5% 43.0% 46.5% 49.6% 45.4% Suburban 36.0% 34.1% 29.1% 29.4% 29.4% Total 100.0% 100.0% 100.0% 100.0% 100.0%
Demographic characteristics of drivers and comparison to previous waves
The observed age of drivers, as coded by the data collectors, is comparable to the previous waves with the majority of drivers, or 86.4%, coded as between the ages of 25 and 69, while 7.4% were ages 16-24, and 6.1% were older than 70 years (Table 9).
2015 Ewald & Wasserman California Distracted Driving Study Report Page 12
Table 9. Observed age of drivers with comparison to previous waves Age of driver 2015 Percent 2014 Percent 2013 Percent 2012 Percent 2011 Percent 16-24 7.4% 6.1% 7.6% 7.6% 8.7% 25-69 86.4% 88.5% 87.6% 87.2% 88.2% 70 and older 6.1% 5.4% 4.8% 5.2% 3.1% Total 100.0% 100.0% 100.0% 100.0% 100.0%
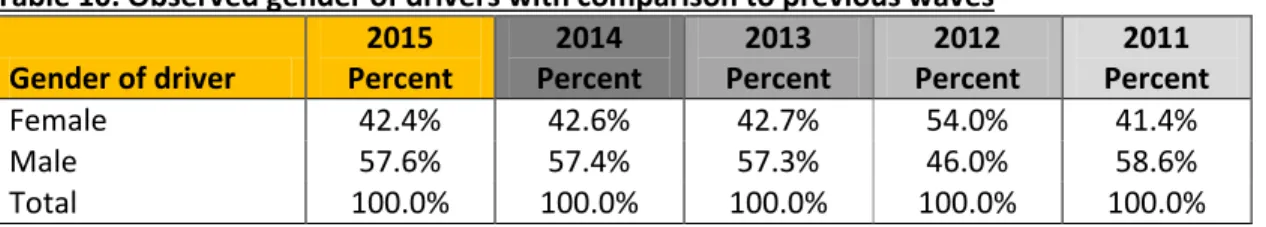
The driver gender as observed by the data collector shows a comparable distribution to the 2014 data, with 57.6 % of drivers being male and 42.4% female (Table 10).
Table 10. Observed gender of drivers with comparison to previous waves Gender of driver 2015 Percent 2014 Percent 2013 Percent 2012 Percent 2011 Percent Female 42.4% 42.6% 42.7% 54.0% 41.4% Male 57.6% 57.4% 57.3% 46.0% 58.6% Total 100.0% 100.0% 100.0% 100.0% 100.0%
The gender and age cross-tabulation in Table 11 shows the significant differences between the age and gender of drivers. Overall, more drivers were male, and among the female drivers, there was a larger percentage of younger drivers observed. Significantly more females age 16-24 were observed and significantly fewer males age 16-24 were noted (p=0.02).
Table 11. Gender and age crosstabulation
Age by gender Female Male Total
16-24 49.2% 50.8% 100.0%
25-69 41.9% 58.1% 100.0%
70+ 41.0% 59.0% 100.0%
As with all demographic attributes of drivers, the ethnicity was determined by the observer to the extent possible. The distribution is comparable to previous waves, with 52.4% of drivers coded as white, 12.5% as Asian, 4.3% as African-American, and 29.1% as Hispanic/Latino (Table 12).
Table 12. Observed ethnicity of with comparison to previous waves Ethnicity driver 2015 Percent 2014 Percent 2013 Percent 2012 Percent 2011 Percent White 52.4% 57.3% 54.6% 55.9% 57.7% African-American 4.3% 4.0% 4.1% 4.4% 3.3% Asian 12.5% 11.4% 11.1% 10.6% 11.8% Hispanic/Latino 29.1% 25.5% 28.4% 26.1% 25.7% Other 1.8% 1.8% 1.8% 3.1% 1.6% Total 100.0% 100.0% 100.0% 100.0% 100.0%
The number of passengers per vehicle is shown in Table 13 and ranged from 1 passenger (only the driver) to 6 or more passengers total (the driver plus 5 and more). The majority of drivers (73.0%) drove alone, 22.0% had one additional passenger in the car. The increase of drivers driving alone since 2014 (4.8%) is
2015 Ewald & Wasserman California Distracted Driving Study Report Page 13
Table 13. Observed number of passengers in vehicle with comparison to previous waves # passengers 2015 Percent 2014 Percent 2013 Percent 2012 Percent 2011 Percent Difference 2015-2014 1 73.0% 68.2% 68.6% 71.8% 67.9% +4.8% 2 22.0% 25.5% 24.2% 21.1% 25.8% -3.5% 3 3.5% 4.6% 5.3% 5.0% 4.6% -1.1% 4 1.2% 1.4% 1.4% 1.8% 1.5 -0.2% 5 0.3% 0.2% 0.4% 0.2% 0.2% +0.1% 6 + 0.0% 0.1% 0.0% 0.0% 0.1% -0.1% Total 100.0% 100.0% 100.0% 100.0% 100.0% --
Overall, 5.5% of observed vehicles had a passenger under the presumed age of eight, comparable to previous years (Table 14).
Table 14. Presence of children under age eight in vehicle with comparison to previous waves # children < 8 in car 2015 Percent 2014 Percent 2013 Percent 2012 Percent 2011 Percent
Yes, kid < 8 in car 5.5% 6.3% 7.0% 7.0% 5.3%
No 94.5% 93.7% 93.0% 93.0% 94.7%
Total 100.0% 100.0% 100.0% 100.0% 100.0%
The observed vehicle types are shown in Table 15, with 54.7% of all vehicles coded as passenger cars, 28.6% as vans or SUVs, and 16.6% as pickup trucks, comparable to previous waves.
Table 15. Observed vehicle type with comparison to previous waves Vehicle type 2015 Percent 2014 Percent 2013 Percent 2012 Percent 2011 Percent Passenger Car 54.7% 53.7% 52.9% 51.3% 51.5% Van or SUV 28.6% 31.2% 29.2% 32.1% 29.8% Pickup Truck 16.6% 15.2% 17.9% 16.6% 18.7% Total 100.0% 100.0% 100.0% 100.0% 100.0%
2015 Ewald & Wasserman California Distracted Driving Study Report Page 14
IV. RESULTS
A. Statewide Results on Distracted Driving Due to Electronic Device Use
Note: Due to rounding, some of the table percentages do not add up to a full 100%.
Overall electronic device use and distracted driving due to electronic devices variable
A variable “distracted driving due to electronic devices (DD)” was created based on three behaviors observed by field staff and included:
1. holding a phone to the ear,
2. manipulating a hand-held electronic device while driving, and 3. talking on a hand-held device.
Table 16 shows the percentage of driver behavior and electronic device use in all observed locations in California. Talking on a phone using a headset or Bluetooth device was NOT included in the variable created for the purpose of this evaluation. Any observed instance of the three behaviors was coded as “distracted driving due to electronic device use” in a separate variable (labelled DD). The data collection on these three driver behaviors included every instance observed and was noted as an exclusive occurrence on the
observation form. The DD variable created reflects the number of unique vehicles in which the behavior was observed; the number of unique observations of distracted behavior is higher.
In total, 5.4% of all observed drivers displayed distracted driving due to device use, compared to 3.8% in 2014. The increase of 1.6% is significant (p=0.00). At a 95% confidence level, the true percentage of the increase between both observation years lies between 0.1% and 2.2%.
Table 16. Distracted driving due to electronic devices variable with comparison to previous waves DD by device 2015 Percent 2014 Percent 2013 Percent 2012 Percent 2011 Percent Difference 2015-2014 Yes 5.4% 3.8% 4.6% 6.4% 4.2% +1.6% No 94.6% 96.2% 95.4% 93.6% 95.8% -1.6% Total 100.0% 100.0% 100.0% 100.0% 100.0% --
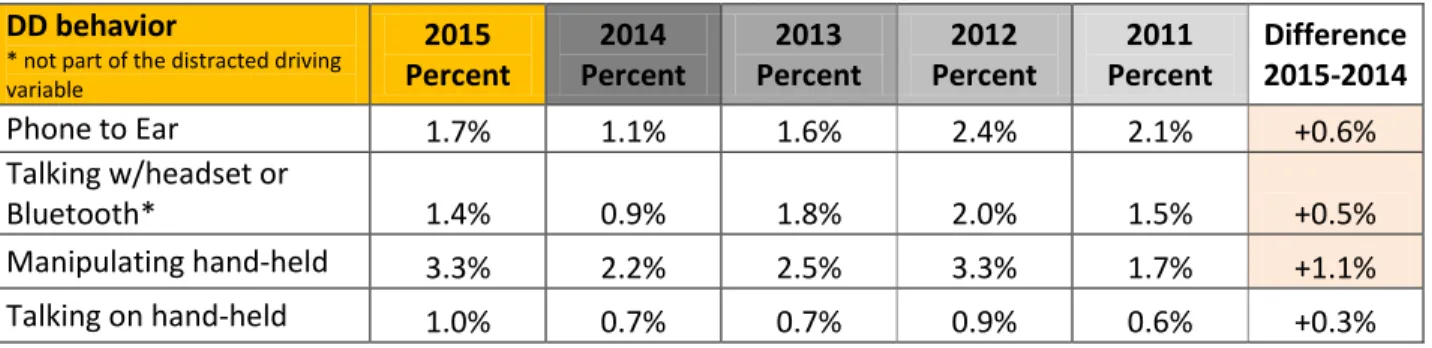
The frequencies of individual distracted driving behaviors compared with the previous waves and including the use of a headset or Bluetooth device are shown in Table 17. Holding a phone to the ear significantly increased by 0.6% since 2014 (p=0.02), the use of headsets/Bluetooth devices increased significantly by 0.5% (p=0.03), and manipulating a hand-held increased by 1.1% (significant at p=0.00).
Table 17. Frequencies of device use behaviors with comparison to previous waves DD behavior
* not part of the distracted driving variable 2015 Percent 2014 Percent 2013 Percent 2012 Percent 2011 Percent Difference 2015-2014 Phone to Ear 1.7% 1.1% 1.6% 2.4% 2.1% +0.6% Talking w/headset or Bluetooth* 1.4% 0.9% 1.8% 2.0% 1.5% +0.5% Manipulating hand-held 3.3% 2.2% 2.5% 3.3% 1.7% +1.1% Talking on hand-held 1.0% 0.7% 0.7% 0.9% 0.6% +0.3%
2015 Ewald & Wasserman California Distracted Driving Study Report Page 15
Distracted driving due to electronic devices by gender, location, and age of driver
The relationship between gender and distracted driving due to electronic device use is shown in Table 18. There is no significant difference between males and females in the rate of distracted driving. The increase of 1.7% of male driver device use compared to 2014 is significant (p=0.00).
Table 18. Distracted driving due to electronic devices by gender with comparison to previous waves
Gender 2015 Percent 2014 Percent 2013 Percent 2012 Percent 2011 Percent Difference 2015-2014 Female 5.5% 4.2% 4.8% 6.3% 4.3% +1.3% Male 5.3% 3.6% 4.4% 6.6% 4.1% +1.7% Total 5.4% 3.8% 4.6% 6.4% 4.2% --
The area types of the observations, defined as rural, urban, or suburban, cross-tabulated by the distracted driving variable are shown in Table 19. The difference in device use among the areas is significant (p=0.00) with the highest observed device use in suburban areas (7.3%) and the lowest in rural areas (3.7%). Compared to the previous year, the increase of electronic device use while driving was most markedly higher in suburban areas, with a significant 2.7% increase (p=0.00).
Table 19. Distracted driving due to electronic devices by area type with comparison to previous waves DD by area type 2015 Percent 2014 Percent 2013 Percent 2012 Percent 2011 Percent Difference 2015-2014
Area type Rural 3.7% 2.5% 4.0% 5.8% 3.6% +1.2%
Urban 4.7% 4.0% 4.3% 6.9% 4.1% +0.7%
Suburban 7.3% 4.6% 5.6% 6.0% 4.7% +2.7%
The relationship between the area type and the use of Bluetooth or a headset shows a larger increase in urban areas (Table 20). While the difference among areas in the 2015 observations is not significant, the increase in Bluetooth or headset use in urban areas compared to 2014 is significant (0.8%, p=0.01).
Table 20. Area type by talking on headset or Bluetooth with comparison to previous waves Bluetooth/headset by area type 2015 Percent 2014 Percent 2013 Percent 2012 Percent 2011 Percent Difference 2015-2014
Area type Rural 0.9% 0.8% 2.4% 3.1% 0.9% +0.1%
Urban 1.6% 0.8% 1.2% 1.4% 1.1% +0.8%
Suburban 1.5% 1.2% 2.3% 2.4% 2.5% +0.3%
Total 1.4% 0.9% 1.8% 2.0% 1.5% --
The analysis of distracted driving due to electronic devices by age group is shown in Table 21, showing a significant (p=0.00) difference, with younger drivers displaying more electronic device use. There is also a notable increase in the device use by all age groups, with the increase of 1.7% for the 25–69-year-olds being significant (p=0.00, calculations were not made for 70 and older age group due to small sample size).
2015 Ewald & Wasserman California Distracted Driving Study Report Page 16
Table 21. Distracted driving due to electronic devices by age with comparison to previous waves
DD by age 2012 2015 Percent 2014 Percent 2013 Percent 2012 Percent 2011 Percent Difference 2015-2014 Age 16-24 7.0% 8.3% 5.6% 11.4% 5.3% -1.3% 25-69 5.5% 3.8% 4.7% 6.2% 4.2% +1.7% 70 and older 1.8% 0.3% 0.3% 3.4% 1.8% +1.5%
Distracted driving due to electronic devices by gender for the 16-24-year-old drivers did not show any significant differences between males and females. The decrease in device use of 16-24-year-olds between 2015 and 2014 is also not significant (Table 22).
Table 22. Distracted driving due to electronic devices by gender for 16-24 year-olds with comparison to previous waves DD 16-24 year-old by gender 2015 Percent 2014 Percent 2013 Percent 2012 Percent 2011 Percent Difference 2015-2014 Gender Female 6.1% 8.5% 7.1% 12.3% 4.3% -2.4% Male 7.9% 8.2% 3.8% 10.4% 4.4% -0.3%
Distracted driving due to electronic devices by time of observation
Distracted driving due to electronic devices by time of observation does not show any significant differences among the rush hour, weekend, and all other times of data collections. The 1.6% increase in electronic device use at all other times except weekends and rush hours and the 1.8% increase of device use during rush hour traffic compared to 2014 are significant (p=0.01 for both, Table 23).
Table 23. Distracted driving due to electronic devices by time of observation with comparison to previous waves DD by time 2015 Percent 2014 Percent 2013 Percent 2012 Percent 2011 Percent Difference 2015-2014
Time rush hour 5.3% 3.5% 4.7% 7.0% 3.5% +1.8%
weekend 4.1% 3.3% 4.5% 6.0% 3.1% +0.8%
all other 6.0% 4.4% 4.6% 6.3% 5.0% +1.6%
Distracted driving due to electronic devices by geography and age
The breakdown of driver age by individual distracted driving behavior due to electronic devices is shown in Table 24, along with the comparison to previous waves. In some instances, the total percentages of the individually observed behaviors add up to a higher percentage compared to Table 21 due to double-counting observed drivers who displayed more than one distracted behavior.
In the 2015 observations, there is a significantly higher rate of 16-24-year-olds holding a phone to their ear while driving (3.5%) compared to the other age groups (p=0.01).
The percentage of drivers age 70 and over (0.6%) manipulating a hand-held device in 2015 is significantly lower than among all other age groups (p=0.02, though the number of observations is very small; see also the frequencies in brackets next to percentages).
2015 Ewald & Wasserman California Distracted Driving Study Report Page 17
In comparison with the 2014 data, there is a decrease of 3.7% among 16-24-year-olds manipulating an electronic devices while driving, which is significant (p=0.03, but a small sample size). At the same time, there is a significant 1.5% increase in 25-69-year-olds manipulating hand-held devices since 2014 (p=0.00).
Table 24. Age by distracted driving behavior with comparison to previous waves Age Phone to ear
2015 Phone to ear 2014 Phone to ear 2013 Phone to ear 2012 Phone to ear 2011 16-24 3.5% (14) 0.3% (1) 1.1% (5) 4.7% 3.2% 25-69 1.5% (71) 1.3% (63) 1.7% (91) 2.2% 2.0% 70 and older 1.2% (4) 0.0% (0) 0.0% (0) 1.4% 0.6% Total 1.7% (89) 1.1% (64) 1.6% (96) 2.4% 2.1% Age Headset/ Bluetooth 2015 Headset/ Bluetooth 2014 Headset/ Bluetooth 2013 Headset/ Bluetooth 2012 Headset/ Bluetooth 2011 16-24 1.8% (7) 0.9% (3) 0.6% (3) 2.3% 2.3% 25-69 1.4% (63) 1.0% (50) 1.9% (104) 2.1% 1.5% 70 and older 1.2% (4) 0.0% (0) 0.7% (2) 1.0% 0.6% Total 1.4% (74) 0.9% (53) 1.8% (109) 2.0% 1.5% Age Manipulating hand-held 2015 Manipulating hand-held 2014 Manipulating hand-held 2013 Manipulating hand-held 2012 Manipulating hand-held 2011 16-24 3.5% (14) 7.2% (25) 4.1% (19) 6.3% 1.9% 25-69 3.5% (161) 2.0% (100) 2.5% (134) 3.1% 1.7% 70 and older 0.6% (2) 0.3% (1) 0.3% (1) 1.0% 1.2% Total 3.3% (177) 2.2% (126) 2.5% (154) 3.3% 1.7% Age Talking on hand-held 2015 Talking on hand-held 2014 Talking on hand-held 2013 Talking on hand-held 2012 Talking on hand-held 2011 16-24 0.5% (2) 0.9% (3) 0.6% (3) 0.5% 0.2% 25-69 1.1% (50) 0.8% (38) 0.7% (37) 0.9% 0.7% 70 and older 0.0% (0) 0.0% (0) 0.0% (0) 1.0% 0.6% Total 1.0% (52) 0.7% (41) 0.7% (40) 0.9% 0.6%
Note: Difference in percentage between 2014 and 2015 are calculated, not shows in additional column Table 25 shows the observed distracted driving behaviors by select counties.
The behavior of holding a phone to the ear while driving was significantly different amongst all the counties (p=0.00), with 6.4% occurring in Riverside to 0.0% in Kern and Tulare counties (not shown).
The observation of headset or Bluetooth use ranged from 0.0% in Kern and Tulare counties (not shown) to 4.3% in Butte County (not shown) and 3.1% in Orange and San Mateo County, which is significant at p=0.00 (with the actual number of observations being very small).
The manipulation of a hand-held device while driving ranged from 0.4% in San Bernardino County to 9.9% in Sonoma County, a difference significant at p=0.00.
Talking on a hand-held device also showed significant differences among the selected counties, with Sonoma showing the highest rate of 5.6% (p=0.00), compared to 0.3% in Los Angeles and 0.0% in Butte, El Dorado, San Joaquin, and Tulare counties (not shown).
2015 Ewald & Wasserman California Distracted Driving Study Report Page 18
Table 25. Selected counties by distracted driving behavior – with comparison to previous waves County Phone to ear 2015 Phone to ear 2014 Phone to ear 2013 Phone to ear 2012 Phone to ear 2011
Alameda 1.4% 0.4% 2.9% 1.0% 1.1% Los Angeles 2.0% 1.1% 1.5% 2.5% 2.1% Orange 0.8% 0.5% 0.5% 1.0% 1.3% Placer 1.9% 2.6% 4.5% 3.2% 2.2% Riverside 6.4% 1.5% 2.0% 2.8% 4.5% San Bernardino 1.3% 1.6% 0.0% 4.0% 2.5% San Diego 1.3% 0.9% 0.5% 2.2% 1.1% San Mateo 0.6% 0.0% 1.1% 3.8% 2.0% Santa Clara 1.2% 0.6% 1.3% 1.1% 0.5% Sonoma 2.8% 0.0% 2.4% 0.0% 0.6%
County Bluetooth 2015 Headset/ Bluetooth 2014 Headset/ Bluetooth 2013 Headset/ Bluetooth 2012 Headset/ Bluetooth 2011 Headset/
Alameda 1.3% 1.9% 2.0% 2.7% 1.2% Los Angeles 1.2% 0.4% 1.2% 1.0% 0.7% Orange 3.1% 1.6% 1.5% 2.0% 1.8% Placer 1.2% 2.1% 2.7% 1.7% 1.7% Riverside 0.5% 1.0% 3.0% 0.6% 2.8% San Bernardino 0.4% 0.0% 0.0% 0.5% 3.4% San Diego 0.4% 0.4% 0.7% 1.5% 0.2% San Mateo 3.1% 1.9% 1.1% 3.8% 6.4% Santa Clara 1.7% 0.4% 4.7% 1.7% 1.0% Sonoma 1.4% 0.0% 0.0% 3.6% 0.6%
County Manip. hand-held 2015 Manip. hand-held 2013 Manip. hand-held 2013 Manip. hand-held 2012 Manip. hand-held 2011
Alameda 5.7% 2.1% 3.1% 3.9% 2.5% Los Angeles 2.3% 2.8% 2.5% 3.4% 2.2% Orange 3.1% 2.5% 3.2% 2.6% 0.3% Placer 4.4% 4.6% 3.2% 2.9% 0.4% Riverside 2.5% 3.9% 1.0% 0.0% 3.5% San Bernardino 0.4% 0.4% 4.0% 3.5% 5.9% San Diego 1.3% 1.4% 2.8% 4.8% 1.4% San Mateo 4.5% 0.9% 2.5% 3.8% 2.8% Santa Clara 3.7% 2.0% 2.4% 2.4% 0.0% Sonoma 9.9% 7.1% 12.2% 3.6% 1.8%
County Talking hand-held 2015 Talking hand-held 2014 Talking on hand-held 2013 Talking on hand-held 2012 Talking on hand-held 2011
Alameda 1.6% 0.4% 1.1% 0.0% 0.5% Los Angeles 0.3% 0.4% 0.7% 0.7% 0.7% Orange 0.6% 0.6% 0.3% 1.3% 1.5% Placer 2.3% 2.1% 1.1% 0.9% 0.4% Riverside 1.5% 1.5% 1.0% 0.0% 0.7% San Bernardino 1.3% 0.4% 0.0% 0.0% 0.8% San Diego 0.9% 0.6% 0.7% 0.8% 0.5% San Mateo 1.1% 0.9% 0.0% 0.4% 0.0% Santa Clara 0.5% 0.8% 0.9% 0.9% 0.2% Sonoma 5.6% 0.0% 4.9% 0.0% 0.6%
2015 Ewald & Wasserman California Distracted Driving Study Report Page 19
B. Countywide and Regional Results on Distracted Driving
Overall electronic device use and distracted driving due to electronic devices variable by county
The rate of distracted driving due to device use by county is shown in Table 26, and ranges from 2.9% in Merced to 12.7% in Sonoma County. The percentage of the DD behavior among counties is significantly different (p=0.01). However, the number of total observations in some counties is very small.
Table 26. Distracted driving due to electronic devices by county with comparison to previous waves
DD by county 2015 Percent 2014 Percent 2013 Percent 2012 Percent 2011 Percent Sonoma 12.7% 7.1% 14.0% 3.6% 1.8% Riverside 9.4% 6.9% 3.9% 2.8% 8.3% Alameda 7.5% 2.9% 6.3% 5.0% 3.2% Solano 6.9% 3.0% 4.0% 10.8% 7.7% Placer 6.5% 7.9% 8.3% 6.1% 3.0% Tulare 6.2% 3.6% 5.3% 7.1% 4.8% Kern 6.0% 2.7% 5.5% 3.0% 6.0% Santa Clara 5.4% 3.5% 4.1% 4.4% 0.7% San Mateo 5.4% 1.4% 3.6% 8.1% 4.7% San Joaquin 4.9% 4.7% 1.5% 10.9% 4.3% Los Angeles 4.6% 4.2% 4.7% 6.6% 5.0% Orange 4.5% 3.7% 4.0% 5.0% 3.0% Butte 4.3% 8.0% 3.6% 15.4% 0.0% El Dorado 3.6% 1.0% 2.5% 6.8% 2.5% San Diego 3.5% 3.0% 4.0% 7.9% 3.1% San Bernardino 3.0% 2.4% 4.0% 7.4% 9.3% Merced 2.9% 2.9% 1.9% 8.4% 5.8%
Distracted driving due to electronic devices by region variable
As in the previous waves of the study, three regions were delineated by county into “Northern California,” “Central California,” and “Southern California.” Table 27 shows the grouping of counties into the three geographic areas.
Table 27. Counties by region Northern California Central California Southern California
Butte Tulare Los Angeles
Alameda Kern Riverside
Santa Clara Merced San Bernardino
El Dorado Orange
San Joaquin San Diego
San Mateo Santa Clara
Solano Sonoma
2015 Ewald & Wasserman California Distracted Driving Study Report Page 20
Out of all observations, 42.8% were completed in the Northern California region, 11.5% in Central, and 45.7% in Southern California; the observation ratio is comparable to previous waves (see Table 28).
Table 28. Number of observations by region with comparison to previous waves Region 2015 Percent 2014 Percent 2013 Percent 2012 Percent 2011 Percent North 42.8% 36.4% 34.9% 32.7% 36.8% Central 11.5% 10.7% 12.1% 7.0% 11.8% South 45.7% 53.0% 53.0% 60.3% 51.4% Total 100.0% 100.0% 100.0% 100.0% 100.0%
The comparison of the region variable by the observation of holding the phone to the ear is shown in Table 29, without significant differences among regions. The increase of 0.8% of this behavior since 2014 in the Southern region is significant (p=0.01).
Table 29. Holding phone to ear by region with comparison to previous waves Talking on hand-held by region 2015 Percent 2014 Percent 2013 Percent 2012 Percent 2011 Percent Difference 2015-2014 Region North 1.5% 1.1% 2.3% 2.5% 1.5% +0.4% Central 1.6% 1.8% 2.2% 2.0% 4.1% -0.2% South 1.8% 1.0% 1.0% 2.3% 2.0% +0.8%
The region variable and the observation of drivers talking on a headset or Bluetooth device shows a significant difference (p=0.02, see Table 30) with a lower observation rate among Central region drivers. The increase of headset or Bluetooth use in the south by 0.7% compared to 2014 is significant as well (p=0.01).
Table 30. Talking on headset/Bluetooth by region with comparison to previous waves Talking on headset by region 2015 Percent 2014 Percent 2013 Percent 2012 Percent 2011 Percent Difference 2015-2014 Region North 1.7% 1.4% 2.9% 2.3% 2.0% +0.3% Central 0.2% 0.7% 1.2% 7.8% 1.9% -0.5% South 1.4% 0.7% 1.2% 1.2% 1.2% +0.7%
Distracted driving due to electronic devices by presence of children and passenger and vehicle
characteristics
The percentage of distracted driving by presence of children under the age of eight in the car, together with the previous waves of data is shown in Table 31. There is no significant difference between drivers with or without children in the car with respect to being distracted by electronic device use.
Table 31. Distracted driving due to electronic devices and the presence of children under age eight in car with comparison to previous waves
DD by kids under 8 in car 2015 Percent 2014 Percent 2013 Percent 2012 Percent 2011 Percent Difference 2015-2014 Kid < 8 in car Yes, kid <8 in car 2.4% 2.8% 2.8% 6.9% 1.7% 0.0% No 3.3% 2.5% 2.4% 6.4% 4.3% -0.1%
2015 Ewald & Wasserman California Distracted Driving Study Report Page 21
Table 32. Distracted driving due to electronic devices by vehicle type with comparison to previous waves DD by vehicle type 2015 Percent 2014 Percent 2013 Percent 2012 Percent 2011 Percent Vehicle Passenger Car 5.4% 4.0% 4.3% 6.5% 3.8% Van or SUV 4.8% 3.5% 5.0% 6.3% 4.6% Pickup Truck 6.3% 3.9% 4.9% 6.4% 4.5%
Overall, there are significant differences in the incidence of distracted driving and the number of passengers in the car (Table 33). Of drivers alone in a car, 6.2% were observed using an electronic device while driving; that percentage is reduced with more passengers in the vehicle (significant at p=0.00).
There has also been a significant increase in the instances of distracted driving due to device use for drivers alone in the car (1.8%, p=0.00, sample sizes too low for other comparisons).
Table 33. Distracted driving due to electronic devices by number of passengers in car with comparison to previous waves DD by # of passengers 2015 Percent 2014 Percent 2013 Percent 2012 Percent 2011 Percent Difference 2015-2014 P asseng ers 1 6.2% 4.4% 5.6% 6.7% 5.1% +1.8% 2 3.4% 2.9% 2.4% 5.8% 2.1% +0.5% 3 2.2% 1.1% 2.8% 6.7% 3.2% +1.1% 4 1.5% 2.4% 2.4% 2.9% 1.3% -0.9% 5 0.0% 0.0% 0.0% 7.7% 0.0% -- 6+ 0.0% 0.0% 0.0% 0.0% 0.0% --
Distracted driving due to electronic devices combined with observation categories
Tables 34, 35, 36, and 37 show the combined observation categories by the distracted driving due to electronic device use variable.
Table 34. Combined table of distracted driving by electronic devices by time, road, and area type
Yes No Total Time # % # % # % Rush Hour 95 5.3% 1,712 94.7% 1,807 100.0% Weekend 44 4.1% 1,029 95.9% 1,073 100.0% All Other 149 6.0% 2,320 94.0% 2,469 100.0% Total 288 5.4% 5,061 94.6% 5,349 100.0% Road Type # % # % # %
HWY exit ramp 70 5.7% 1,158 94.3% 1,228 100.0%
Surface Street 218 5.3% 3,903 94.7% 4,121 100.0% Total 288 5.4% 5,061 94.6% 5,349 100.0% Area Type # % # % # % Rural 55 3.7% 1,416 96.3% 1,471 100.0% Urban 92 4.7% 1,860 95.3% 1,952 100.0% Suburban 141 7.3% 1,785 92.7% 1,926 100.0% Total 288 5.4% 5,061 94.6% 5,349 100.0%
2015 Ewald & Wasserman California Distracted Driving Study Report Page 22
Table 35. Combined table of cell phone use and driving by electronic devices by demographic variables
Yes No Total Age # % # % # % 16-24 28 7.0% 370 93.0% 398 100.0% 25-69 254 5.5% 4,370 94.5% 4,624 100.0% 70+ 6 1.8% 321 98.2% 327 100.0% Total 288 5.4% 5,061 94.6% 5,349 100.0% Gender # % # % # % Female 124 5.5% 2,143 94.5% 2,267 100.0% Male 164 5.3% 2,918 94.7% 3,082 100.0% Total 288 5.4% 5,061 94.6% 5,349 100.0% Ethnicity # % # % # % White 157 5.6% 2,646 94.4% 2,803 100.0% African American 15 6.6% 214 93.4% 229 100.0% Asian 21 3.1% 646 96.9% 667 100.0% Hispanic/Latino 87 5.6% 1,468 94.4% 1,555 100.0% Other 8 8.4% 87 91.6% 95 100.0% Total 288 5.4% 5,061 94.6% 5,349 100.0%
Table 36. Combined table of cell phone use and driving by electronic devices by vehicle type and occupancy Yes No Total No. of Passengers # % # % # % 1 243 6.2% 3,661 93.8% 3,904 100.0% 2 40 3.4% 1,137 96.6% 1,177 100.0% 3 4 2.2% 181 97.8% 185 100.0% 4 1 1.5% 65 98.5% 66 100.0% 5 0 0.0% 14 100.0% 14 100.0% 6+ 0 0.0% 3 100.0% 3 100.0% Total 288 5.4% 5,061 94.6% 5,349 100.0% Presence of Children < 8 # % # % # % Yes 7 2.4% 286 97.6% 293 100.0% No 281 5.9% 4,763 94.1% 5,056 100.0% Total 288 5.4% 5,061 94.6% 5,349 100.0% Vehicle Type # % # % # % Passenger Car 158 5.4% 2,770 94.6% 2,928 100.0% Van or SUV 74 4.8% 1,457 95.2% 1,531 100.0% Pickup Truck 56 6.3% 834 93.7% 890 100.0% Total 288 5.4% 5,061 94.6% 5,349 100.0%
2015 Ewald & Wasserman California Distracted Driving Study Report Page 23
Table 37. Combined table of cell phone use and driving by electronic devices by geographic
Yes No Total County # % # % # % Alameda 47 7.5% 582 92.5% 629 100.0% Butte 1 4.3% 22 95.7% 23 100.0% El Dorado 3 3.6% 80 96.4% 83 100.0% Kern 7 6.0% 109 94.0% 116 100.0% Los Angeles 42 4.6% 863 95.4% 905 100.0% Merced 8 2.9% 267 97.1% 275 100.0% Orange 29 4.5% 614 95.5% 643 100.0% Placer 28 6.5% 400 93.5% 428 100.0% Riverside 19 9.4% 183 90.6% 202 100.0% San Bernardino 7 3.0% 228 97.0% 235 100.0% San Diego 16 3.5% 445 96.5% 461 100.0% San Joaquin 8 4.9% 154 95.1% 162 100.0% San Mateo 19 5.4% 333 94.6% 352 100.0% Santa Clara 22 5.4% 387 94.6% 409 100.0% Solano 9 6.9% 121 93.1% 130 100.0% Sonoma 9 12.7% 62 87.3% 71 100.0% Tulare 14 6.2% 211 93.8% 225 100.0% Total 288 5.4% 5,061 94.6% 5,349 100.0% Region # % # % # % North 146 6.4% 2,141 93.6% 2,287 100.0% Central 29 4.7% 587 95.3% 616 100.0% South 113 4.6% 2,333 95.4% 2,446 100.0% Total 288 5.4% 5,061 94.6% 5,349 100.0%
Notes on Limitations
As outlined in the Driver Electronic Device Use Protocol published by NHTSA (DOT HS 811 361), the methodology has two noteworthy limitations. First, the observation protocol only observes drivers during daylight hours. Secondly, it only observes them at controlled intersections, and not while moving. It is therefore plausible that the actual observed numbers on distracted driving might be either higher or lower than observed.
2015 Ewald & Wasserman California Distracted Driving Study Report Page 24
Appendix A– Observation Form
ID of Location: ________________ Time Type: __________________ Alternate 1: ______________________Road: 1=HWY Exit Ramp 2=Surface Street 3=Other
Data Collected by: ____________________ Weather condition: _____________________________ Start Time: __________________ End Time: ___________________ Data Collected on: ____________________ Area Type: 1=Rural 2=Urban 3=Suburb Notes: ____________________________________________________
E v e n t # Age A=16-24 B=25-69 C=70 and older Gender M=Male F=Female Ethnicity W=White AA=African American A=Asian H=Hispanic O=Other Vehicle type 1=Passenger car 2=Van or SUV 3=Pickup truck Passengers Number in car (If 1 - SKP next question) Kids under age 8 Y=Yes N=No Holding Phone to Ear with Hand √ Talking on Headset OR Bluetooth √ Manipulating Hand-Held Device √ Talking on Handheld Device √ 1 2 3 4 5 6 7 8 9 10 11 12 13 14 15 16 17 18 19 20 21 22 23 24 25
DRIVER/VEHICLE CHARACTERISTICS DRIVER BEHAVIOR
√ √
2015 Ewald & Wasserman California Distracted Driving Study Report Page 25
Appendix B – Estimated Hands Free Use
Use of hands-free devices is difficult to identify in observational studies because the device may not be visible to the observer. Consequently, "Talking with headset/Bluetooth" is likely to be underestimated at the observed level of 1.4% in 2015. The National Highway Traffic Safety Administration (NHTSA) has developed a methodology to compensate for this difficulty.2 The UC Berkeley Safe Transportation Research and
Education Center (SafeTREC) has applied this methodology for use with California data. The correction raises the hands-free usage from 1.7% to 3.3%, and the overall cell phone usage rate from 7.3% to 9.2%.
The correct usage can be estimated by extrapolating the counts of drivers talking on the phone from the current observational study using data from the California Traffic Safety Survey, conducted last in July 2014. The ratio of drivers that talk with a hands-free device to drivers that talk with a hand-held device from the 2014 survey is 1.24, meaning that 24 percent more of respondents admitted to hands-free usage than admitted to hand-held usage. This ratio can be multiplied by the percentage of drivers with "Phone to ear" and "Talking on hand-held" from the observational survey to provide a better estimate of the percentage of drivers "Talking with headset/Bluetooth" (3.3%). Adding the “Talking with headset/Bluetooth” percentage to the 3 other observed behaviors provides an overall use rate of 9.2%.
The steps of the analysis appear below. The distracted driving variable was created from the observation of three behaviors:
1. Holding a phone to the ear
2. Talking on a hand held device (i.e., talking while holding the phone away from ear) 3. Manipulating a hand held electronic device while driving
The fourth variable observed is NOT included in the distracted driving behavior variable: 4. Talking on a phone using a headset or Bluetooth device is
In Table 1, below, are the frequencies and percentages of distracted behaviors in 2013 through 2015:
Table 1. Frequency of device user behaviors in 2013 through 2015
2015 2014 2013
DD behavior Frequency Percent Frequency Percent Frequency Percent
1. Phone to Ear 89 1.7% 64 1.1% 96 1.6%
2. Talking on hand-held 52 1.0% 41 0.7% 40 0.7%
3. Manipulating hand-held 177 3.3% 126 2.2% 154 2.5%
4. Talking with
headset/Bluetooth 74 1.4% 53 0.9% 109 1.8%
Total distracted driving by
electronic device 392 7.3% 284 5.0% 399 6.5%
Talking with headset/Bluetooth may be underestimated since it is difficult to observe. This can be corrected by using the California Traffic Safety Survey that can be used to estimate the ratio between drivers that talk with a hands-free device to drivers that talk with a hand-held device. In table 2, below, is data from the 2013 through 2015 California Traffic Safety Survey:
2
2015 Ewald & Wasserman California Distracted Driving Study Report Page 26
Table 2. Reported cellphone use from California Traffic Safety Survey
Survey questions 2015 2014 2013
How often in the past 30 days have you talked on a hands-free
cell phone?1 59.8% 61.0% 53.5%
How often in the past 30 days have you talked on a hand-held
cell phone while driving? 48.5% 44.6% 44.5%
Ratio 1.239 1.261 1.202
1
Percentages are for drivers who reported any frequency of use (regularly/sometimes/rarely).
By applying the ratio to total talking on handheld devices (“Holding phone to ear” and “Talking on hand -held”) we can estimate the percent of drivers that talk using a headset/Bluetooth device.
Table 3. Estimation of driver headset use
2015 2014 2013
DD behavior Frequency Percent Frequency Percent Frequency Percent
Total talking hand-held
(1+2) 141 2.6% 105 1.8% 136 2.5%
Ratio (multiplier)2 1.202 1.370 1.202
4. Talking with
headset/Bluetooth 3.3% 2.5% 3.0%
2
From the California Traffic Safety Survey
Therefore, the overall cellphone use while driving in California is shown below:
Table 4. Cellphone use rates
DD behavior 2015 2014 2013
1. Phone to Ear 1.7% 1.1% 1.6%
2. Talking on hand-held 1.0% 0.7% 0.7%
3. Manipulating hand-held 3.3% 2.2% 2.5%
4. Talking with headset/Bluetooth3 3.3% 2.5% 3.0%
Total cellphone use 9.2% 6.6% 7.8%
3
2015 Ewald & Wasserman California Distracted Driving Study Report Page 27