Optimal Hajj Funds Management by Islamic Bank
Ariani Dian Pratiwi1, Idqan Fahmi2, Rifki Ismal3
Abstract. The purpose of this paper is to find the optimal portfolio of Hajj fund management by the Islamic banks in Indonesia. BPKH, as an authority, can place the Hajj fund on Islamic bank deposits. However, Islamic banks limited the expected returns and risks set by BPKH so that the appropriate strategy is required to establish the optimal of portfolio. Islamic banks face a trade-off because of the increased level of risk constrains the intention to get higher returns. This study uses a mean-variance portfolio optimization theory to construct such an optimal portfolio. Finally, this study recommends Murabaha financing and SBIS to Islamic banks as the optimal portfolio selection. The combination of an efficient portfolio that has formed cannot be fully employed because the expectation limits them. However, Islamic banks can still select the optimal portfolio combination according to their risk preferences.
Keywords: Hajj fund, Islamic banking, efficient portfolio
JEL Classification: G11, G18
Abstrak. Penelitian ini bertujuan untuk menentukan portofolio optimal dalam pengelolaan dana haji oleh bank syariah di Indonesia. BPKH sebagai otoritas pengelolaan dana haji dalam mengelola dana haji dapat menempatkan pada pada deposito syariah. Namun demikian bank syariah dibatasi oleh ekspektasi imbal hasil dan risiko yang ditetapkan BPKH sehingga strategi yang tepat diperlukan untuk membentuk portofolio optimal. Bank syariah dihadapkan pada trade-off imbal hasil dan risiko dimana keinginan untuk memperoleh imbal hasil yang tinggi akan diikuti oleh meningkatnya risiko. Penelitian ini menggunakan teori mean-variance dalam optimalisasi portofolio untuk membentuk portofolio yang optimal. Hasil penelitian ini merekomendasikan portofolio pembiayaan murabaha dan SBIS kepada bank syariah dalam pemilihan portofolio optimal. Kombinasi portofolio efisien yang telah diperoleh tidak seluruhnya dapat dipilih oleh bank syariah karena dibatasi oleh ekspektasi BPKH. Namun demikian bank syariah tetap dapat memilih portofolio optimal berdasarkan preferensi risiko.
Kata Kunci:dana haji, perbankan syariah, portfolio efisien
How to Cite:
Pratiwi, A. D., Fahmi, I., & Ismal, R. (2019). Optimal Hajj Funds Management by Islamic Bank. Etikonomi: Jurnal Ekonomi. Vol. 18 (2): 303 – 314. doi: http//dx.doi.org/10.15408/etk.v18i2.10938.
Introduction
The management of Hajj funds in Indonesia is crucial by considering the vast amount collected and the length of the waiting period. The Hajj funds in December 2017 reached IDR 102.7 trillion. Meanwhile, the waiting list of prospective pilgrims in Indonesia has reached 3.7 million people with the fastest departure period is seven years, and the longest reach 39 years (Kementrian Agama, 2018). The management of hajj deposit funds can provide benefits for pilgrims in the form of decreasing the cost of organizing the Hajj and improving services (Abidin, 2016).
The Hajj Financial Management Board (BPKH), as the authority of hajj fund management in the 2018 period, appoints 31 banks, including full-fledged Islamic Banks (BUS), and Islamic Business Units (UUS) as Deposit Recipient Banks for Hajj Implementation Costs (BPS-BPIH). However, Islamic banks limited the expected returns and risks set by the BPKH in managing the Hajj fund. BPS-BPIH is expected to meet the returns determined by BPKH equivalent to 6% -7% per year with the risk acceptance category in low to medium risk. The expected returns determined by BPKH are above the average of Islamic banking deposit returns in which equivalent to 5.67% in the 2017-2018 period. Thus, it becomes a limitation for BPS-BPIH to choose the instrument for Hajj fund management that can provide returns above the average with a maximum level of risk in the medium category. BPKH also considers the element of liquidity related to operational funding needs during the pilgrimage. Therefore it can also be a limitation for Islamic banks in the selection of instruments considering that the main activity of Islamic banking is the distribution of Islamic finance that has an average period of more than one year.
In practice, Islamic banks can allocate third party funds to four allocations including: first, direct financing to the real sector; Second, indirect financing through the purchase of Islamic securities, placements in other banks and transactions in the Islamic money market; Third, placements at Sentral Bank; and Fourth, internal reserve. Islamic banks can manage hajj funds in a portfolio that comprises Islamic financing and Islamic financial market instruments. However, Islamic finance and Islamic financial market instruments have different characteristics in terms of returns, risks, and liquidity. It faces Islamic banks a trade-off, the intention to get higher returns to constrain by the increased level of risk, and vice versa. Therefore, the appropriate strategy is required by BPS-BPIH to establish the optimal portfolio of hajj fund management.
The formation of an optimal portfolio can use in the financial market industry (Malik & Surya, 2013; Zaimovic & Berilo, 2014; Garcia, et al., 2015; Lee, et al., 2016; Zaimovic, et al., 2017), or in the banking industry (Chatti, et al., 2011; Kazan & Uludag, 2014; Galiniene & Stravinskyte, 2016). Meanwhile, the theory and application in the optimal portfolio selection by Islamic banks are still limited. Islamic banks can use a modern portfolio theory approach that comprises the Markowitz Theory and Capital Asset Pricing Model (CAPM) and post-modern portfolio theory that is a development of modern portfolio theory (Ascarya et al., 2014). According to Iqbal (2002), modern portfolio theory developed by Markowitz (1952) is more in line with Islamic principles than CAPM because Markowitz Theory does not recognize risk-free assets.
has carried out by Ismal (2014) and Ascarya et al. (2014). Ascarya et al. (2014) applied the Markowitz-Tobin Model by adding risk-free instruments to determine the optimal portfolio. While Ismal (2014) using the Markowitz Theory and did not add risk-free instruments in determining an optimal portfolio, furthermore, this study will apply Markowitz Theory, according to Iqbal (2002) and Ismal (2014), assuming that there are no risk-free assets in the principle of Islamic finance.
The purposes of this study are: first, to identify the profile of returns and risks from financing instruments and the Islamic financial market. Second, to analyze the returns and portfolio risks that form to find an efficient portfolio in managing the Hajj funds. Third, to recommend an optimal portfolio based on the expected returns and risks of BPKH that are following the risk tolerance level of Islamic banks as a risk lover, risk-averse, or risk-neutral. This research is limited to a study of the profile of return and portfolio risk in the Hajj’s management funds placed at BPS-BPIH. Other macroeconomic factors such as inflation, exchange rates, and economic growth are not included in this research and assumed to have reflected in the return (performance) in financing instruments and the Islamic financial market.
Methods
This study applies a combination of quantitative descriptive approaches. It uses secondary data in the form of monthly time series data on the outstanding value and returns on financing instruments and Islamic financial markets. Instruments for portfolio formation include Murabaha financing, Mudharabah financing, Musyarakah financing, FASBIS, SBIS, SIMA, and SBSN. This study applies the IFR-007 SBSN series, which is related to data availability in this research period.
Data processing and analysis techniques of this study use the risk-return portfolio theory introduced by Markowitz (1952). The following steps carry out the establishment of an optimal portfolio for the management of Hajj funds by BPS-BPIH. First, calculate the expected return and variance of each investment instrument with the following formulations (Jones, 2014):
(1)
(2)
Where: E (Rn) is expected return of instrument i (%); pi is probability of an event (return) (%);ri is rate of return of instrument i (%); Var (Rp) is variance of instrument i (%)
Second, establish a portfolio from the combinations of investment instruments. The combination of portfolios will consist of 2 instruments consisting of Islamic financing instruments and Islamic financial market instruments. Considering the elements of return, risks, and portfolio liquidity, choose this combination. This combination forms as many as 12 portfolios. Third, calculate the expected return and variance of each portfolio formulated as follows (Jones, 2014):
(3)
Where: E (Rn) is expected return of portofolio (%); and wn is weight of instrument-n based on its market value (%)
(4)
Where: Var (Ri) is Variance of portfolio i (%); wi is weight of instrument-n based on its market value (%); σ is standard deviation; Cov is Coefficient correlation
Fourth, Establish an efficient portfolio frontier line. The efficient frontier is a collection of efficient portfolios located along the curve line. When the portfolios of the two instruments have been obtained, for example, instruments x and y with x = (x1, ..., xn) and y = (y1, ..., yn) and assumption that γ is a constant, Z’s efficient portfolio is then formulated in the following formula (Ismal, 2014):
(5)
After solving the problem of equation (5), it will get a combination of two x and y instruments that have minimal variance and high returns. In the curve of the efficient portfolio frontier, instruments x and y are written {E(Rx), σ2x} and {E(Ry), σ2y}. Then, if Z =
γx +(1- γ) y, the variance value and return of the efficient portfolio frontier are: (6)
(7)
In the equation, Lamda (γ) shows the objectives of the investor or the level of investor tolerance in dealing with risk. By including variations in the Lamda value, it will obtain the characteristics of a complete efficient frontier portfolio (Ismal, 2014).
Fifth, select an Optimal Portfolio In this study, optimal portfolio selection based on BPS-BPIH risk acceptance preferences. The risk determined by the following assumptions: first, portfolio distribution is carried out to facilitate the selection of portfolios based on three risk acceptance categories (Bodie et al., 2014). The risk consists of averse, risk-neutral, and risk-lover. Second, the distribution of portfolios divides into three categories based on low, medium, and high-risk values. Third, Investors tend to avoid risks (Fabozzi & Modigliani, 2009), so they tend to choose the lowest risk portfolio in each category. Fourth, at each level of the same risk, the portfolio that has the highest return tends to be chosen. In other words, at the same return level, the portfolio with the lowest risk tends to be chosen.
Results and Discussion
Individual Instrument Risk-Return Analysis
During the January 2010 to December 2018 period, Islamic finance has an average return above 10%. Meanwhile, Islamic financial market instruments have return below 10%, as shown in Figure 1. The return of financing has a downward trend where the most significant decline experienced by Mudharabah. Islamic financing with the concept of profit-sharing -Mudharabah and Musyarakah- show the trend of fluctuating returns during the research period. It can cause by the nature of the profit-sharing financing contract, which is influenced by the conditions of the real sector. Therefore the returns fluctuate according to economic conditions.
Mudharabah financing shows a decline in the returns from 2010 to 2018 period along with Indonesia’s economic slowdown as a result of the 2008 global crisis. Maximum and minimum returns on Mudharabah recorded at 21.32% and 9.76%, respectively. Mudharabah has the highest return among other instruments in the period of January 2010 - May 2014. However, from June 2014 to December 2018, Mudharabah returns were under Murabaha financing. Musyarakah has the lowest return among financing instruments but is relatively stable compared to Mudharabah. Musyarakah returns increased in the January 2010 - December 2010 period and decreased in the January 2011 - December 2018 period. The maximum and minimum returns of Musyarakah recorded at 14.97% and 9.46%, respectively. Murabaha financing also showed a decreasing trend in returns but is relatively more stable compared to Mudharabah and Musyarakah. The maximum and minimum returns on Murabaha recorded at 17.15% and 11.88%, respectively.
Figure 1. Rate of return Islamic Financing and Islamic Financial Market
Source: BI, OJK, Bloomberg (processed data)
Meanwhile, the Islamic financial market instruments have fluctuated trends during the study period. The return of SBIS and FASBIS instruments influenced by the BI Rate and is relatively more stable compared to SIMA and SBSN. The maximum and minimum returns of SBIS instruments are recorded at 7.36% and 3.82%, respectively, while the maximum and minimum returns for FASBIS instruments recorded at 6.00% and 3.50%, respectively. SIMA shows fluctuating returns compared to other Islamic financial market instruments. The performance of Islamic banking influenced fluctuating returns of SIMA during the study period, in which SIMA determined by the performance of the fund management bank. The maximum and minimum gains of SIMA recorded at 7.30% and 1.08%, respectively. SBSN, as a sharia capital market instrument, has the highest average return among Islamic financial market instruments. The fluctuations return of SBSN on the secondary market, especially the IFR-007 series are affected by market conditions during that period. The maximum and minimum gains of SBSN recorded at 10.50% and 5.84%, respectively.
The actual return from each instrument then used to obtain expected returns by complete equation one and to calculate the variance by solving equation 2. Mathematically,
risk can measure by the absolute measure of spread or return variability called variance (Jones, 2014). The measurements equivalent to risk are square roots of variance, namely standard deviation, which measures the deviation of each observation and a reliable measure of variability because all information is easy to use. Deviations that consider as risks are not only deviations below the average value (which are negative), but also deviations above the average that are positive (Bodie et al. 2014). Furthermore, the expected return and standard deviation of each instrument shown in Table 1. Table 1 presents that financing instruments have higher expected returns compared to Islamic financial market instruments. However, Islamic financial market instruments have a lower risk compared to Islamic finance.
Table 1. Expected return and Risk
Instrument Expected Return (%) Standard Deviasi (%)
Mudharabah 14.00 2.48 Murabaha 13.76 1.21 Musyarakah 12.14 1.41 SBSN 8.15 1.03 SBIS 6.05 0.91 SIMA 5.26 1.05 FASBIS 4.85 0.83
All financing instruments are risky, which is the impact of economic conditions after the 2008 global crisis. Islamic financing based on profit sharing -Mudharabah and Musyarakah- has the highest risk, among others. It indicates that this financing has uncertainty in returns, because of their nature of contracts, which is directly affected by the conditions of the real sector. While Murabaha, as the majority financing in Indonesia, has the lowest risk, indicates that Murabaha’s return is more defined compared to Mudharabah and Musyarakah. It can occur because of the nature of Murabaha that uses the concept of trade, in which profits are determined based on the selling price of goods. Therefore, the return that Islamic bank gets relatively fixed from the beginning to the end of the period. Consequently, the risk of Murabaha is lower than profit sharing financing.
All Islamic financial market instruments have a lower risk compared to Islamic financing. SIMA, as a sharia money market instrument, has the highest risk in the sharia financial market group. Despite risky, the return of SIMA expectations of 5.26% is below the expected returns of SBSN and SBIS, which are 8.15% and 6.05%, respectively. The performance has a direct relationship to the high risk of SIMA. So, it has an impact on the level of certainty of the returns.
SBSN, as a sharia capital market instrument, has the highest expected returns in the group of Islamic financial market instruments of 8.15% with a standard deviation value of 1.03%. In the Islamic financial market group, SBSN has the second-highest standard deviation after SIMA. It indicates the uncertainty of the SBSN return on the secondary market, especially the IFR-007 series. This risk value might influence by economic conditions and the long term of SBSN at 15 years.
SBIS and FASBIS instruments have the lowest risk compared to other instruments. However, SBIS has higher expected returns compared to SIMA and FASBIS. Even though it has the same reference for return, the BI Rate, SBIS, and FASBIS instruments have different standard deviation values, which are 0.91% and 0.83%, respectively. This difference may be due to the SBIS period that has a more extended than FASBIS. SBIS period is from 1 month to 12 months, while FASBIS has a maximum period of 14 days.
Based on the profile of returns and risks each instrument, we can conclude that if BPS-BPIH only places hajj funds on one instrument, it can only choose to Islamic finance to obtain returns by BPKH expectation. However, gains on Islamic finance tend to be affected by economic conditions. Thus, Islamic finance is risky than Islamic financial market instruments. This high risk can affect the fulfillment of risk expectations set by the BPKH. To meet BPKH’s risk expectations, BPS-BPIH can choose Islamic financial market instruments that have a lower risk. However, the Islamic financial market offers less competitive returns. Therefore the tradeoff between returns and risks leads BPS-BPIH to establish optimal portfolios to obtain returns and risks that meet BPKH expectations.
Portfolio Risk-Return Analysis
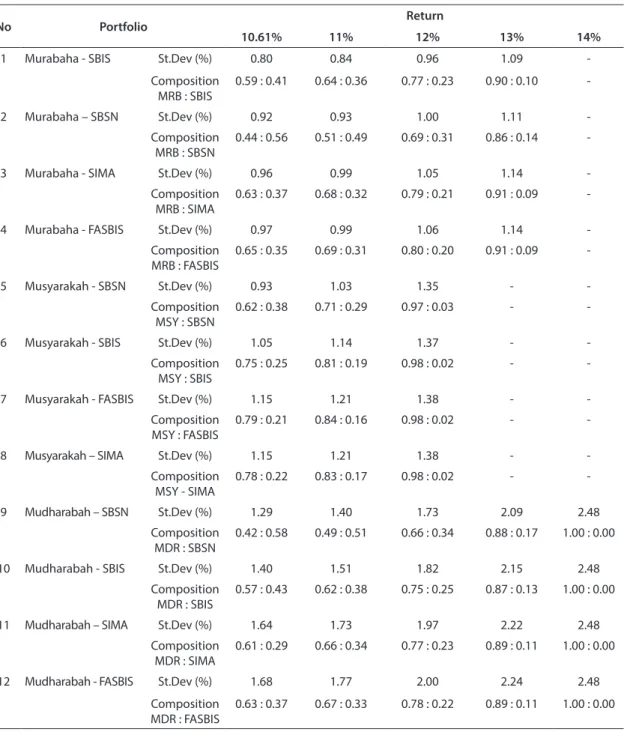
The portfolio in this study consists of a combination of two instruments, namely Islamic financing and Islamic financial market instruments that formed in 12 portfolios. By solving equations 3 and 4, we can obtain a portfolio combination that results in the lowest risk value at a specific return level. Table 2 shows the results of a portfolio combination that have the lowest standard deviation at the predetermined return level, which is in the range of 10.61% - 14.00%.
The range of returns is determined so that Islamic banks have added value to the management of the Hajj fund. To determine the minimum return in the distribution of Hajj funds, BPS-BPIH can consider the level of deposit margin spreads. It is the spread between the returns from the distribution of funds and the returns to deposit funds. The Islamic banking industry had a deposit margin spread of 4.61% during the 2014-2018 period. Therefore, to meet BPKH expectation return of 6.00% and be able to provide added value to Islamic banks, BPS-BPIH can choose a portfolio that can provide a minimum return of 10.61%.
Table 2 shows that the portfolio of Murabaha and SBIS has the lowest risk level at the predetermined rate of return. It indicates that Murabaha and SBIS portfolios are efficient portfolios compared to others. The low level of risk in the Murabaha and SBIS portfolio due to the low standard deviation of each instrument and a negative correlation between the two instruments. This result is in line with Hadiyoso et al. (2015) that a diversification process can be taken to minimize risk by combining stocks with low correlation to one another into one portfolio.
Table 2 also shows that the portfolio of Musyarakah and Islamic financial market instruments are not optimal for achieving returns above 13%, due to the low yield on Musyarakah financing which is equal to 12.14% and the Islamic financial market instruments that are below 9%. Meanwhile, Mudharabah financing and Islamic financial market instruments can achieve the highest yield of 14.00%. However, this portfolio is also risky when compared to others.
Table 2. Optimal portfolio combination
No Portfolio Return
10.61% 11% 12% 13% 14%
1 Murabaha - SBIS St.Dev (%) 0.80 0.84 0.96 1.09
-Composition
MRB : SBIS 0.59 : 0.41 0.64 : 0.36 0.77 : 0.23 0.90 : 0.10
-2 Murabaha – SBSN St.Dev (%) 0.92 0.93 1.00 1.11
-Composition
MRB : SBSN 0.44 : 0.56 0.51 : 0.49 0.69 : 0.31 0.86 : 0.14
-3 Murabaha - SIMA St.Dev (%) 0.96 0.99 1.05 1.14
-Composition
MRB : SIMA 0.63 : 0.37 0.68 : 0.32 0.79 : 0.21 0.91 : 0.09
-4 Murabaha - FASBIS St.Dev (%) 0.97 0.99 1.06 1.14
-Composition MRB : FASBIS 0.65 : 0.35 0.69 : 0.31 0.80 : 0.20 0.91 : 0.09 -5 Musyarakah - SBSN St.Dev (%) 0.93 1.03 1.35 - -Composition MSY : SBSN 0.62 : 0.38 0.71 : 0.29 0.97 : 0.03 -
-6 Musyarakah - SBIS St.Dev (%) 1.05 1.14 1.37 -
-Composition MSY : SBIS
0.75 : 0.25 0.81 : 0.19 0.98 : 0.02 -
-7 Musyarakah - FASBIS St.Dev (%) 1.15 1.21 1.38 -
-Composition
MSY : FASBIS 0.79 : 0.21 0.84 : 0.16 0.98 : 0.02 -
-8 Musyarakah – SIMA St.Dev (%) 1.15 1.21 1.38 -
-Composition MSY - SIMA 0.78 : 0.22 0.83 : 0.17 0.98 : 0.02 - -9 Mudharabah – SBSN St.Dev (%) 1.29 1.40 1.73 2.09 2.48 Composition MDR : SBSN 0.42 : 0.58 0.49 : 0.51 0.66 : 0.34 0.88 : 0.17 1.00 : 0.00
10 Mudharabah - SBIS St.Dev (%) 1.40 1.51 1.82 2.15 2.48
Composition MDR : SBIS
0.57 : 0.43 0.62 : 0.38 0.75 : 0.25 0.87 : 0.13 1.00 : 0.00
11 Mudharabah – SIMA St.Dev (%) 1.64 1.73 1.97 2.22 2.48
Composition
MDR : SIMA 0.61 : 0.29 0.66 : 0.34 0.77 : 0.23 0.89 : 0.11 1.00 : 0.00
12 Mudharabah - FASBIS St.Dev (%) 1.68 1.77 2.00 2.24 2.48
Composition MDR : FASBIS
0.63 : 0.37 0.67 : 0.33 0.78 : 0.22 0.89 : 0.11 1.00 : 0.00
The Optimal Portfolio
The first step in selecting the optimal portfolio is to form an efficient frontier for the Murabaha and SBIS portfolio. The efficient frontier can obtain by solving equations 5, 6, and 7 in which Murabaha design as an ‘x’ instrument and SBIS as a ‘y’ instrument. Assuming the portion of each instrument (z) lies between 0 and 1 in the interval 0.075, the efficient frontier portfolio illustrated in Figure 2 starts from point A to point C with a turning point at point B. The efficient portfolio frontier contains a collection of portfolios optimal that can be chosen by BPS-BPIH. BPS-BPIH then can choose a portfolio along the line from point B to C because it can provide maximum returns compared to the portfolio located along point A to point B.
Figure 2. Optimal Portfolio
The combination of an efficient portfolio that has formed cannot be fully employed because it limited by the expected returns and risks set by the BPKH. So, it is necessary to set a minimum return and maximum risk from the chosen portfolio combination. The minimum return of 10.61% has been determined in advance so that Islamic banks can meet BPKH’s expectations and obtain added value from the management of Hajj funds. Meanwhile, to meet BPKH risk expectations, BPS-BPIH can choose a portfolio with a low to moderate risk category.
Portfolios can be divided based on standard deviation values into three categories, low, medium, and high in order to obtain risk limits. Portfolio distribution is to facilitate the selection of portfolios based on three risk acceptance categories, namely averse, risk-neutral, and risk lover (Bodie et al. 2014). A risk-averse as a conservative will tend to avoid taking risks and choosing a risk-free portfolio. While risk lovers will be more courageous to take risks and prefer a portfolio that has a higher risk and gives a higher return.
Figure 3. Optimal Portfolio Combination
Based on processed data, Murabaha and SBIS portfolios have a standard deviation value between 0.73% and 1.21%. Portfolios will divide into three categories based on standard deviation values: low-risk portfolios with standard deviations below 0.89%, medium risk
portfolios with standard deviations between 0.89% to 1.05%, and high-risk portfolios with standard deviations above 1.05%. To meet BPKH risk expectations, BPS-BPIH can choose a portfolio with a maximum standard deviation value of 1.05%, which is the upper limit of the medium-risk category.
Furthermore, BPS-BPIH can choose a portfolio that produces a minimum return of 10.61% with a maximum standard deviation value of 1.05%. The efficient frontier that shows the optimal portfolio combination and can be selected by BPS-BPIH illustrates in Figure 3. BPS-BPIH with the risk-averse category can be recommended to use a portfolio with a composition of Murabaha of 59.15% and SBIS of 40.85%, which gives a return of 10.61% and a standard deviation of 0.80%. This portfolio recommends because it can meet the minimum return limit that can provide added value for BPS-BPIH of 10.61%. Besides, portfolio risk includes in the low-risk range, with the value of the variant below 0.89%.
BPS-BPIH with the risk-neutral category is recommended to choose a portfolio with a composition of Murabaha of 69.85% and SBIS of 30.15%, which gives a return of 11.44% and a standard deviation of 0.89%. Portfolios have the lowest risk in the medium-risk category. So, it recommends for the medium-risk-neutral category due to the characteristics of investors who tend to avoid risks (Fabozzi & Modigliani, 2009). In this case, they will choose the portfolio with the lowest risk in each category.
BPS-BPIH in the risk-lovers category is recommended to choose a portfolio with a composition of Murabaha financing of 86.08% and SBIS of 13.92%, which gives a return of 12.69% and a standard deviation of 1.05%. This portfolio is the upper limit of the medium-risk category. The portfolio recommends for the medium-risk-lovers category due to the limitation of BPKH’s risk expectation, in which the maximum risk is moderate. Thus, if BPKH risk expectations do not limit it, the risk-lovers category can choose a portfolio with a higher risk category because it can provide maximum returns.
This research obtained results that can provide managerial implications for several parties such as BPS-BPIH as a fund manager and BPKH as the financial management authority of hajj and regulators in creating a pleasant investment climate. This research showed that the portfolio of Murabaha and SBIS is efficient portfolios and can be recommended in the management of Hajj funds by BPS-BPIH.
For BPS-BPIH, the results of the study illustrate that Murabaha financing is optimal financing because it can provide competitive returns with lower risks compared to Mudharabah and Musyarakah. The results of this research are in line with Ismal (2014) that found the optimal portfolio combination in the March 2004 - July 2011 period consisting of Mudharabah and Murabaha. Besides, Ascarya et al. (2014), using data from January 2005 - December 2012, found that profit-sharing financing (Mudharabah and Musyarakah) is the most optimal financing compared to non-profit sharing financing (Murabaha). The difference in the results of these researches may be due to differences in the use of data periods and research methods.
Based on the results of the research, SBIS instruments are efficient instruments compared to other Islamic financial market instruments because they have more competitive returns with low-risk values. SBIS, as one of the Sharia Monetary Operation instruments, has
a relatively stable return compared to other Islamic financial market instruments. However, the volume of SBIS instruments is still limited, so that it can be an obstacle for BPS-BPIH to place it on these instruments. The volume of SBIS in the 2014-2018 period averaged 14.07% of the total volume of Islamic financial market instruments owned by Islamic banks. Financial market instruments that are mostly owned by Islamic banking are SBSN and FASBIS.
For BPKH, the results of this research are expected to provide an overview of the management of Hajj funds by Islamic banks and be useful for the selection of Hajj funds placement instruments. BPKH can increase the level of risk acceptance so that BPS-BPIH is more flexible in managing Hajj funds in order to obtain maximum returns. For the government, this expects to provide an overview of the management of the Hajj funds by Islamic banks. It is also useful for determining policies regarding the management of Hajj funds. This research also gives an illustration to Bank Indonesia that Islamic monetary operating instruments have the potential to be optimized in the real sector, so give an added value to the economy. This conclusion is following Ismal (2011) that recommend the Islamic monetary instruments can contribute to stabilizing the economy. Rather than reserving the excess liquidity, the Islamic monetary instruments employ and use it in the real business activities and share the outputs (incomes) based on the contribution of every party.
Conclusion
The results of the study show that Islamic financing instruments and Islamic financial markets have different characteristics, in which each instrument cannot meet the BPKH’s expectations of the risk and return. Islamic banks need portfolio formation in hajj funds management in order to meet BPKH’s expectations. Finally, this study recommends Murabaha financing and SBIS to BPS-BPIH as the optimal portfolio selection, and the combination of an efficient portfolio that has formed cannot be fully employed because the expectation of BPKH limits them. However, Islamic banks can still select the optimal portfolio combination according to their risk preference as a risk-averse, risk-neutral, or risk lovers. The suggestion for BPKH is to be willing to accept the risk of the placement of Hajj funds in Islamic banks and can increase the level of risk acceptance so that Islamic bank is more flexible in managing Hajj funds to obtain maximum returns. For further study, it is expected to consider the macroeconomic factors, risks, and individual preferences of each Islamic bank, and the risk of managing SBSN by the government to obtain more complete results.
References
Abidin, M. Z. (2016). Analisis Investasi Dana Haji dalam Pembiayaan Infrastruktur dan Peningkatan Kualitas Penyelenggaraan Ibadah Haji (Analysis of the Investment of the Pilgrimage Fund in Infrastructure Financing and Improving the Quality of the Implementation of the Pilgrimage). Harmoni, 15(2), 152-164.
Ascarya, Karim, A.A., & Anwar, E. (2014). Impact of Investment Model to Profitability Before and During Financial Crisis. Proceeding The 6th International Conference on Islamic Banking
Bodie, Z., Kane, A., Marcus, A.J., & Jain, R. (2014). Investments (9thed). Singapore: McGraw-Hill Education.
Chatti, A.M., Kablan, S., Yousfi, O. (2011). Activity Diversification and Performance of Islamic Banks in Malaysia. MPRA Paper No. 29421.
Fabozzi, F.J., Modigliani, F. (2009). Capital Markets Institutions and Instruments (4th ed). New Jersey: Pearson Education Inc
Galiniene, B., & Stravinskyte, J. (2016). Constructing an Optimal Investment Portfolio for The Bank of Lithuania. Ekonomika, 95(1), 112-133. https://doi.org/ 10.15388/Ekon. 2016.1.9909.
Garcia, F., Buenob, J.A., & Oliver, J. (2015). Mean-variance Investment Strategy Applied in Emerging Financial Markets: Evidence from the Colombian Stock Market. Intellectual Economics, 9, 22-29. https://doi.org/10.1016/j.intele.2015.09.003.
Hadiyoso, A., Firdaus, M., & Sasongko, H. (2015). Building an Optimal Portfolio on Indonesia Sharia Stock Index (ISSI). International Journal of Administrative Science & Organization, 22(2), 111-121. https://doi.org/10.20476/jbb.v22i2.5699.
Iqbal, Z. (2002). Portfolio Choices and Asset Pricing in Islamic Framework. In Ahmed, H. (Ed.), Theoritical Foundations of Islamic Economics (pp. 167-187). Jeddah: The Islamic Development Bank IRTI.
Ismal, R. (2011). Central Bank Islamic Monetary Instruments: a Theoretical Approach. Studies in Economics and Finance, 28(1), 51-67. https://doi.org/10.1108/108673711111 10552 Ismal, R. (2014). An Optimal Risk-return Portfolio of Islamic Banks. Humanomics, 30(4),
286-303. https://doi.org/10.1108/H-08-2013-0055
Jones, C.P. (2014). Investments Principle and Concepts (12th ed). Singapore : John Wiley & Sons
Kazan, H., & Uludag, K. (2014). Credit Portfolio Selection According to Sectors in Risky Environments: Markowitz Practice. Asian Economic and Financial Review, 4(9), 1208-1219.
Lee, H.S., Cheng, F.F., & Chong, S.C. (2016). Markowitz Portfolio Theory and Capital Asset Pricing Model for Kuala Lumpur Stock Exchange: a Case Revisited. International Journal of Economics and Financial Issues, 6(3S), 59-65.
Malik, M., & Surya, B. A. (2013). Optimal portfolio strategy of Indonesian government bond and foreign exchange using Markowitz efficient theory. Proceedings of 4th Asia-Pacific Business Research Conference 2013, Singapore.
Markowitz, H. (1952). Portfolio Selection. The Journal of Finance, 7(1), 77-91.
Zaimovic, A., & Berilo, A. A. (2014). Risk Diversification Between the German and Bosnian Stock Markets. South East European Journal of Economics and Business, 9(1), 30-36. https://doi.org/10.2478/jeb-2014-0003.
Zaimovic, A, Berilo, A.A., & Mustafic, A. (2017). Portfolio diversification in The South-East European equity markets. South East European Journal of Economics and Business, 12(1), 126-135. https://doi.org/10.1515/jeb-2017-0010.