THESIS FOR THE DEGREE OF DOCTOR OF PHILOSOPHY
in
MACHINE AND VEHICLE SYSTEMS
Addressing Female Whiplash Injury Protection
A Step Towards 50
thPercentile Female Rear Impact Occupant Models
A
N N A
C
A R L S S O N
Department of Applied Mechanics
CHALMERS UNIVERSITY OF TECHNOLOGY Gothenburg, Sweden, 2012
Addressing Female Whiplash Injury Protection
A Step Towards 50
thPercentile Female Rear Impact Occupant Models
A
NNA
C
ARLSSON
ISBN 978-91-7385-671-3
©
A
NNA
C
ARLSSON, 2012
Doktorsavhandlingar vid Chalmers tekniska högskola
Ny serie nr 3352
ISSN: 0346-718X
Department of Applied Mechanics
Chalmers University of Technology
SE-412 96 Gothenburg
Sweden
Telephone +46 (0)31 7721000
Cover:
The 50
thpercentile female rear impact dummy FE model, EvaRID V1.0
Pictures courtesy of Humanetics.
Chalmers Reproservice Gothenburg, Sweden 2012
A
DDRESSING
F
EMALE
W
HIPLASH
I
NJURY
P
ROTECTION
A S
TEPT
OWARDS50
THP
ERCENTILEF
EMALER
EARI
MPACTO
CCUPANTM
ODELSANNA CARLSSON
Division of Vehicle Safety, Department of Applied Mechanics Chalmers University of Technology
Whiplash Associated Disorder (WAD) – commonly denoted whiplash injury – to vehicle occupants involved in collisions, is of worldwide concern. These injuries occur at relatively low velocity changes, typically between 10–25 km/h, and in all impact directions. Rear impacts are, however, the most common in the accident statistics. Since the mid-1960´s, statistical data has shown that females have up to three times higher risk of sustaining whiplash injuries than males, in similar crash conditions.
The overall objective was to improve the understanding of why females are at greater risk of sustaining whiplash injuries in rear impacts, compared to males. Two rear impact studies involving ~50th percentile female and male volunteers were carried out. In both studies, response corridors for ~50th percentile females were generated and compared to previously published response corridors for 50th percentile males. Additionally, the Neck Injury
Criterion (NIC) values, head-to-head restraint distances and contact times were compared between female and male volunteers. Thereafter, a 50th
percentile female rear impact dummy Finite Element (FE) model, EvaRID V1.0, was developed from an existing BioRID II model. The anthropometry and mass distribution of the 50th percentile female were specified based on published data. Its mechanical response was evaluated with data from one of the volunteer studies. Finally, a scaled-down rear impact dummy prototype – BioRID50F – was developed using modified BioRID II dummy components. The scaled-down dummy was representative of a 50th percentile female in mass and key dimensions and intended to function as a representative seat loading device. The BioRID50F was evaluated against new volunteer test results from low-speed rear impact sled tests including female volunteers close to a 50th percentile female in size. A series of rear impact tests with the BioRID50F were performed in four different seats from four different car models. The results were compared to previously performed BioRID tests in equivalent setup.
It was found that the overall biofidelity of the EvaRID V1.0 was acceptable at low velocity changes (7 km/h). A general stiffness reduction in EvaRID V1.0 of 30 percent compared to the BioRID II, proved to be a promising first iteration. However, further improvements are of the EvaRID V1.0 as well as BioRID II models are required with regards to the stiffness of the thoracic spine. The results from the rear impact test series comprising volunteers and the BioRID50F supported the findings from earlier publications, indicating that there may be characteristic differences in the rear impact dynamic seat back interaction between males and females. A mechanical or computational model of a 50th
percentile female would be an important complement to the existing 50th percentile male BioRID II occupant models when evaluating seat performance. These models can be used, not only as a tool when designing protective systems, but also in the process of further evaluation and development of injury criteria.
KEYWORDS: whiplash, neck injury, volunteers, head restraint, crash test, rear impact,
A
CKNOWLEDGEMENTS
This study was mainly funded by the European Commission as part of the project ADSEAT (Adaptive Seat to Reduce Neck Injuries for Female and Male Occupants) – project No. 233904 – within the 7th Framework Program. Additional funding was provided by the Swedish Governmental Agency for Innovation Systems (VINNOVA), IIHS (Insurance Institute for Highway Safety), Folksam Research Foundation, the Swedish Transport Administration, and the Swedish National Road and Transport Research Institute (VTI). This work has involved many people and I would like to thank you all, and especially: My examiner, Per Lövsund at Chalmers, for accepting me as a PhD student at Chalmers. My supervisor, Mats Svensson at Chalmers, for always believing in me, for instant support despite heavy work load, and for fruitful and interesting discussions.
My co-supervisor, Johan Davidsson at Chalmers, for your helping hand, in particular for testing and dummy development, and for thorough review of my work.
My co-supervisor, Astrid Linder at VTI, for introducing me to the area, and for generous and inspiring support during the first part of my studies. Without you the ADSEAT project would not exist.
Gunter Siegmund, MEA Forensic (Canada), for generously providing data and excellent feedback/cooperation.
Anders Kullgren, Folksam/Chalmers, for generously sharing data and knowledge. Helena Stigson, Folksam, for interesting discussions.
Persons involved in the planning, preparation, and/or performance of the volunteer rear impact sled test series in Munich, Germany; Wolfram Hell, Sylvia Schick, Stefan Horion, and Kristin Thorsteinsdottir at LMU (Germany); and Carsten Reinkemayer, Egon Steinkohl, Martin Grimme, and Helmut Brandl at the Test Centre at Allianz in Ismaning (Germany). Thank you! It’s been an absolute pleasure working with you.
Persons at Humanetics (previously FTSS) involved in the development of the EvaRID V1.0 model; Paul Lemmen, Fred Chang, Fuchun Zhu, Karl Koschdon, Nagananda Burra, Apoorva Lakshminarayana. Thank you! I have thoroughly enjoyed working with you.
Persons involved in the planning, preparation, and/or performance of the rear impact sled test series in Austria; Kai-Uwe Schmitt, Toni Weber, and Markus Muser at AGU Zurich (Schwitzerland); Ernst Tomasch at Graz University of Technology (Austria); and Hermann Steffan, Erich Diesenreither, and Florian Nyvelt at Dr Steffan Datentechnik in Linz (Austria). Thank you! Working with you has been inspiring.
To all partners of the ADSEAT project – I hope that I will have the opportunity to work with you again on future projects.
Ex-colleagues and friends at VTI; especially Niklas, Tania, Christina, Jesper, Mikael, Fredrik, Martin, Anders, Anna, Lennart, Hans-Erik, and Robert at the Göteborg office; and the TST and MFT units in Linköping. Keep up the good spirits.
Colleagues and friends at Chalmers; Karin Brolin, Krister Wolff, Hans Norin, Jikuang Yang, Jac Wismans, Selpi Selpi, Helen Fagerlind, Lotta Jakobsson, Göran Brännare, Sonja Laakso Gustafsson, Marianne Hedfors, Petra Gustafsson, Aleksandra, Stina, Kristian, Jonas, Ruth, Isabelle, Manuel, Linus, Jacobo, Jóna, Marianne, Laure-Lise, Azra, Krystoffer, Ulrich, Anna, Sarbaz, Emma, Henrik, Mikael, Jan, Li, Jan-Ove; and at SAFER; Anna Nilsson-Ehle,
Helena Gellerman, Lisa Knutsson, and Daniela Michael; for making my days at the office even more enjoyable.
The participants of the SAFER-Whiplash pre-study for interesting whiplash injury discussions from different viewpoints.
Johannes Adler, for the work with the with the BioRID50F dummy and the laboratory seat. Thomas Nygårds, Chalmers, for the measurements of foam material properties in the laboratory seat.
Jan Möller, Chalmers, for helping me out with practical work; such as construction of the laboratory seatback, welding, and measurements – and for lending me tools.
Elisabet Agar, my former colleague at VTI, for nice chats and lunches, and for reviewing the language in this thesis.
My Mentor4Research, Christer Wirén – I’m grateful for your guidance.
Bertil Jonsson for enjoyable conversations about everything, but mostly about whiplash injuries and seating postures for males and females.
Colleagues at Autoliv; especially former Autoliv Safety Centre for valuable input regarding crash testing; Johan Svärd; Yngve Håland; Cecilia Sunnevång; Ola Boström; and Linda Eriksson for sharing of knowledge and encouragement. Special thanks to all members of the “Girl Club”, for frequently planning/arranging celebrations, small excursions and picnics (always in nice weather) – much needed breaks in my studies; and to former and present members of the Autoliv Art Lottery Committee, especially Marika Henningsson.
The library at Chalmers, Lindholmen for your excellent service.
Eva-Marie Lundberg, my former colleague at Saab, for always being there
-Anna-Carin Gram, my colleague at Autoliv, for our frequent small-talk
-Sara Janhäll, my fellow student during the Master Programme at Chalmers, I’m happy to be back in touch again after so many years
-My friends; Sanna, Silvia, Andreas, Kristina, Cathrin, Christoffer, Cecilia, Thomas, Markus, Mats, Anders, Marianne, Mats, Susanne, Petra, Rolf for your encouragement, laughs over dinner, and pleasant conversations -
Kristin; I’m grateful for your valuable input and support.
My family: Greger, Märta, and Greta for your love and understanding during intense working periods; my parents Eva and Bertil for being there whenever needed; my sisters Petrea and Hillevi and their families; and Malle, Curt and Barbro for taking care of the children.
T
ABLE OF
C
ONTENTS
ABSTRACT ... i
ACKNOWLEDGEMENTS ... ii
LIST OF APPENDED PAPERS ... vi
DEFINITIONS AND ABBREVATIONS ... viii
1. INTRODUCTION ... 1
1.1 Whiplash Injuries ... 1
1.2 Rear Impacts ... 3
1.3 The Anatomy and Range of Motion of the Neck ... 8
1.4 Rear Impact Dynamic Response ... 12
1.5 Injury Mechanisms and Injury Sites ... 13
1.6 Injury Criteria and Thresholds... 15
1.7 Whiplash Injury Protection Strategies ... 17
1.8 Human Models Used for Rear Impact Tests ... 20
1.9 Anthropometry of the 50th Percentile Female ... 22
1.10 Dynamic Responses of Females and Males ... 24
1.11 Summary ... 26
2. OBJECTIVES ... 27
2.1 Papers I & III ... 27
2.2 Paper II ... 27
2.3 Paper IV ... 27
2.4 Paper V ... 27
3. METHOD AND MATERIAL ... 28
3.1 Papers I & III ... 28
3.2 Paper II ... 29 3.3 Paper IV ... 30 3.4 Paper V ... 31 4. RESULTS ... 34 4.1 Papers I–III ... 34 4.2 Paper IV ... 40 4.3 Paper V ... 45 5. DISCUSSION ... 48 5.1 Methods ... 49 5.2 Results ... 51 6. CONCLUSIONS ... 57 REFERENCES ... 59 APPENDIX ... A1
L
IST OF
A
PPENDED
P
APERS
PAPER I
Linder A, Carlsson A, Svensson MY, Siegmund GP (2008) Dynamic Responses of Female
and Male Volunteers in Rear Impacts, Traffic Inj. Prev., Vol. 9, No. 6, pp. 592–599
Division of work between authors: Siegmund performed the volunteer test series during the late 1990´s and provided the data for further analysis. Linder and Svensson made the outline of this study, based on a subset of the volunteers from the first study. Carlsson made the analysis and the presentation of data. The paper was written by Linder and Carlsson, and was reviewed by all authors.
PAPER II
Carlsson A, Linder A, Svensson MY, Davidsson J, Hell W (2011) Dynamic Responses of
Female Volunteers in Rear Impacts and Comparison to Previous Male Volunteer Tests,
Traffic Inj. Prev., Vol. 12, No. 4, pp. 347–357
Division of work between authors: Carlsson made the outline of this study with support of Linder and Svensson. Hell was responsible for the recruitment and medical examination of the female volunteers. Carlsson, Linder, Svensson, Davidsson, and Hell participated, partly or full time, during the tests. Davidsson provided the data from previous tests comprising male volunteers. Carlsson made the analysis and the presentation of data. The paper was written by Carlsson, and reviewed by all authors.
PAPER III
Carlsson A, Siegmund GP, Linder A, Svensson MY (2012) Motion of the Head and Neck of
Female and Male Volunteers in Rear Impact Car-to-Car Impacts, accepted for publication
in Traffic Inj. Prev.
Division of work between authors: Siegmund performed the volunteer test series during the late 1990´s and provided the data for further analysis. Carlsson made the outline of this study with support of Linder and Svensson. Carlsson made the analysis and the presentation of data. The paper was written by Carlsson, and was reviewed by all authors.
PAPER IV
Carlsson A, Chang F, Lemmen P, Kullgren A, Schmitt K-U, Linder A, Svensson MY (2012)
EvaRID - A 50th Percentile Female Rear Impact Finite Element Dummy Model, prepared for
journal submission.
Division of work between authors: Carlsson, Chang, Lemmen, Linder, and Svensson made the outline of this study. Schmitt and Kullgren provided anthropometric data from insurance records; Carlsson made the analysis and presentation of data. Carlsson performed the literature review regarding the anthropometry and mass distribution of the 50th percentile female. Chang implemented the anthropometric data in the EvaRID V1.0 model. Carlsson provided data from rear impact tests comprising female volunteers (Paper II) for the evaluation of the model. Carlsson, Chang, Lemmen, and Svensson participated in discussions on how to improve the dummy model response. Carlsson analysed previously performed rear impact tests with the BioRID dummy. The paper was written by Carlsson, and reviewed by all authors.
PAPER V
Carlsson A, Davidsson J, Weber T, Schick S, Tomasch E, Schmitt K-U, Muser M, Kullgren A, Hell W, Linder A, Svensson MY (2012) Seatback Interaction of 50th Percentile Male and
Female Occupant Sizes – Indicating a Need for a Female Rear Impact Dummy, prepared for
journal submission.
Division of work between authors:
Tests with volunteers: Carlsson, Davidsson, Schick, Hell, Linder, and Svensson made the
outline of the study. Schick was responsible for the recruitment and medical examination of the female volunteers. Carlsson, Schick, Hell, and Svensson participated, partly or throughout the volunteer tests. Carlsson made the analysis and the presentation of data.
Tests with BioRID50F: Carlsson, Davidsson, Tomasch, Schmitt, Kullgren, and Svensson
made the outline of the study. Kullgren was involved in the selection of seats for the test series. Svensson and Davidsson were responsible for the development of the BioRID50F dummy. Carlsson, Davidsson, Weber, Tomasch, Muser, Linder, and Svensson participated, partly or throughout the BioRID50F tests. Carlsson made the analysis and the presentation of data.
The paper was written by Carlsson, and reviewed by all authors.
Conference Presentations of the Present Work
Carlsson A, Linder A, Svensson MY, Siegmund GP. Dynamic Responses of Female and
Male Volunteers in Rear Impacts. World Congress on Neck Pain; January 20–22, 2008; Los
Angeles, CA
Carlsson A, Linder A, Svensson MY, Davidsson J, Schick S, Horion S, Hell W. Female
Volunteer Motion in Rear Impact Sled Tests in Comparison to Results from Earlier Male
Volunteer Tests, Proceedings IRCOBI Conference; September 17–19, 2008; Bern,
Switzerland, pp. 365–366
Carlsson A. Dynamisk respons av kvinnor och män vid en upphinnandekollision. Transportforum, January 8–9, 2009; Linköping, Sweden
Carlsson A, Siegmund GP, Linder A, Svensson M. Motion of the Head and Neck of Female
and Male Volunteers in Rear Impact Car-to-Car Tests at 4 and 8 km/h. Proceedings
IRCOBI Conference; September 15–16, 2010; Hanover, Germany, pp. 29–39
Carlsson A. EvaRID: A 50th Percentile Female Rear Impact Dummy FE Model. 5th Inter-national Whiplash Trauma Congress; August 24–28, 2011; Lund, Sweden
D
EFINITIONS AND
A
BBREVATIONS
Anterior In front
AROM Active Range Of Motion
BioRID Biofidelic Low-Speed Rear Impact Dummy
CSN Central Nervous System
CFD Computational Fluid Dynamics
Extension (of the neck) Rearward stretching (of the neck) Flexion (of the neck) Forward stretching (of the neck)
GEBOD GEnerator of BODy (ergonomic software)
Hybrid III A high-speed frontal impact dummy
HR distance/contact Head-to-head restraint distance/contact Kyphosis Outward curvature of a portion of the spine Lordosis Inward curvature of a portion of the spine
MRI Magnetic Resonance Imaging
NHTSA National Highway Traffic Safety
Administration
NIC Neck Injury Criterion
PMHS Post Mortem Human Subject (human cadaver)
Posterior Behind/at the back of
Protraction Head moved forward relative to the torso, with no angular change
RAMSIS Rechnergestütztes
Anthropometrisch-Mathematisches System zur Insassen-Simulation (ergonomic software)
Retraction Head moved rearward relative to the torso, with no angular change
RID3D Rear Impact Dummy version 3D
SAHR Saab Active Head Restraint
SD Standard Deviation
T1 First thoracic vertebra
THOR Test device for Human Occupant Restraint
(a high-speed frontal impact dummy)
UMTRI University of Michigan Transportation Research
Institute
WhiPS Volvo’s Whiplash Protection System
To
Märta & Greta
Ɔ
1. I
NTRODUCTION
This thesis for the Degree of Doctor of Philosophy considers the dynamic responses of females and males induced by low-speed rear impacts. During this type of impact, the torso of the occupant is 1) pressed into the seatback and 2) pushed away from the seatback, while the head/neck is exposed to a whiplash type motion. Large loads can then arise in the fragile and complicated structures of the neck due to the head inertia, and result in so called whiplash injuries. Many different names are used for this type injury, for instance, Whiplash Associated Disorder (WAD), cervical spine injury, whiplash-type neck distortion, flexion-torsion neck injury, AIS1 neck injury, acute strain of the cervical spine, etc. Throughout this thesis, the most common definition is used: whiplash injury. The injury mechanisms are not fully understood since whiplash injuries are difficult to detect by using diagnostic tools such as X-rays or MRI (Magnetic Resonance Imaging). These injuries are classified as minor, although they can cause long-lasting pain and disability. The symptoms are well known, neck pain, stiffness, loss of sensation, memory impairment, and concentration difficulties to name a few.
The risk of whiplash injury is up to three times higher for females compared to males in similar crash conditions. However, when assessing vehicle safety, the only available occupant model for this impact scenario is a model of an average sized male. For males, significant progress in preventing whiplash injuries has been made due to dummy development and seat optimization. The need to establish the characteristics of the female response in rear impacts and implement the data in models for rear impact testing and evaluation is essential.
1.1 WHIPLASH INJURIES
Whiplash injury resulting from vehicle impacts is of worldwide concern. From a societal perspective these injuries are costly since they are frequent and can lead to long-lasting pain and disability. In Europe, the annual cost of whiplash injuries has been estimated to 10 billion Euros (Richter et al. 2000). In Japan, 547,654 traffic related injuries were registered during 1996 in which 44 percent of the victims suffered neck injury (Watanabe et al. 2000). In the USA, the number of whiplash injuries each year has been estimated to 800,000. Of these whiplash injuries, 270,000 were resulting from rear impacts with an annual cost of $2.7 billion (NHTSA 2004). In Sweden (population 9 million), more than 30,000 whiplash injuries are reported following vehicle collisions annually and the associated socio-economic impact is approximately 0.4 billion Euros per annum (the Whiplash Commission 2005). Whiplash injuries account for approximately 70 percent of all injuries leading to disability in modern cars on the Swedish market (Kullgren et al. 2007).
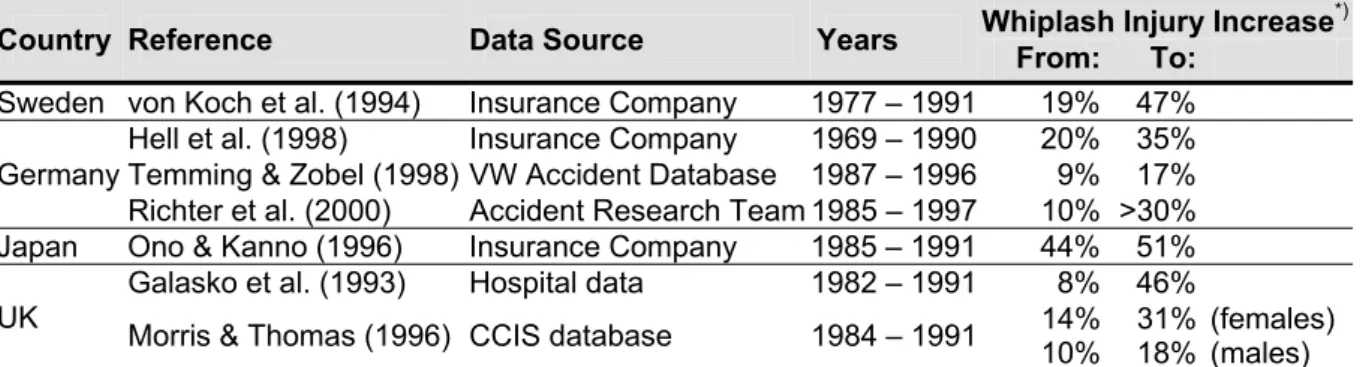
Data from different parts of the world has shown that the risk and the number of whiplash injuries have steadily increased from the late 1960´s to the late 1990´s (Galasko et al. 1993; v. Koch et al. 1994; Ono & Kanno 1996; Hell et al. 1998; Temming & Zobel 1998; Richter et al. 2000; Morris & Thomas 1996). Table 1 summarises the findings from the studies.
Table 1. The increase of whiplash injuries between the late 1960´s and late 1990´s in different countries.
Country Reference Data Source Years Whiplash Injury IncreaseFrom: To: *)
Sweden von Koch et al. (1994) Insurance Company 1977 – 1991 19% 47%
Germany
Hell et al. (1998) Insurance Company 1969 – 1990 20% 35%
Temming & Zobel (1998) VW Accident Database 1987 – 1996 9% 17%
Richter et al. (2000) Accident Research Team 1985 – 1997 10% >30%
Japan Ono & Kanno (1996) Insurance Company 1985 – 1991 44% 51%
UK Galasko et al. (1993) Morris & Thomas (1996) CCIS database Hospital data 1982 – 19911984 – 1991 14% 8% 46%
10% 31% 18% (females) (males)
*) The percentages given in the table have been calculated in different ways, it is not possible to compare the data from different references with each other.
In Germany the incidence of ‘cervical spine injuries’ (CSD) in motor vehicle accidents almost doubled from 1969 to 1990 (Figure 1a) (Hell et al. 1998). In the UK the ‘soft tissue injuries to the cervical spine’ increased from 8 percent 1982 to 46 percent in 1991 (Figure 1b) (Galasko et al. 1993). Morris and Thomas (1996) reported that the ’neck injury’ rates increased almost linearly over the years from 1984 to 1991 and that the increase was greater for the females compared to the males (Table 1).
Germany:
Percentage of CSD injuries in Car Accidents per injured person (all crash directions)
Hell et al (1998) 0 10 20 30 40 1969 1974 1980 1990 Ra te [% ] 20.3 26.9 29.5 35.0 UK:
Neck Sprain after Road Traffic Accident (all crash directions)
Galasko et al (1993) 0 10 20 30 40 50 Feb 1982 -Feb 1983 Feb 1983 -Feb 1984 1 Jan 1988 -31 Dec 1988 1 Jan 1990 -30 June 1990 1 Nov 1990 -30 Nov 1991 Ra te [% ]
Seat Belt Legislation
7.7
30.9 20.5
42.5 45.6
Figure 1. Whiplash injury rates for different years in a) Germany, and b) UK. Based on Hell et al. (1998) and Galasko et al. (1993).
Several factors contribute to the increase in whiplash injury risk and the number of whiplash injuries between the late 1960´s and the late 1990´s, for example:
- The seatbacks have increased up to 5.5-fold in strength from the 1960´s to the 1990´s in order to provide greater occupant retention in high-speed crashes (Viano 2008). The increase in strength has resulted in greater seat stiffness, i.e. an increased change in force during rearward occupant displacement. The boosted seat stiffness affects the interaction between the occupant and the seatback and may increase the forces on the neck.
- The improvements in vehicle construction (Delannoy & Diboine 2001) lead to a stronger and stiffer vehicle structure.
- Wearing seatbelts increases the whiplash injury risk (Deans et al. 1987; Otremski et al. 1989; Maag et al. 1990; Galasko et al. 1993). According to Galasko et al. (1993), the UK whiplash injury rate increased from 7.7 percent one year prior to the seatbelt legislation was implemented in February 1983, to 20.5 percent one year after the seatbelt legislation was implemented (Figure 1b). Deans et al. (1987) reported that >1 year after the crash, 34 percent of those who wore a seatbelt still experienced neck pain, while only 20 percent of those who had not worn a seatbelt still suffered neck pain.
A small decrease in the long-term whiplash injury risk in rear impacts (from 15.5 percent to 13.6 percent) was found in cars manufactured after 1997 and equipped with standard seats (i.e. no advanced whiplash protection systems) in comparison to cars manufactured before 1997 (Kullgren et al. 2007). Cars equipped with advanced whiplash protection systems posed an approximately 50 percent lower risk of long-term whiplash injuries for the occupants in rear impacts than for occupants in cars manufactured after 1997 without whiplash protections systems installed (Kullgren et al. 2007). In frontal impacts, it was found that airbags in combination with seatbelt pretensioners reduce the number of whiplash injuries by 41 ±15 percent (Kullgren et al. 2000).
Since the mid-1960´s, statistical data has shown that females have a higher risk of sustaining whiplash injuries than males, even in similar crash conditions (Figure 2) (Narragon 1965; Kihlberg 1969; O’Neill et al. 1972; Thomas et al. 1982; Otremski et al. 1989; Maag et al. 1990; Morris & Thomas 1996; Dolinis 1997; Temming & Zobel 1998; Richter et al. 2000; Chapline et al. 2000; Krafft et al. 2003; Jakobsson et al. 2004a; Storvik et al. 2009; Carstensen et al. 2011). According to these studies, the whiplash injury risk is up to three times higher for the females compared to the males.
0 1 2 3 R ela tiv e w h ip la sh in ju ry r is k Females Males (normalised to 1)
Figure 2. The relative whiplash injury risk for females (shaded light grey) compared to males (normalised to 1).
From an individual perspective, a whiplash injury can have a major influence on daily life with symptoms such as neck pain, stiffness, loss of sensation, memory impairment, and concentration difficulties (the Whiplash Commission 2005), which affect the quality of life and the ability to work. The majority of those who experience initial neck symptoms following a car crash recover within a few weeks or months after the crash (the Whiplash Commission 2005). However, 5-10% of victims will experience permanent disabilities of varying degrees (Nygren 1984; Galasko et al. 1996; the Whiplash Commission 2005). These injuries occur at relatively low changes of velocities, typically between 10–25 km/h (Eichberger et al. 1996; Kullgren et al. 2003) and in impacts from all directions (Galasko et al. 1993; Krafft 1998). Rear impacts are however the most common in the accident statistics (Watanabe et al. 2000).
1.2 REAR IMPACTS
Rear impact induced whiplash injuries account for ~50 percent of the total number of whiplash injuries according to hospital records and insurance companies´ data (Galasko et al. 1993; Krafft 1998; Hell et al. 1998) (Figure 3a, b). Data extracted from traffic accident databases is often biased towards severe, rather than minor, crashes and is consequently dominated by whiplash injuries induced by frontal impacts (Figure 3c).
Hospital data: Insurance Company data: CCIS database (UK):
(biased towards severe crashes)
Galasko et al. (1993) Krafft (1998) Morris & Thomas (1996)
Figure 3. The distribution of whiplash injuries with regards to different impact directions, based on a) hospital records (Galasko et al. 1993); b) insurance claims (Krafft 1998); and c) the CCIS database (Morris & Thomas 1996).
The majority of rear impacts (79 percent) occur when the struck vehicle has come to a standstill (21 percent at a red trafficlight or a stop sign, 11 percent making a left turn, 10 percent in an intersection, 8 percent at a standstill in a queue, and 6 percent standing at the side of the road). The remaining vehicles were hit while driving (8 percent); during hard braking (7 percent); and while slowing down (5 percent) (Viano & Olsen 2001).
Statistical data has identified how whiplash injury risks in rear impacts are influenced by different factors such as impact severity, vehicle specific features, seating position, head restraints, design and mechanical properties of the seat as well as occupant related factors (see further discussion below).
Impact Severity
Several studies have shown correlation between whiplash injury risk and impact severity (Ryan et al. 1994; Eichberger et al. 1996; Krafft et al. 2002; Kullgren et al. 2003). Based on data from crash recorders, Krafft et al. (2002) and Kullgren et al. (2003) found that the long-term whiplash injury risk approached 100 percent for mean vehicle accelerations above 7g. At mean accelerations below 5g the long-term injury risk was low (Kullgren et al. 2003). It was also found that for mean accelerations below 3g the risk approached zero (Krafft et al. 2002).
Vehicle Specific Features
Vehicle specific features such as car model, car mass and mechanical properties of the crash zones of the involved vehicles, influence the whiplash injury risk in rear impacts. The long-term whiplash injury risk varies widely between different car models, even if their mass is the same (Krafft 1998). A 22 percent higher risk was found for long-term disability in rear impacts sustained in cars fitted with a tow-bar compared to cars without a tow-bar (same car model) (Krafft 1998).
Seating Position
The whiplash injury risk is dependent on which car seat the occupant is positioned in. Several studies have indicated that front seat occupants have a higher whiplash injury risk than rear seat occupants (States et al. 1972; Carlsson et al. 1985; Jakobsson et al. 2000), however, when
looking at the long-term, Krafft et al. (2003) found a different relationship for the females. In this study a paired comparison was performed on all neck injuries reported to the Swedish insurance company Folksam, following rear impacts during 1990–1999. The males had a lower injury risk in the rear seat compared to the front seats, while the females had a considerably higher injury risk in the rear seat; the lowest risk for the females was found for the front passenger seat (Figure 4). The risk of permanent disability was three times higher for female drivers compared to male drivers. Similarily, permanent disability was 1.5 times higher for female front seat passengers, and more than five times higher for female rear seat passengers.
Head Restraints
The effectiveness of head restraints in rear impacts have been evaluated in many studies (O’Neill et al. 1972; States & Balcerak 1973; Kahane 1982; Nygren 1984; Lövsund et al. 1988). Integral head restraints reduce the overall injury risk in rear impacts by 17 percent, while adjustable restraints showed a reduction by 10 percent, according to Kahane (1982). The difference found for integral and adjustable head restraints could be attributed to occupants failing to position their adjustable restaints correctly. No injury reducing effect due to head restraint was found in the rear seat, while the effectiveness in the front seat was 29.8 percent (Lövsund et al. 1988).
Several studies have reported that improved head restraint geometry reduces the whiplash injury risk to a greater extent for females than for males (Table 2) (States et al. 1972; O’Neill et al. 1972; Thomas et al. 1982; Chapline et al. 2000; Farmer et al. 2003). A 37 percent reduction of whiplash injury frequency was found among female drivers compared to “very little effect” among male drivers for the improved seats in the Ford Taurus and Mercury Sable (Farmer et al. 2003). Foret-Bruno et al. (1991), on the other hand, reported that the injury reducing effect of head restraints was almost the same for males, 34 percent (from 23 percent to 15 percent), and females, 33 percent (from 45 percent to 30 percent).
Table 2. The injury reducing effect of head restraints.
Reference The Injury Reducing Effect of Head Restraints
Females Males
States et al. (1972) 51%=>38% -25% 40%=>35% -12%
O’Neill et al. (1972) 37%=>29% -22% 24%=>22% -10%
Thomas et al. (1982) 44%=>39% -11% 22%=>27% “no reducing effect”
Foret-Bruno et al. (1991) 45%=>30% -33% 23%=>15% -34% Chapline et al. (2000) 52%=>29% -44% 29%=>18% -38% 0 1 2 3 Driver Front-seat
passenger passengerRear-seat
Ri
sk
Females Males
Figure 4. The risk of permanent whiplash injury in relation to the male driver risk (normalised to 1) for different seating positions in rear impacts. Based on Krafft et al. (2003).
Increased head-to-head restraint (HR) distance has been reported to be associated with increased whiplash injury risk (Carlsson et al 1985; Nygren et al. 1985; Olsson et al. 1990; Deutcher 1996; Farmer et al 1999; Jakobsson et al. 2004b). A head restraint located less than 10 cm from the back of the head was found to be more beneficial with regards to whiplash injury outcome compared to a HR distance greater than 10 cm. Based on mathematical simulations, Stemper et al. (2006) suggested limiting the HR distance to less than 6 cm, either passively or actively after impact, further whiplash injury reduction may be accomplished. In contrast, Chapline et al. (2000) reported that the horizontal distance was not a significant factor in relation to neck pain, on the contrary, it was the height of the head restraint that was the primary factor related to head restraint effectiveness, especially for females (Figure 5). Although it was not statistically significant for male drivers, the percentages of both female and male drivers reporting neck pain increased as the position of the head restraint further decreased below the head’s center of gravity.
0% 10% 20% 30% 40% 50% 60% 70% Adequate Poor >10 cm, 16 cm >16 cmPoor R e a r-s tr uck dr iv er s w it h neck pai n
Vertical head restraint position
Females Males
Figure 5. Percentage of rear-struck drivers with neck pain by vertical head restraint position (distance between the centre of gravity of the head and the top of the head restraint). Based on Chapline at al. (2000).
Females tend to be positioned closer to the head restraint than males, based on measurements in stationary conditions (Szabo et al. 1994 (estimation from graph); Minton et al. 1997; Hell et al. 1999; Welcher & Szabo 2001 (estimation from graph); Jonsson et al. 2007; Schick et al. 2008), and the distance depends on the seating position (Jonsson et al. 2007). The average HR distance for males and females in these studies are summarised in Figure 6. Jonsson et al. (2008b) found that the HR distance increased on average ~4 cm for female as well as for male volunteers while driving the vehicle in comparison to the distance measured in a stationary vehicle. Cullen et al. (1996), on the other hand, did not find any significant difference in HR distance for males and females during driving. In this study vehicle occupants were filmed when the vehicles passed rigged cameras and the HR distance was estimated based on film analysis.
0 20 40 60 80 100 120
Driver Driver Front
Pass Driver Driver Front Pass PassRear
Szabo et al. (1994) Minton et al. (1997) Welcher Szabo (2001) Jonsson et al. (2007) Schick et al. (2008) H R d ist an ce [mm] Females Males
Figure 6. The average HR distance for male and female volunteers in different studies. Females are represented by light grey bars, and males by dark grey bars.
Design and Mechanical Properties of the Seat
The design and mechanical properties of the seat and seatback affect the whiplash injury risk. From the 1960´s to the 1990´s the seatbacks have increased up to 5.5-fold in strength in order to increase the vehicle crashworthiness in high-speed rear impacts (Viano 2008). It is assumed to be one of the reasons for the increase in whiplash injuries since the late 1960´s, especially for females (Viano 2003). Yielding or collapsing of the seatback (and/or seat track failure) have been reported to decrease the whiplash injury risk in rear impacts (Kihlberg 1969; States et al. 1969; O’Neill et al. 1972; Thomas et al. 1982; Foret-Bruno et al. 1991; Parkin et al 1995; Morris & Thomas 1996; Krafft et al. 2004; Jakobsson et al. 2004b, 2008). Thomas et al. (1982) concluded that “damaged seat-back or seat track failure have a greater effectiveness than head restraint, considering cervical pain reduction” and that “seat damage is effective for females only and reduces their whiplash injury risk by 45 percent”. Parkin et al. (1995) found that the AIS1 neck injuries were approximately twice as frequent in an undamaged seat than in a yielding seat. Krafft et al. (2004) found an 84 percent injury reducing effect on the long-term whiplash injury risk in a study where 8,000 cars fitted with poor head restraint geometry were redesigned to include yielding seat attachment brackets, the only design change made to the cars.
Occupant Related Factors
Apart from gender, the whiplash injury risk has been shown to be influenced by stature, age, initial position, and the awareness of an impending impact. The whiplash injury risk generally shows an increasing trend for increasing statures for both males and females (Kihlberg 1969; Temming & Zobel 1998; Lundell et al. 1998; Jakobsson et al. 2000). When male and female drivers of the same statures were compared in these studies, the injury risk were two times higher for the females. The risk of whiplash injury seems to peak in middle age, and decrease in older age (Jakobsson et al. 2000; Farmer et al. 1999; Temming & Zobel 1998). Awareness of an impending impact decreases the long-term whiplash injury risk according to Sturzenegger et al. (1995) and Dolinis (1997), while Minton et al. (1997) could not find such a correlation. Rotating the head during an impact resulted in a higher incidence of persistent symptoms following an impact (Sturznegger et al. 1995; Jakobsson 2004b). The mass of the occupants appear to have little effect on the whiplash injury risk (States et al. 1972; Minton et
1.3 THE ANATOMY AND RANGE OF MOTION OF THE NECK
The spine – or the vertebral column – is formed by a series of bones; the vertebrae (Figure 7). The vertebrae are grouped under the names cervical, thoracic, lumbar, sacral, and coccygeal spine according to the regions of the spine they occupy. The neck – or the cervical spine – is formed by seven vertebrae, denoted C1–C7. The topmost vertebra, C1 (atlas), together with the vertebra immediately beneath, C2 (axis), forms the joint connecting the spine to the occipital bone of the skull. The cervical spine is relatively mobile compared to other parts of the spine, but the movement of rotating the head to left and right occur almost entirely at the C1–C2 joint; the atlanto-axial joint. Similarily, the action of tilting the head take place predominantly at the joint between C1 and the occipital bone; the atlanto-occipital joint. The undersurface facets of the occipital bone is called the occipital condyles (OC).
The majority of the vertabrae consist of a front segment – the vertebral body – and a rear segment – the vertebral arch – which enclose the vertebral foramen. The two topmost cervical vertebrae, C1 and C2, have a somewhat different structure in order to increase the range of motion of the head. The spinous and transverse processes serve as attachment points for muscles and ligaments.
These muscles and ligaments account for stability and movement, especially of the head and the neck (Schmitt et al. 2004). When the vertebraes articulate with each other, the bodies form a pillar supporting the head and the vertebral foramen constitute a canal for the protection of the vulnerable spinal cord. Cervical vertebrae contain transverse foramina to allow the vertebral arteries to pass through on their way to the foramen magnum, finally ending in the circle of Willis – a circle of arteries that supply blood to the brain.
There are two facet joints between each pair of cervical vertebrae from C2 to C7. The facet joint is a synovial joint enclosed by a thin, loose ligament known as the facet capsule (Siegmund et al. 2009). Adjacent vertebrae are separated by intervertebral discs.
Differences in the anatomy and physiology of the neck have been reported for males and females, which may contribute to the higher whiplash injury risk for females. For example, it has been reported that:
- the female neck muscles have a lower strength than male neck muscles (Vasavada et al. 2001; Vasavada et al. 2008; Foust et al. 1973). Vasavada et al. (2001) reported, based on measurements on 11 males and 5 females, that the males had 2–2.5 times greater moment-generating muscle capacity than the females. Vasavada et al. (2008) studied differences in head and neck geometry and neck strength in 14 pairs of male and female subjects matched for standing height and neck length. It was found that female necks had significantly lower strength than male necks; 20 percent lower in extension and 32 percent lower in flexion. They also concluded that the females had 33 percent more head mass per unit neck muscle area
Figure 7. a) Human cervical spine segment. b) Human cervical spine vertebra. Pictures courtesy of Wikimedia.
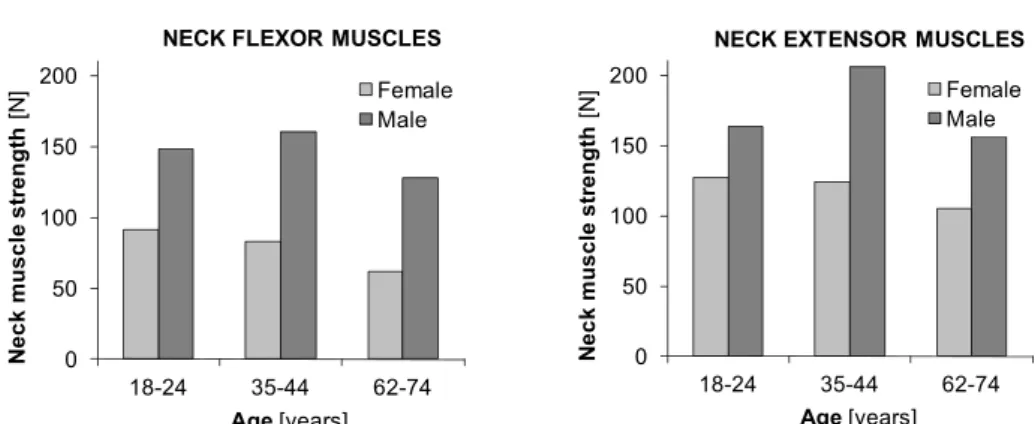
than equivalent sized males. Foust et al. (1973) found that the average neck flexor and extensor muscle strength in males is greater than that in females in each age and stature group. Females tend to decrease gradually in neck strength throughout their lives, while males are often stronger at middle age than they were when young (Figure 8).
0 50 100 150 200 18-24 35-44 62-74 N e c k musc le s tr e ngt h [N ] Age[years] Female Male
NECK FLEXOR MUSCLES
0 50 100 150 200 18-24 35-44 62-74 N e c k mu scl e st re n g th [N ] Age[years] Female Male
NECK EXTENSOR MUSCLES
Figure 8. The strength of a) flexor b) extensor neck muscles in degrees for females (shaded light grey) and males (shaded dark grey) of the same size, for different age categories, based on Foust et al. (1973).
- females have faster reacting neck muscle reflexes than males (Foust et al. 1973, Siegmund et al. 2003). Foust et al. (1973) stated that “…on average, females reflex about 11% faster than males, but are only 60% as strong”.
- females have smaller neck circumference (Vasavada et al. 2001), and more slender necks than males (Vasavada et al. 2008).
- females have smaller necks relative to the head size (1:151) compared to males (1:135) (States et al. 1972) (ratio = head circumference3/neck circumference2).
- females have smaller vertebral dimensions than males (DeSantis Klinich et al. 2004; Stemper et al. 2008; Vasavada et al. 2008). DeSantis Klinich et al. (2004) concluded that ‘‘there are differences in vertebral size associated with gender that do not solely result from the stature differences between men and women.’’ Stemper et al. (2008) performed computed tomography scans of the cervical spine on equivalently sized young healthy male and female volunteers. Geometrical dimensions were obtained at the C4 level. It was found that all geometrical measures were greater in males. Vertebral width and disc-facet depth were significantly greater in males. Additionally, segmental support area, combining interfacet width and disc-facet depth, was greater in males, indicating more stable intervertebral coupling. Vasavada et al. (2008) reported similar results in their study.
- females and males have different neck motion ranges (pages 10–11).
- females have decreased collagen content and increased elastin content in lumbar ligaments compared to males (Osakabe et al. 2001). Differences in structural components of the ligament may lead to decreased stiffness in female spines (cited from Stemper et al. 2008). Nightingale et al. (2007) found that ”the male upper cervical spine was significantly stiffer than the female and significantly stronger than the female in flexion”.
- female tolerance limits for lower neck shear force (384 N) is considerable lower than male tolerance limits (636 N) (Stemper et al. 2007).
- females have a narrower spinal canal than males (Pettersson et al. 1995; Tatarek 2005). In the study by Pettersson et al. (1995) it was found that the spinal canal was significantly smaller in whiplash patients with persistent symptoms. Differences were found between males and females; the spinal canal was significantly narrower for the females. Tatarek (2005) found that females had a narrower spinal canal compared to males based on measurements of the
For more detailed reviews of the anatomical and physiological differences of the neck for males and females, see Mordaka (2004), Vasavada et al. (2008), and Stemper et al. (2008).
Extension
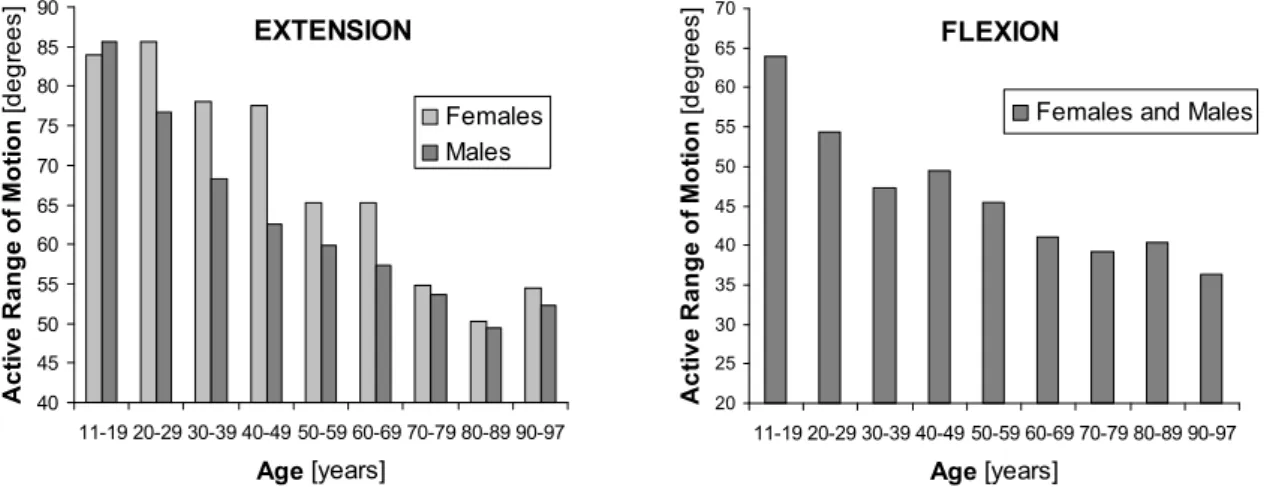
The shape of the neck that occurs when the head is angled rearwards relative to the torso is called an extension of the neck (Figure 9). In a study by Youdas et al. (1992) it was found that the Active Range of Motion (AROM) of neck extension was largest for young people, and that the AROM of neck extension was decreasing as the age increased (Figure 11a). At 11-19 years of age the AROM of neck extension was ~85° from the neutral position, while at 80-89 years of age it was reduced to ~50° from the neutral position. The females had a significantly larger AROM of
neck extension at 20-69 years of age compared to the males. The most pronounced difference was found at 40-49 years of age, with a 24 percent greater AROM of neck extension for the females (Figure 11a).
Flexion
The shape of the neck that occurs when the head is angled forward relative to the torso is called a flexion of the neck (Figure 10). The neck flexion motion is normally limited by the chest. In a study by Youdas et al. (1992), the neck flexion was found to be significantly associated with age, but the annual rate of loss and the number of degrees of AROM at a given age were not found to differ for male and female subjects. For male and female test subjects of the same age, the AROM of neck flexion was estimated to be
the same (Figure 11b). Seacrist et al. (2009), on the other hand, found a statistically significant increase in the cervical spine flexion angle in adult females compared to adult males. A decrease in flexion angle was also found for increasing age in that study.
40 45 50 55 60 65 70 75 80 85 90 11-19 20-29 30-39 40-49 50-59 60-69 70-79 80-89 90-97 Age [years] Act ive Range of M o ti on [d e g re e s] Females Males EXTENSION 20 25 30 35 40 45 50 55 60 65 70 11-19 20-29 30-39 40-49 50-59 60-69 70-79 80-89 90-97 Age [years] A c ti ve Range of M o ti on [degr e es ]
Females and Males FLEXION
Figure 11. a) The AROM of neck extension (in degrees) for females and males for different age categories. b) The AROM of neck flexion in degrees for females and males for different age
categories. Based on Youdas et al. (1992). Females are represented by light grey pillars and males by dark grey bars.
a) b)
Figure 9. Extension of the neck. Adapted from Linder (2001).
Figure 10. Flexion of the neck. Adapted from Linder (2001).
Retraction
The shape of the neck that occurs when the head is moved rearward relative to the torso, with no angular change, is called a retraction of the neck (Figure 12). The upper part of the neck is flexed and the lower part is extended during a retraction, which results in an S-curvature of the neck.
In static tests, Jonsson (2007) did not find any significant differences between males and females in cervical retraction capacity.
In dynamic tests, a more pronounced S-curved shape of the
neck for females compared to males have been reported (Stemper et al. 2003; Ono et al. 2006). Stemper et al. (2003) performed rear impact tests comprising ten intact PMHS head–neck complexes (5 males, 5 females) and the intervertebral kinematics were analysed as a function of spinal level at the time of maximum cervical S-curvature. Segmental angles were significantly greater in female specimens at C2–C3, C4–C5, C5–C6, and C6–C7 levels. In the study by Ono et al. (2006) six human volunteers (4 males, 2 females) were subjected to rear impacts at 6 km/h. The dynamic response of the neck was monitored by a high speed x-ray camera. The cervical vertebral rotation angle of females was higher than that of the males, and the females´ cervical spine exhibited a more significant S-curved deformation.
Total Range of Motion
The total range of extension–flexion motion (Figures 9–10) is greater for females compared to males (Buck et al. 1959; Foust et al. 1973). Buck et al. (1959) reported that the total range of extension–flexion motion was 150° for 18–23 years old females, while is was 139° for males in the same age group. Foust et al. (1973) studied the total range of extension–flexion motion for males and females with regards to age (Figure 14a). Age had a pronounced effect, but the females tended to lose mobility gradually throughout their lives, while the males deteriorated more rapidly between youth and middle age than they did later in life.
The total range of retraction–protraction motion (Figures 12–13) is less for females compared to males in seated posture (Hanten et al. 1991; Hanten et al. 2000). Hanten et al. (1991) studied the total range of retraction–protraction motion for males and females with regards to age (Figure 14b). For the males, the range of motion increased until 50 years of age before it started to decrease, while for the females the range of motion had a small increase until 40 years of age before the decrease started. According to Hanten et al. (2000) the total range of motion was 10.0 cm
for females, and 12.8 cm for males. It is unclear whether the greater motion range for the males was due to differences in stature/size between the males and females in these studies.
Hanten et al. (1991) reported that within their available retraction–protraction excursion range, females held their heads in a more forward position. Mean percentage distance from retracted to resting head postion was 47 percent for females and 43 percent for males. Similar results were found in Hanten et al. (2000) with 43.4 percent for the females and 39.5 percent for the males.
Figure 13. Protraction of the neck. Adapted from Linder (2001). Figure 12. Retraction of the neck. Adapted from Linder (2001).
1.4 REAR IMPACT DYNAMIC RESPONSE
During a rear impact, the car is exposed to a forward acceleration causing a sudden velocity change. How this sudden increase in velocity of the vehicle affects the motion of the head and neck of the occupant is illustrated in Figure 15.
Figure 15. The whiplash motion of the head and neck during a rear impact. a) Normal position. b) Retraction of the neck. d) Extension of the neck. d) Flexion of the neck. The pictures are adapted from Linder (2001).
In the normal position, the neck has a slight curvature, a lordosis (Figure 15a). When the vehicle is pushed forward by the impacting car, the torso of the occupant will be pressed forward by the seatback while the head remains in the same position due to the inertia. This relative motion of the head and torso leads to a retraction of the neck. At the same time the natural curvature of the spine will be straightened, resulting in a contraction of the neck (Figure 15b). During the retraction phase the neck becomes exposed to significant mechanical loads before the head actually reaches the head restraint. The retraction of the neck may be limited by the design and mechanical properties of the seatback and head restraint. As the torso of the occupant is pressed further forward, the head will tilt backwards and an extension of the neck will develop (Figure 15c). The presence of a well designed head restraint can prevent hyperextension of the neck, i.e. extension beyond its physiological limit. When the torso is
90 100 110 120 130 140 18-24 35-44 62-74 Age [years] To tal Rang e of Mo tion [de grees] Female Male EXTENSION - FLEXION 9 10 11 12 13 20-30 31-40 41-50 51-60 Age [years] Total Range of Motion [c m ] Females Males RETRACTION - PROTRACTION
Figure 14. a) The total range of extension–flexion motion of the neck (measured in degrees) for different age categories. Based on Foust et al. (1973). b) The total range of retraction–protraction motion of the neck (measured in cm) at different age categories. Based on Hanten et al. (1991). Females are represented by light grey pillars and males by dark grey pillars.
a) b) c) d)
pushed away from the seatback, the neck may be exposed to additional loads if the head lags behind. The forward motion of the torso is stopped by the seat belt, but the head will continue forward, resulting in flexion of the neck (Figure 15d).
The acceleration of the body parts can exceed the acceleration of the vehicle (Severy et al. 1955; Eichberger et al. 1996; Szabo & Welcher 1996 among others). Figure 16 shows an example from a volunteer test at 8 km/h (Siegmund et al. 1997). In this test the head acceleration was more than two times greater than the vehicle acceleration. Typically, there is a delay between the acceleration of the vehicle and the subsequent acceleration of the T1 and head. The vehicle acceleration starts first, then the T1 acceleration, and finally the head acceleration, depending on the interaction of the head and torso with the head restraint and seatback. 0 20 40 60 80 0 50 100 150 200 Time [ms] Vehicle T1 Head X-accel er ati o n [m/s 2 ]
Figure 16. The acceleration of the vehicle, T1, and head during a volunteer test in 8 km/h (Siegmund et al. 1997).
1.5 INJURY MECHANISMS AND INJURY SITES
The term ‘whiplash’ is a description of the head/neck motion that causes neck injury, but is often used as a vague diagnosis for ‘injury in the neck region’. Since whiplash injuries are located in the soft tissues of the neck, it is not possible to detect them by using diagnostic tools like X-rays or Magnetic Resonance Imaging (MRI). Due to the complicated structures of the neck, it is therefore difficult to decide the location of the injury and the cause of the symptoms. There are several different theories for the injury sites and the injury mechanisms, Figure 17. Possible injury sites may be facet joint, disc, muscle, ligament, artery, Central Nervous System (CSN), or dorsal nerve root ganglion, while the injury mechanisms may be abnormal vertebra motion, excessive neck loads, local hyperextension/flexion, or pressure pulses in the spinal canal.
Figure 17. Examples of possible injury sites and injury mechanisms. Based on lecture notes by Johan Davidsson, Chalmers University of Technology, Sweden.
An early whiplash injury theory for rear impacts was hyperextension of the neck (Figure 15c). Since the injury reducing effect of head restraints was limited (Page 5), the research focus was shifted from neck hyperextension towards other possible injury mechanisms, mainly during the retraction (S-curvature) phase (Figure 15b).When the neck exceeds the physiological limit of retraction during rear impacts, the neck becomes exposed to significant mechanical loads. Since many head restraints were positioned too far behind the back of the head to prevent the neck from reaching maximum retraction, this was a possible explanation why head restraints did not offer better neck injury reducing effect. Studies supporting this theory have been reported, for instance, Mertz & Patrick (1971) reported a study comprising one volunteer exposed to substantial velocity changes and accelerations in several tests without suffering serious whiplash symptoms. This was possible due to the volunteers being in contact with the seatback and head restraint from the beginning of the tests so that the retraction motion was minimised. Deng et al. (2000) performed rear impact PMHS tests using a high-speed X-ray to obtain cervical vertebral motions. Substantial facet joint strains were found before the head contacted the head restraint.
Aldman (1986) suggested that whiplash injuries may be caused by transient pressure gradients induced between the inside and outside of the spinal canal due to the rapid motion changes of the head/neck during an impact. These pressure gradients may directly load the spinal nerve roots, potentially leading to whiplash-related symptoms like neck pain, headache, vertigo, blurred vision, and neurological symptoms in the upper extremities. Biological tests performed by Svensson et al. (1993a) and Örtengren et al (1996) supported this theory. Using Computational Fluid Dynamics (CFD) modelling, transient pressure patterns from earlier whiplash experiments on animals and PMHSs were simulated with a suitable selection of the model flow properties (Svensson et al. 2009).
Two injury mechanisms of the facet joint have been proposed; pinching of the synovial fold (Ono et al. 1997; Kaneoka et al. 1999), and excessive strain of the capsule (Luan et al. 2000; Pearson et al. 2004). There are strong clinical evidence of facet-mediated neck pain (Barnsley et al. 1993; Bogduk & Marsland 1988; Aprill & Bogduk 1992) and Barnsley et al. (1994) claimed that cervical facet joints are the most common source of neck pain. Injuries to the neck ligaments and intervertebral discs in addition to the facet joints have been documented by MRI
Symptoms Facet joint ? Disc ? Muscle ? Ligament ? Artery ? CSN ? Dorsal nerve root ganglion ?
?
Abnormal vertebra motion ? Excessive neck loads ? Local hyperextension/ flexion ? Pressure pulses in the spinal canal ??
?
?
?
?
Symptoms Symptoms Facet joint ? Disc ? Muscle ? Ligament ? Artery ? CSN ? Dorsal nerve root ganglion ??
Abnormal vertebra motion ? Excessive neck loads ? Local hyperextension/ flexion ? Pressure pulses in the spinal canal ??
?
?
?
?
scans and autopsy studies in patients suffering whiplash (Jonsson et al. 1991; Kaale et al. 2005). Ligament injuries may cause acute neck pain and lead to chronic spinal instability (Siegmund et al. 2009). Subfailure injuries of ligaments (spinal ligaments, disc annulus and facet capsules) may cause chronic back pain due to muscle control dysfunction (Panjabi 2006). Altered blood flow due to spasm and/or narrowing of vertebral arteries in whiplash patients have been associated with chronic symptoms like headache, blurred vision, tinnitus, dizziness, and vertigo (Seric et al. 2000; Reddy et al. 2002; Linnman et al. 2009).
Symptoms radiating from muscles are common among patients suffering whiplash. It was suggested by Siegmund et al. (2009), that direct muscle injury may not be responsible for chronic whiplash pain, but may play an indirect role in modulating pain caused by injuries to other structures. Neck muscles potentially interact with other anatomical sites of whiplash injury in at least three ways: (1) neck muscles attach directly to the facet capsule, which has been implicated in chronic pain following whiplash; (2) neck muscle activation indirectly affects the loads and strains in other anatomical structures; and (3) altered neuromuscular control may contribute to chronic pain via elevated and inapproprate muscle activation (Siegmund et al. 2009).
For a detailed review on the theories of whiplash injury sites and mechanisms, see Siegmund et al. (2009).
1.6 INJURY CRITERIA AND THRESHOLDS
An injury criterion is a function of physical parameters that can be measured in a crash test dummy, for instance, and that correlates with risk of injury for a certain body region. Generally, injury criteria are proposed and validated, based on experimental studies and they are important tools for research, development, and evaluation of safety systems. Here follows a brief summary of the proposed neck injury criterion. For a more detailed description, see Schmitt et al. (2004).
The Neck Injury Criterion (NIC)
The Neck Injury Criterion (NIC) was proposed by Boström et al. (1996) and is based on the pressure gradient hypothesis formulated by Aldman (1986), and on the biological experiments by Svensson et al. (1993a) and Örtengren et al (1996). The NIC is calculated as
2
2 .
0 arel vrel
NIC= + Eq. (1)
where arel is the relative horizontal acceleration between T1 and the occipital joint and vrel is the horizontal velocity between T1 and the occipital joint. The NIC value is intended to be calculated at maximum retraction. In Boström et al. (2000) the NICmax was proposed, which is the peak NIC value during the first 150 ms. The NIC formulated to be used for the Hybrid III dummy is denoted NIC50. The tolerance level for NIC, NICmax, and NIC50 is 15 m2/s2.
Based on real-life accidents with crash recorders, in combination with mathematical simulations, Kullgren et al. (2003) found that NICmax is applicable to predict risk of whiplash injury when using a BioRID dummy. For NIC=15 a ~20 percent risk of neck injury lasting more than 1 month was reported. Linder et al. (2004) reconstructed real-world rear impact crashes using sled tests with known injury outcomes in terms of neck injury symptoms of front seat occupants. The results indicated that the risk for whiplash symptoms persisting more than one month was less than 10 percent for NICmax<16.7.
The N
ijCriterion
The Nij injury criterion was proposed by the US National Highway Traffic Safety Administration (NHTSA) to assess severe neck injuries in frontal impacts, including those with airbag deployment (DeSantis Klinch et al. 1996; Kleinberger et al. 1998). It combines the effects of force and moment measured at the occipital condyles and is based on both the tolerance levels for axial compression and bending moment. The Nij criterion is calculated by:
int y int z M M F F Nij = + Eq. (2)
where Fz represents the axial force and My represents the flexion/extension bending moment.
Fint and Mint are critical intercept values for the force and the moment, respectively. The
intercept values for the 50th percentile Hybrid III male are proposed to be Fint (tension) = Fint
(compression) = 4,500 N, Mint (tension) = 310 Nm, Mint (extension) = 125 Nm. Different
intercept values are used for other dummy sizes. Four different load cases can be obtained; Nte
for tension and extension, Ntf for tension and flexion, Nce for compression and extension, and
Ncf for compression and flexion. An injury threshold value of 1.0 applies for each load case
(Schmitt et al. 2004).
The N
kmCriterion
The Nkm criterion (Schmitt et al. 2002) was derived to assess neck injuries in rear impacts. It is
based on the Nij criterion, and combines moments and shear forces. The Nkm criterion is
calculated by int y int x
M
M
F
F
N
km=
+
Eq. (3)where Fx represents the shear force and My the flexion/extension bending moment obtained
from the upper neck load cell. Fint and Mint are critical intercept values for the force and the
moment, respectively. The intercept values are Fint (anterior) = Fint (posterior) = 845 N, Mint
(flexion) = 88.1 Nm, Mint (extension) = 47.5 Nm (Schmitt et al. 2002).
Four different load cases can be obtained; Nfa for flexion and anterior (positive) x-direction,
Nfp for flexion and posterior (negative) x-direction, Nea for extension and (positive) x-direction,
and Nep for extension and posterior (negative) x-direction. An injury threshold value of 1.0
applies for each load case.
Based on real-life accidents with crash recorders in combination with mathematical simulations, Kullgren et al. (2003) found that Nkm is applicable when predicting whiplash
injury risk whilst using a BioRID dummy. A ~20 percent risk of neck injury lasting more than one month was reported for Nkm =0.8. In sled tests, based on reconstructed real-world rear
impact crashes with known injury outcomes, Linder et al. (2004) found that the risk for whiplash symptoms persisting more than one month was less than 10 percent for Nkm<0.37.
The Intervertebral Neck Injury Criterion (IV-NIC)
The IV-NIC developed by Panjabi et al. (1999), is based on the hypothesis that a neck injury occurs when an intervertebral extension-flexion angle exceeds its physiological limits. It is defined as the portion of the intervertebral motion Θtrauma under traumatic loading and the physiological range of motion Θphysiological. The IV-NIC is calculated by:
i cal, physiologi i trauma, Θ Θ = −NIC IV Eq. (4)
There is no threshold value proposed for this criterion (Schmitt et al. 2004) and it can not be used in the existing crash test dummies.
The Neck Displacement Criterion (NDC)
The NDC, proposed by Viano & Davidsson (2001), is based on the angular and linear displacement response of the head relative to T1, obtained from volunteer tests. The criterion is given as corridors of the z- versus angular displacements, and x- versus angular displacements of the occipital condyle (OC) of the head relative to the T1. Working performance guidelines for the NDC in the Hybrid III and the BioRID for low speed rear impacts are proposed in four different categories; Excellent, Good, Acceptable and Poor. Kullgren et al. (2003) found that NDC is less applicable to predict whiplash injury risk when using a BioRID dummy. According to Schmitt et al. (2004), the NDC is currently under deliberatation, and the corridors cannot be regarded as definite yet.
The Lower Neck Load Index (LNL)
The Lower Neck Load Index (LNL) (Heitplatz et al. 2003), takes into account three force components and two moment components measured at the lower neck. The LNL is calculated by: 2 2 2 2 tension lower z shear lower x lower y moment lower x lower y C F C F F C M M LNL= + + + + Eq. (5)
Mi and Fi are the moment and force components, respectively. The intercept values are proposed to be Cmoment = 15, Cshear = 250, and Ctension = 900 for the RID dummy (Heitplatz et al. 2003).
1.7 WHIPLASH INJURY PROTECTION STRATEGIES
Improved seat design is thus the most common way to increase the protection of the occupant from whiplash injury during a rear impact. The strategy is to minimise the relative motion of the head and torso, i.e. to reduce the relative motion between each spinal segment, and to reduce accelerations and rebound motion. This can be accomplished by improving seat geometry and dynamic properties of the head restraint and seatback; by active devices that move in a crash as the body loads the seat; and by energy absorption in the seat. The protective performance of the seat can be seen in injury statistics. Since 1997, more advanced whiplash protection systems have been introduced on the market. The most prominent whiplash injury reduction systems are the Saab Active Head Restraint (SAHR), Volvo’s Whiplash Protection System (WhiPS), and Toyota’s Whiplash
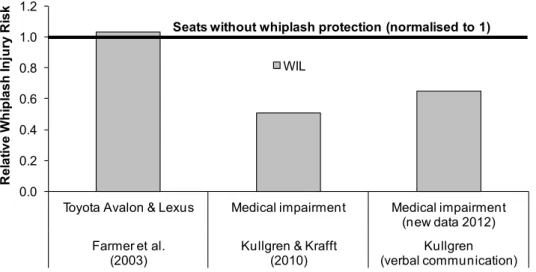
Injury Lessening (WIL) system. According to Kullgren et al. (2007) the relative risk of sustaining a whiplash injury leading to long-term symptoms is approximately 50 percent lower in cars fitted with more advanced whiplash protection systems in the seats, than in cars with standard seats launched after 1997. Compared to cars with standard
existing whiplash protection concepts are more effective for males than females, with 45 percent risk reduction of permanent medical impairment for females and 57 percent for males, according to insurance claims records (Figure 18) (Kullgren & Krafft 2010). I.e., the differences between females and males have increased even though the whiplash injury risk has decreased.
Saab Active Head Restraint (SAHR)
In 1997 (early 1998 in the USA), Saab introduced the SAHR system in the 9-5 model as a first application of crash activated systems to mitigate whiplash injuries. In addition to the active head-restraint, the SAHR system comprises design features in the seatback to control and distribute those loads on the occupant that are generated in rear impacts (Wiklund & Larsson 1998). The active head restraint is mounted to a pressure plate in the seatback by means of a spring-resisted link mechanism (Figure 19). When the seat pushes the occupant forward with more force than the spring can resist, the plate moves rearward into the seat. This forces the head restraint to move upward and forward, thus supporting the head before the relative motion between the head and the torso becomes significant (Wiklund & Larsson 1998). In 2002, the SAHR Generation II was introduced in the Saab 9-3 model. The main modification was that the pressure plate in the seatback was moved down to the lower back region, in order to induce an earlier movement of the head restraint.
Figure 19. The SAHR Generation I (to the left) and Generation II (to the right). Reprinted with permission by Stefan Olsen, Saab.
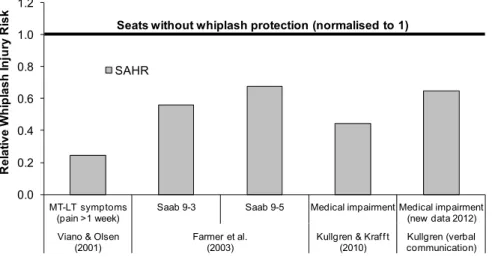
The injury reducing effect of the SAHR system has been evaluated by Viano & Olsen (2001), Farmer et al. (2003), Kullgren & Krafft (2010), and Kullgren (verbal communication 2012-03-14) and it ranges from 33 to 75 percent in these studies (Figure 20).
0.0 0.2 0.4 0.6 0.8 1.0 1.2 MT-LT symptoms (pain >1 week)
Saab 9-3 Saab 9-5 Medical impairment Medical impairment (new data 2012) Viano & Olsen
(2001) Farmer et al.(2003) Kullgren & Kraff t (2010) Kullgren (verbal communication)
R e la ti v e W h ip la s h In ju ry R is k SAHR
Seats without whiplash protection (normalised to 1)
Figure 20. The whiplash injury risk of the SAHR seat relative to seats without whiplash protection (normalised to 1). Based on data reported by Viano & Olsen (2001), Farmer et al. (2003), Kullgren & Krafft (2010), and Kullgren (verbal communication 2012-03-14).
Viano & Olsen (2001) reported that “women experienced Short Term (ST) neck pain at a 52 percent higher rate than men, and the incidence was more frequent in vehicles equipped with SAHR. However, no women reported Mid Term–Long Term (MT–LT) whiplash injury in SAHR vehicles”. Recent studie