P R IF Y S G O L B A N G O R / B A N G O R U N IV E R S IT Y
Regulatory Change and Capital Adjustment of US Credit Unions
Goddard, J.A.; Goddard, J.; McKillop, D.; Wilson, J.O.
Journal of Financial Services Research
DOI:
10.1007/s10693-015-0217-y
Published: 26/04/2015
Peer reviewed version
Cyswllt i'r cyhoeddiad / Link to publication
Dyfyniad o'r fersiwn a gyhoeddwyd / Citation for published version (APA):
Goddard, J. A., Goddard, J., McKillop, D., & Wilson, J. O. (2015). Regulatory Change and Capital Adjustment of US Credit Unions. Journal of Financial Services Research.
https://doi.org/10.1007/s10693-015-0217-y
Hawliau Cyffredinol / General rights
Copyright and moral rights for the publications made accessible in the public portal are retained by the authors and/or other copyright owners and it is a condition of accessing publications that users recognise and abide by the legal requirements associated with these rights.
• Users may download and print one copy of any publication from the public portal for the purpose of private study or research.
• You may not further distribute the material or use it for any profit-making activity or commercial gain • You may freely distribute the URL identifying the publication in the public portal ?
Take down policy
The final publication is available at Springer via http://dx.doi.org/10.1007/s10693-015-0217-y Take down policy
If you believe that this document breaches copyright please contact us providing details, and we will remove access to the work immediately and investigate your claim.
Regulatory Change and Capital Adjustment of US Credit Unions
xJohn Goddard, Bangor Business School, Bangor University a Donal McKillop, School of Management, Queen’s University Belfast b John O.S. Wilson, School of Management, University of St Andrews c+
Abstract
We investigate the determinants of US credit union capital-to-assets ratios, before and after the implementation of the current capital adequacy regulatory framework in 2000.
Capitalization varies pro-cyclically, and until the financial crisis credit unions classified as adequately capitalized or below followed a faster adjustment path than well capitalized credit unions. This pattern was reversed, however, in the aftermath of the crisis. The introduction of the PCA regulatory regime achieved a reduction in the proportion of credit unions classified as adequately capitalized or below that continued until the onset of the crisis. Since the crisis, the speed of recovery of credit unions in this category following an adverse capitalization shock was sharply reduced.
Keywords
Credit unions, Banking, Capital ratios, Pro-cyclical, Prompt Corrective Action, Regulation JEL G21, G18, G28
a Bangor Business School, Bangor University, Bangor, Gwynedd, LL57 2DG, UK. Tel: +44 1248 383221. Email: j.goddard@bangor.ac.uk
b Queen's University Management School, Queen's University Belfast, Riddel Hall, 185 Stranmillis Road, Belfast, Northern Ireland BT9 5EE, UK. Tel: +44 28 9097 4852. Email: dg.mckillop@qub.ac.uk
c School of Management, University of St Andrews, The Gateway, North Haugh, St Andrews, Fife, KY16 9SS, UK. Tel: +44 1334 462803. Email: jsw7@st-and.ac.uk
+
Address for correspondence: Professor John O.S. Wilson, School of Management, University of St Andrews, The Gateway, North Haugh, St Andrews, Fife KY16 9AJ, UK. Tel: +44 1334 462803. Fax: +44 1334 462812. e-mail: jsw7@st-andrews.ac.uk
x
The authors would like to thank an anonymous referee for extensive comments and suggestions on a previous draft of this paper. We also thank Christine Brown, Santiago Carbo Valverde, Rebel Cole, Bob DeYoung, Kevin Davis, Scott Frame, Michael Goldstein, Jens Hagendorff, Mohammad Kabir Hassan, Michael King, Phil Molyneux, Rob Nijskens, Steven Ongena, Matthew Osborne and Barry Quinn for useful comments and suggestions on a previous draft of this paper. The usual disclaimer applies.
Regulatory Change and Capital Adjustment of US Credit Unions
1. Introduction
During the 2000s (and especially since the onset of the financial crisis in 2007), the role of capital in minimizing the impact of unforeseen losses on the part of financial institutions has received widespread attention. In this paper we examine the capitalization of US credit unions. Credit unions are non-profit, cooperative financial institutions governed by their membership on a one-member-one-vote basis, with eligibility for membership defined by the credit union’s common bond. At the end of 2012, credit unions accounted for approximately 10% of all consumer savings and deposits in the US, servicing over 96 million members drawn from a wide cross-section of society.
Unlike other retail financial institutions, credit unions are not permitted to raise capital by issuing new equity. Over time, net worth accumulates through the retention of (tax exempt) earnings that are not distributed to members, in the form of dividends on share accounts, or favourable rates paid on deposit accounts, or subsidized rates charged on loans.1 This implies capital shortages cannot be rectified quickly, and suggests that the capital adjustment of credit unions may differ from that of commercial banks and non-financial firms.
Before 2000 US credit unions were not subject to any formal capital (net worth) requirements. In 1997, the US Treasury recommended that the National Credit Union Association (NCUA), the regulator, introduce specific net worth requirements in the form of
1 The tax exemption affords credit unions a competitive advantage over banks and other mutual financial services
providers, and has assisted the credit union industry in maintaining capitalization substantially higher than the minimum regulatory level (US Government Accountability Office, 2005). Large capital buffers might be maintained as a means of signalling strength to depositors or the regulator. The tax-exempt status of US credit unions has been justified by its proponents as a policy tool to tackle financial exclusion. An August 2010 report (and several previous reports) on tax reform suggests it might be appropriate for credit unions to be subject to corporate taxation (US Government Accountability Office, 2005; The President’s Economic Recovery Advisory Board, 2010).
defined minima for capital-to-assets ratios (US Treasury, 1997). Under a new Prompt Corrective Action (PCA) regime introduced in 2000, a range of mandatory and supervisory actions (such as restricting dividends paid to members and dismissing the credit union management) were applied to undercapitalized credit unions in order to restore net worth.
Under these regulatory arrangements, US credit unions have, in general, withstood the financial crisis of the late-2000s better than many banks (Smith and Woodbury, 2010).2 Nevertheless, the reported payouts of the National Credit Union Share Insurance Fund (NCUSIF) in respect of credit union failures were $985 million in 2008 and 2009 combined, $221 million in 2010, $54.9 million in 2011, and $207 million in the first half of 2012. In the light of these developments, an analysis of the capitalization of credit unions is highly relevant for the ongoing debate concerning the future regulation of financial institutions.
Utilizing credit union level semi-annual data compiled from Call Reports published by the NCUA for the period June 1994 to December 2012 and state-level macroeconomic data from the US Bureau of Economic Analysis, we estimate a panel sample-selection model, comprising a probit regression for the probability of survival for each credit union in each six-month period, and a fixed-effects regression for the change in the capital-to-assets ratio. This allows us to examine the capital-adjustment process, and the speed and pattern of recovery from any adverse capitalization shock. We also examine the effects of the PCA regime introduced in 2000 (by classifying credit unions by their capitalization and sub-dividing the observation period into relevant sub-periods), and the effects of credit union-specific and macroeconomic factors on capitalization. We subdivide the post-2000 period into two further sub-periods (2000-08 and
2 Historically, losses imposed on insurance funds have been lower for credit unions than for banks (Kane and
2009-12), in recognition of a sharp deterioration in credit union capitalization that followed the financial crisis.
Key empirical findings are as follows. Until the financial crisis, credit unions classified as adequately capitalized or below followed a faster adjustment path following an adverse capitalization shock than their well capitalized counterparts. This pattern was reversed, however, in the aftermath of the crisis. The introduction of the PCA regulatory regime coincided with a sustained reduction in the proportion of credit unions classified as adequately capitalized or below, which continued until the onset of the crisis. Since the crisis, credit union capitalization has deteriorated, and the speed of recovery of credit unions classified as adequately capitalized or below following an adverse capitalization shock has been sharply reduced. Increases in credit union lending naturally tend to reduce capitalization, which varies pro-cyclically. In the absence of any option to raise new capital in the form of equity, credit unions tend to manage their capital cautiously over the business cycle. The probability of survival is increasing in size, but decreasing in age. A high capital-to-assets ratio or a high loans-to-assets ratio increases the probability of survival, but a high liquid assets-to-total assets ratio reduces the probability of survival. During the late-2000s, large credit unions experienced a smaller reduction in their capitalization, on average, than small credit unions.
In summary, this study provides new insights into the factors that determine the capital held by credit unions, the relationship between state-level macroeconomic conditions and credit union capitalization, and the impact of a major regulatory change on capital management and capital adjustment. The rest of the paper is organized as follows. Section 2 describes the evolution of capital adequacy regulation of US credit unions. Section 3 reviews the literature on capital adequacy regulation and capital management for both banks and credit unions. Section 4
describes the empirical model, while Section 5 describes the data, and reports descriptive statistics. Section 6 reports and interprets the empirical findings. Finally, Section 7 concludes.
2. Capital adequacy regulation of credit unions
Capital requirements for credit unions are set by statute which requires Congress to revisit capital requirements as economic and financial conditions change (Wilcox, 2011). In 1934, Congress set capital requirements as a percentage of earnings to be added to reserves at the end of each year. In 1949, Congress allowed credit unions to forgo accumulating more capital once they met higher predetermined capital-to-deposit ratios. With the establishment in 1970 of share insurance for credit unions, Congress introduced a number of changes (the capital-to-deposit ratio was changed to a capital-to-assets ratio and the formula for the amount of capital to be set aside was altered from a fraction of net earnings to a fraction of gross earnings) that effectively lowered capital requirements.3 Not until the passage of the Credit Union Membership Access Act (CUMAA) in 1998 did Congress eventually enact minimum capital-to-assets requirements for credit unions. The introduction of a minimum capital-to-assets requirement was not a response to any crisis or emergency among credit unions, but rather it formed part of a wide-ranging overhaul of the credit union regulatory system.4
The PCA framework, included in Section 301 of CUMAA 1998 and implemented in August 2000, defines five categories of capitalization, in terms of the ratio of net worth-to-assets,
3 Insured credit unions are more highly capitalized, more liquid and take fewer risks than their non-insured
counterparts (Karels and McClatchey, 1999). By contrast, increased access to deposit insurance provides perverse incentives for banks to undertake riskier investments, increasing the probability of bank failure (O’Hara and Shaw, 1990).
4
In addition to establishing minimum capital-to-assets requirements, CUMAA 1998 grandfathered the fields of membership expansions that the NCUA had previously granted to credit unions, introduced restrictions on credit union member business lending and permitted conversion of credit unions into mutual savings banks. See Walter 2006 and Wilcox 2011 for an extended discussion.
denoted KA: well capitalized, KA7%; adequately capitalized, 6%KA6.99%; undercapitalized, 4%KA5.99%; significantly undercapitalized, 2%KA3.99%; and critically undercapitalized, KA<2%. Credit unions classified as well capitalized are free from supervisory intervention. Credit unions classified as adequately capitalized or below are required to take steps to restore net worth to adequate levels.5 Most credit unions are low risk, due to restrictions on their activities embodied in cooperative principles and the common bond. However, the system of PCA does not differentiate between high- and low-risk institutions. Consequently, low-risk credit unions may tend to hold excessive amounts of capital. Since credit unions cannot issue equity and do not have access to supplemental capital the current system leaves credit unions exposed to automatic regulatory PCA intervention if there is an unexpected large growth in assets that outweighs any increase in net worth. This was evidenced in 2001, when financial market uncertainty resulted in large outflows of funds from stock and bond markets, and a consequent increase in credit union deposits. The pressure on capitalization caused some credit unions to reduce their assets base (by reducing lending), convert to community banks (where there is greater flexibility in raising capital) or merge with more strongly capitalized credit unions.6
In 1994 the proportion of credit unions classified as adequately capitalized or below (post-2000 terminology), with capital-to-assets ratios below 7%, was as high as 8.3%. In anticipation of the new regulatory arrangements, the proportion of credit unions classified as
5 The CUMAA specifies mandatory actions for credit unions that do not meet capital adequacy standards. These
include: annual earnings retentions of at least 0.4% of total assets; the submission and adherence to a net worth restoration plan (NWRP); lending restrictions; and the prohibition of increases in assets until net worth is restored. The CUMAA allows the NCUA to use 14 supervisory actions to supplement the mandatory actions.
6
Wilcox (2011), analysing the recent crisis period, argues that as a result of capital pressures many credit unions have been forced to limit their traditional role as safe harbours for depositors, accommodating less deposit growth than during and after past recessions, and reducing their lending substantially. In addition some credit unions have been forced to ask large depositors to temporarily shift their deposits elsewhere.
adequately capitalized or below fell to 3.2% in 1999, and reached a low of 1.4% in 2007. There was a sharp increase to 5.2% in 2009, which has since been partially reversed through a reduction to 3.6% in 2012. Capitalization is inversely related to asset size: in 2012 the average capital-to-assets ratio of the largest 10% of credit unions was 10.5% compared to 19.4% for the smallest 10% of credit unions. Jackson (2007) suggests that in comparison with banks, US credit unions in general are overcapitalized.
The US Senate (December, 2010) instructed the Government Accountability Office to evaluate the effectiveness of the NCUA’s regulatory arrangements, for both insured credit unions and corporate credit unions. The ensuing report concluded that the NCUA should consider additional triggers for PCA that would require early and forceful regulatory action and make recommendations to Congress for the modification of PCA (US Government Accountability Office, 2012).7 In 2013, legislative amendments have been proposed to allow credit unions to manage their balance sheets more effectively. H.R. 2572, the ‘Regulatory Relief for Credit Unions Act of 2013’ calls for the introduction of a risk-based regulatory system, which effectively reduces the level of required capital. H.R. 719, the ‘Capital Access for Small Businesses and Jobs Act of 2013’ provides for additional capital flexibility with federal credit unions permitted to receive payments on uninsured, non-share capital accounts, provided the accounts are offered by a credit union that is sufficiently well capitalized.
7 US Government Accountability Office (2011) notes that the effectiveness of PCA for banks was limited because of
its reliance on capital, which can lag behind other indicators of financial health. Problems with a bank’s assets, earnings or management typically manifest before these problems affect capital levels. Consequently, once an institution falls below PCA capital standards, it may be unable to recover regardless of the regulatory action imposed.
3. Literature review
Marcus (1981) examines the determinants of capital-to-assets ratios for US banks for the period 1965-77, using a partial-adjustment model.8 Target capital-to-assets ratios depend on regulatory pressure. Using a simultaneous-equations model, Shrieves and Dahl (1992) examine the relationship between leverage, capital requirements and risk for the period 1983-87, and report a positive relationship between capital and risk. Banks operating below the regulatory minimum capital-to-assets ratio (at that time 7%) increased their capital more quickly than those operating above the minimum. Jacques and Nigro (1997) examine the impact of risk-based capital standards for US banks introduced in 1991, during their first year of enforcement, when capitalization was increased and exposure to risk was reduced.
Aggarwal and Jacques (2001) examine the impact of PCA on bank capitalization and portfolio risk. During the period 1990-93 capital-to-assets ratios increased and risks were reduced following the introduction of new capital standards and PCA. Undercapitalized banks adjusted faster than those that were adequately capitalized. Berger, DeYoung, Flannery, Lee and Oztekin (2008) model the capital adjustment of US publicly-traded bank holding companies (BHC) for the period 1992-2006. BHCs set target capital levels substantially above the regulatory minima and BHCs with relatively weak capitalization adjust rapidly towards their targets.9
8 The influence of firm-specific, industry, legal and institutional factors on the capital structure of non-financial
firms in the US and elsewhere is examined by Rajan and Zingales (1995), MacKay and Phillips (2005), Flannery and Rangan (2006), Lemmon, Roberts and Zender (2008), Cook and Tang (2010), Hovakimian and Li (2011), and Oztekin and Flannery (2012).
9 Outside the US, Brewer, Kaufman and Wall (2008) find that the capitalization of the largest international banks
during 1992-2005 was highest in countries with effective corporate governance laws, and where PCA was enforced. Gropp and Heider (2010) report that the market-to-book ratio, profitability and asset size are important in determining the capital structure of large US and European banks during the period 1991-2004. Regulatory constraints are of less importance than market variables in determining capital structure.
Recent attention has focused on the role of capital buffers in absorbing shocks arising from unanticipated changes in credit risk. Bank lending is pro-cyclical, but credit risk is counter-cyclical: defaults tend to increase during economic downturns. The lending practices of banks may contribute to upturns (relaxed credit standards and excessive lending) and downturns (tighter credit standards, and increased capitalization to mitigate insolvency risk). Capital regulation that requires banks to increase capitalization during downturns may accentuate this effect.10 Alternatively, banks could target lower capitalization during downturns in order to maintain lending relationships, at the cost of increasing default probabilities (Berger, DeYoung, Flannery, Lee and Oztekin, 2008).
A few studies examine the impact of capital regulation for credit unions.11 Jackson (2007) examines the capitalization of US credit unions during the period 1990-2006. The average capitalization at the end of 2006 was 11.6%, four percentage points higher than the corresponding figure in 1990. Using bank capitalization as a benchmark, Jackson suggests that credit unions were overcapitalized by 30-40% (between $8.8 billion and $11.7 billion) in 2006. Smith and Woodbury (2010) compare the financial stability of US banks and credit unions during the period 1986-2009. Credit unions are less sensitive to the business cycle than banks. The balance sheets of both tend to deteriorate when unemployment rises, but the trajectory and magnitude of delinquencies and charge-offs at banks are more pronounced. This suggests that in order to account for this lower risk, capital ratios for credit unions could be reduced relative to their banking counterparts.
10 According to Cook and Tang (2010), the impact of macroeconomic conditions on the dynamics of capital
adjustment has been neglected in the empirical literature.
11 Bogan (2012) examines the link between capital structure and operational self-sufficiency for microfinance
institutions located in Africa, East Asia, Eastern Europe, Latin America, the Middle East and South Asia for the period 2003-2006.
Hillier, Hodgson, Stevenson-Clarke, and Lhaopadchan (2008) examine the responses of Australian credit unions during the period 1987-94 to the imposition of new capital adequacy regulations. There is evidence that accounting window-dressing techniques were used to adjust reported capital ratios. Brown and Davis (2009) examine the capital management of Australian credit unions during the period 1993-2006. Some credit unions managed their capitalization by setting a short-run target for return on assets, with the intention of gradually eliminating discrepancies between actual and desired capital ratios.
4. Empirical model specification
An important feature of the empirical model used in this study is the inclusion of a control for survivorship bias in the capital-adjustment equation. Capital adjustment in each period is observed only for those credit unions that survive, but capitalization is expected to be a key determinant of the probability of survival, creating a non-zero expectation conditional on survival for the disturbance term of the capital-adjustment equation. Attrition features prominently in the recent corporate demography of US credit unions, with the total number of institutions having decreased by over one-third during the 1994-2012 observation period for this study. Accordingly, we estimate the capital-adjustment equation using the Heckman (1979) sample-selection model, including a probit regression for the probabilities of survival or disappearance for each credit union in each six-month time period.12
The data used in the present study is of exceptionally high quality, providing virtually 100% coverage of the US credit union industry, excluding privately-insured credit unions, over a
12
This approach addresses a shortcoming of a recent analysis of the capital dynamics of non-financial firms: “A more thorough investigation of the survivorship issue would entail a model of firm exit and an appropriate identification strategy, i.e. instrument(s), to disentangle the exit decision from the capital structure decision … a potentially fruitful area for future research” (Lemmon, Roberts and Zender, 2008, p1581).
19-year period. We are able to track attrition in the population to a very high level of accuracy, with a cause of disappearance being identified for 99.4% of all non-survivors, and the acquiring credit union being identified for 98.8% of credit unions that exited as a result of acquisition (which account for 89.9% of all exits). For credit unions that were involved in M&A transactions in any six-month period as acquirers, we are able to adjust the lagged variables used in the capital-adjustment equation by creating lagged values for a ‘synthetic’ credit union based on the aggregate net worth of the acquirer and the acquired credit union.
The availability of data both before and after the introduction of the current regulatory arrangements for PCA in 2000 enables us to identify the effect of this major regulatory change on the capital adjustment of US credit unions. The empirical model incorporates coefficients that reflect the speed and time-path of capital adjustment, before and after this regulatory event and during the aftermath of the financial crisis of the late-2000s. Impulse response functions are employed to identify the adjustment paths of well capitalized credit unions, and credit unions classified as adequately capitalized or below.
The specification of the capital-adjustment equation allows for different intercepts and different patterns of dependence of ki,t on ki,t–1 and ki,t–m (for m=1,2) for credit unions that were well capitalized (ki,t–10.07) and those that were adequately capitalized or below (ki,t– 1<0.07), for each of three sub-periods: 1995-2000 (before the introduction of PCA); 2000-08 (from the introduction of PCA to the financial crisis); and 2009-12 (in the aftermath of the financial crisis).
The specification of the empirical model is as follows. Survivorship equation: s s s,i,t 1 t , i 7 1 t , i 6 1 t , i 5 1 t , i 4 1 t , i 3 1 t , i 2 1 t , i 1 * t , i s k q n x e a D y [1]
Capital-adjustment equation: ki,t = intercept + 6 1 j i,t 2 11 i,t 1 12 i,t 2 j 12 1 t , i j 11 1 t , i j 1 j t , i ( k k k ) c c I t , i i 2 t , i 42 1 t , i 41 2 t , i 32 1 t , i 31 2 t , i 22 1 t , i 21n n e e g g [2]
In [2], vi,t ~ N(0,2v); and i is an individual effect specific to credit union i. Conditional upon credit union i having been live at time t–1, credit union i survived until time t and ki,t was observed, if y* ui,t 0
t ,
i , where ui,t ~ N(0,1). Credit union i failed to survive to time t if 0
u
y*i,t i,t .
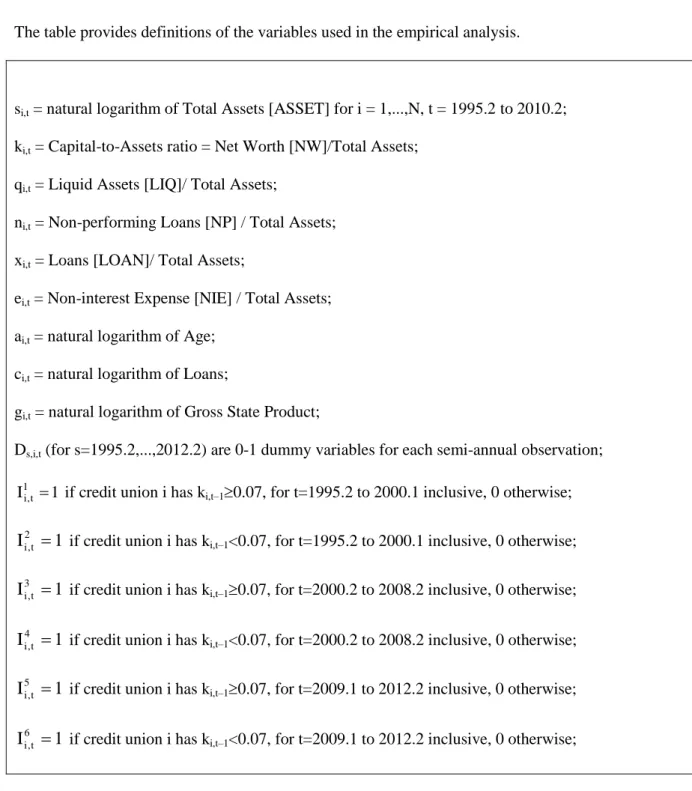
Survivorship depends on assets size (s), capitalization (k), liquidity (q), non-performing loans ratio (n), loans-to-assets ratio (x), non-interest expenses-to-assets ratio (e) and age (a). The change in capitalization (k) depends on growth in loans (c), change in the non-performing loans ratio (n), change in the ratio of non-interest expenses-to-assets (e) and growth in gross state product (g).13 Table 1 lists the variable definitions in full.
Conditional on ki,t–1 having been observed, ki,t is observed with probability (y*i,t) and unobserved with probability 1(y*i,t), where and are the density function and distribution function of the standard normal distribution. The issue of survivorship bias in the fixed-effects capital-adjustment equation arises because the dependent variable is observed only for credit unions that survived each six-month period. Unobservables that influence the capital-to-assets ratio might also influence the survival probability, rendering the disturbance term of the capital-adjustment equation non-random in the absence of a sample-selection correction. A non-random
13
Goddard, McKillop and Wilson (2002) and Wilcox (2005a,b; 2006) report evidence that larger credit unions are more efficient and more robust than their smaller counterparts. Goddard, McKillop and Wilson (2009) examine the determinants of credit union acquisition. Wheelock and Wilson (2011) suggest that future deregulation permitting credit unions to expand their range of activities will lead to further growth and efficiency improvements.
disturbance term implies the standard ordinary least squares or fixed-effects estimators will produce biased estimates of the coefficients of the capital-adjustment equation.
The sample-selection correction can be implemented by augmenting [2] with the non-selection hazard, measured by the inverse Mills ratio (y*i,t)/(y*i,t). To incorporate the latter into a fixed-effects regression, Vella (1998) recommends estimating a series of cross-sectional probit regressions for survival or non-survival in each time period, and constructing the inverse Mills ratio variable for inclusion in the fixed-effects regression from these probit regressions.14 A positive coefficient on the inverse Mills ratio in the augmented capital-adjustment equation is consistent with the hypothesis that a random event or unobservable that has a positive effect on capitalization also tends to have a positive effect on the probability of survival. We estimate a single pooled probit regression for survival with a full set of time dummies, and covariates that are important in driving survival or disappearance in previous studies.15
In dynamic panels with small T, fixed-effects estimation is biased, owing to the presence among the covariates of the lagged dependent variable. In such cases, a Generalized Method of Moments (GMM) dynamic panel estimator is usually recommended (Arellano and Bond, 1991; Arellano and Bover, 1995; Blundell and Bond, 1998). The bias in the fixed-effects estimator diminishes as T increases, while the GMM estimator rapidly becomes unwieldy due to a proliferation of lagged values of the dependent variable and covariates that qualify for inclusion
14
In the present case, the ability of cross-sectional probit regressions to explain survival or non-survival is variable, and the estimated coefficients are unstable, owing to the relatively small proportion of disappearances (around 1.5% of the total population) in each six-monthly period (see Table 5). A pooled probit regression with time-period dummies allows a sufficient number of exits for reliable estimation. It seems plausible that there might well be a cyclical pattern in the rate of credit union acquisition, by far the largest exit category. The time-period dummies in the probit regression are highly significant.
15
The role of bank-specific, regulatory and regional economic conditions as determinants of bank failure is examined by Wheelock and Wilson (2000) and Cole and White (2012). The limited evidence on credit union failure suggests that young and small credit unions, and those that are weakly capitalized, are most likely to fail (Wilcox, 2005a; Goddard, McKillop and Wilson, 2009).
as instruments.16 In the present case, the availability of more than 30 observations on each surviving credit union renders the bias in the fixed-effects estimator sufficiently small to be ignored.17 Accordingly, we estimate the capital-adjustment equation using fixed effects. The use of lagged values of all covariates partially mitigates the endogeneity problem that might arise through simultaneity between the contemporaneous values of the capital-to-assets ratio and other financial ratios.18
Lagged values are used for the covariates of the capital-adjustment equation, to avoid possible endogeneity issues. The growth in loans ci,t-m controls for the effects of an increase in lending on the capital-to-assets ratio. In addition to a natural tendency for growth in lending to place downward pressure on the capital-to-assets ratio through an increase in the assets denominator, empirical evidence suggests that periods of rapid loan growth tend to be followed by increased defaults, and consequent depletion of capital (Berger and Udell, 2004).
The change in the ratio of non-performing loans to total loans ni,t-m is a proxy for credit risk. We expect an increase in the non-performing loans ratio to be associated with a subsequent decrease in the capital-to-assets ratio, as capital is depleted by the losses arising from the eventual write-off of non-performing loans. The change in the non-interest expenses to assets ratio ei,t-1 reflects an anticipated tendency for a credit union with high operating costs to
16
The number of lags of the dependent variable, and the number of lags of the predetermined, endogenous or strictly exogenous variables, that are available for inclusion in the instrument matrix (either in levels or in first differences) naturally increases as the time dimension of the panel increases.
17
Flannery and Hankins (2013) report Monte Carlo simulation evidence for the order of magnitude of the bias in the fixed-effects estimator of the coefficient on the lagged dependent variable, as follows: 0.144 for T=6, 0.070 for T=12 and 0.026 for T=30.
18
If both the covariates and the disturbances of [2] are autocorrelated, simultaneity bias may arise despite the use of lagged covariates. Owing to an absence of suitable instruments capable of satisfying the instrument relevance and instrument exogeneity conditions among the Call Report data, an instrumental variables treatment of the possible simultaneity problem affecting the estimation of [2] is not possible in this study.
encounter difficulties in maintaining adequate capitalization. Excessive operating costs deplete net income, making it difficult to increase capital in line with growth in lending.
The growth in Gross State Product gi,t-m controls for the effects of variations in state-level macroeconomic conditions. A state-state-level geographic definition is employed, since most credit unions operate within defined geographic boundaries. The theoretical relationship between capital buffers and the business cycle is unclear. Forward-looking financial institutions might accumulate capital during an upturn, to protect against losses during a future downturn. Alternatively, myopic institutions might deplete capital during an upturn by exploiting transient lending and other investment opportunities to the full. During a downturn, the same institutions might be pressed to raise new capital in a climate of increasing loan defaults and write-offs.19
For 4,907 of the 4,947 credit unions identified as having been either acquired or subject to a purchase and assumption order, an acquiring credit union is identified by the NCUA.20 The acquisition of another credit union is likely to affect the capital adjustment of the acquirer. For example, if the acquired credit union is undercapitalized relative to the acquirer, then some reduction in the capitalization of the acquirer is to be expected when the balance sheets of acquirer and acquired are combined. To control for this effect, synthetic first-difference and lagged values of the variables ki,t, ci,t, ni.t and ei,t for the acquirer credit union are constructed for
19 Recent research has focused on the role of capital buffers in absorbing shocks to a bank’s capital base. The results
of studies that examine the link between bank capital buffers and economic growth are mixed. On balance, however, it appears that commercial banks’ capital is negatively related to economic growth (Ayuso, Perez and Saurina, 2004; Lindquist, 2004). This is not the case for savings and cooperatives banks, which appear to build capital during periods of economic growth (Stolz and Wedow, 2011). Smith and Woodbury’s (2010) comparison of the loan performance of banks and credit unions over the period 1986-2009 suggests that credit union loan delinquencies and net charge-offs are less affected by macroeconomic fluctuations (unemployment rate) than those of banks.
20 For the remaining 40 acquisitions, we were unable to identify the acquiring credit union. Most of these
the periods immediately following the acquisition, using the combined data for the acquirer and the acquired credit unions immediately prior to the acquisition.21
5. Data and descriptive statistics
The balance sheet and income statement data used in the empirical analysis reported in this study are compiled from the ‘5300 Call Reports’, published by the NCUA. Semi-annual data are available for the period June 1994 to December 2012 inclusive, providing a maximum of 38 time-series observations on each credit union. NCUA reports data for 12,046 credit unions in December 1994, and 6,814 credit unions in December 2012.22 State-level macroeconomic data are obtained from the US Bureau of Economic Analysis.
Table 2 reports the total number of US credit unions at the end of December in each year from 1994 to 2012, with averages of the variables employed in the capital-adjustment model. Over the period there was a pronounced decline (43%) in credit union numbers, balanced by a large increase (519%) in average asset size. The average capital-to-assets ratio increased by about three percentage points between 1994 and 2007, but has subsequently fallen sharply. Capitalization appears to be pro-cyclical: the average capital-to-assets ratio declined from 14.8%
21 For the semi-annual observation immediately following an acquisition, k
i,t is the capital-to-assets ratio for the
acquirer, incorporating the capital and the assets of the acquired credit union. The constructed value of ki,t for the
acquirer is ki,t– * 1 t , i
k , where k*i,t1 is the synthetic capital-assets ratio of the acquirer and the acquired before the acquisition, [(NWacquirer+NWacquired)/(ASSETacquirer+ASSETacquired)]t–1. The constructed values of ki,t–1, ki,t–1 and ki,t– 2 for the acquirer are
* 1 t , i k , k*i,t1– * 2 t , i k and k*i,t2– * 3 t , i
k , respectively. For the next semi-annual observation, ki,t and ki,t–1 are the actual values for the acquirer incorporating the acquired, and the constructed values of ki,t–1
and ki,t–2 are ki,t–1–
* 2 t , i k and k*i,t2– * 3 t , i
k , respectively. For the following observation, ki,t, ki,t–1 and ki,t–1 are
the actual values, and the constructed value of ki,t–2 is ki,t–2–
* 3 t , i
k . The other covariates are treated in the same
manner.
22The analysis is undertaken using semi-annual data. Before 2001 credit unions with assets of less than $50 million
were not formally required to file quarterly reports. In 2001, the NCUA instituted a new Examination Scheduling Program, which required all federally-insured credit unions to file a quarterly Call Report (5300 report).
in 1999 to 13.3% in 2003; and from 15.5% in 2007 to 13.1% in 2012. Liquidity ratios increased significantly following the introduction of PCA. The non-performing loans ratio has declined gradually over time, but has seen an upturn during the current financial crisis peaking at 4.02% in 2010 before declining in both 2011 and 2012. The rate of growth in loans is sensitive to the economic cycle. There were marked reductions in the rate of loan growth in 1998 (Asian crisis), 2001-2003 (post-‘dotcom’ bubble), and 2007-2012 (financial crisis and aftermath). In this latter period annual loan growth was negative in three of the five years.
Table 3 reports an analysis of the proportions of credit unions in bands defined by the capital-to-assets ratio. Of key interest is the trend in the proportion of credit unions that are classified as adequately capitalized or below, with capital-to-assets ratios below 7%. In December 1994 this proportion was as high as 8.3%, but in anticipation of the introduction of capital regulation and PCA, the proportion fell, to around 3% by the end of the 1990s. The downward trend continued to a low of 1.4% in December 2007. In 2009, however, the proportion of credit unions classified as adequately capitalized or below increased, from 2% in December 2008 to 5.2% in December 2009. Subsequently some progress has been achieved in reducing this proportion, which had fallen to 3.6% by December 2012. Between 2007 and 2012, however, the proportion of credit unions reporting capital-to-assets ratios in excess of 16% fell from 35.4% to 20.5%.
Table 4 reports the distribution of US credit unions by assets size at each December data-point, and the average capital-to-assets ratio in each assets size band. Throughout the observation period, there is a consistent inverse relationship between assets size and capitalization. Without exception, the average capital-to-assets ratio declined in each assets size band between 2007 and 2012.
Table 5 reports an analysis of entry and exits. The reduction in credit union numbers from 12,046 in 1994 to 6,814 in 2012 forms part of a longer-term decline, from a peak in numbers at 23,866 in 1969. Between 1994 and 2012, 154 credit unions entered, and 5,386 exited. Most exits were as a consequence of acquisition (4,857 credit unions). The annual exit rate was smaller during the period 1995 to 1998 than it was in most subsequent years. Between 1999 and 2012 the exit rate, with the exception of 2010, has remained broadly stable (between 3% and 4% per year), and apparently insensitive to the economic cycle.
6. Dynamic panel model for survival and capital adjustment
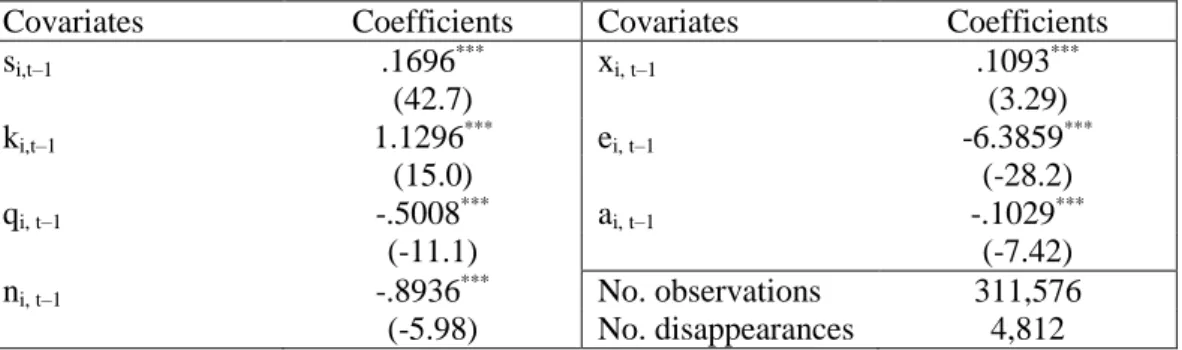
Table 6 reports the estimation results for the probit regression for the probability of survival.23 Coefficients significantly different from zero are obtained for all covariates. Larger credit unions are more likely to survive than smaller ones, and younger credit unions are more likely to survive than older ones.24 Other characteristics that increase the probability of survival are: a high capital-to-assets ratio; a low liquidity ratio; a low non-performing loans ratio; a high loans-to-assets ratio; and a low ratio of non-interest expenses to total assets.25 Table 7 reports the
23 Most credit unions that exited did so as a consequence of having been acquired. Credit unions that failed or were
subject to a purchase and assumption order account for a very small proportion of total exits (see Table 5). For the estimation of the probit regression of survival or disappearance we combine all disappearances into one exit category. This suggests that the estimation results are driven mainly by the preponderance of mergers. In a study of the corporate demography of the credit union industry, Goddard, McKillop and Wilson (2014) identify some differences in the relative importance of factors driving disappearance through acquisition and disappearance through failure.
24 That older credit unions are at greater risk of disappearance has been found elsewhere in the credit union
literature. For example Barron, West and Hannan (1994), who examine the corporate demography of credit unions in New York, find that older credit unions fail at a faster rate than their younger counterparts. The authors attribute this pattern to either liability of obsolescence, or liability of senescence, or both.
25 We find a higher liquidity ratio leads to disappearance (the numerator of our liquidity ratio is defined as cash on
hand, cash on deposit and cash equivalents) and a low loan to assets ratio also leads to disappearance. An explanation for these findings is that a credit union that hordes cash, or does not create a loans portfolio of a size commensurate with its deposits, may be either an attractive target for an acquirer that believes itself capable of earning a higher return by expanding the loans portfolio, or at risk of failure due to an inability to generate an adequate return.
estimation results for the fixed-effects capital-adjustment equation, in which the dependent variable is the change in the capital-to-assets ratio over each six-month period.
6.1 Dynamics of capital adjustment
The first column of Table 7 reports a pooled estimation using the data for all credit unions. The coefficients on i,t 1
j t , i k I , i,t 1 j t , i k I and i,t 2 j t , i k
I describe capital adjustment separately for credit unions in the following categories: well capitalized (ki,t–10.07), 1995.2-2000.1 (j=1); adequately capitalized or below (ki,t–1<0.07), 1995.2-2000.1 (j=2); well capitalized, 2000.2-2008.2 (j=3); adequately capitalized or below, 2000.2-2008.2 (j=4); well capitalized, 2009.1-2012.2 (j=5); adequately capitalized or below, 2009.1-2012.2 (j=6).26 By classifying credit unions by their capitalization and sub-dividing the observation period into pre-and post-2000 sub-periods, we identify the impact on capital adjustment of the introduction of the current regulatory arrangements for PCA. The further sub-division of post-2000 into two sub-periods (2000-08, and 2009-12) recognizes the sharp deterioration in credit union capitalization in the aftermath of the financial crisis (see Tables 2, 3 and 4), and allows for further differences in the pattern of capital adjustment between these sub-periods. Along with the test for the joint significance of all coefficients, tests of the null hypothesis of equality of corresponding coefficients on i,t 1 j t , i k I , Iij,tki,t1 and i,t 2 j t , i k
I for j=1 and 2 (well capitalized credit unions compared with those adequately capitalized and below, 1995-2000), j=3 and 4 (same comparison, 2000-08), j=5 and 6 (same comparison, 2009-12), j=1,3 and 5 (well capitalized compared across 1995-2000, 2000-08 and 2009-12), and j=2,4 and 6 (adequately capitalized and
26 For convenience, we refer below to the three sub-periods as 1995-2000, 2000-08 and 2009-12.
below compared across the same three sub-periods), are reported at the foot of Table 7. The null hypothesis is rejected in every case, indicating that the differences between the estimated coefficients are statistically significant.
The interpretation of the coefficients reported in Table 7 may be simplified by transforming the estimated coefficients to recover the implied coefficients on ki,t–1, ki,t–2 and ki,t–3 in the equivalent levels autoregression for ki,t. With reference to [2], the coefficients on i,t m
j t , i k
I
for m=1,...,3 and j=1,...,6, denoted jm, are as follows: 1 j 11 j 1 j 1 , 12j j 11 j 2 and j 12 j 3
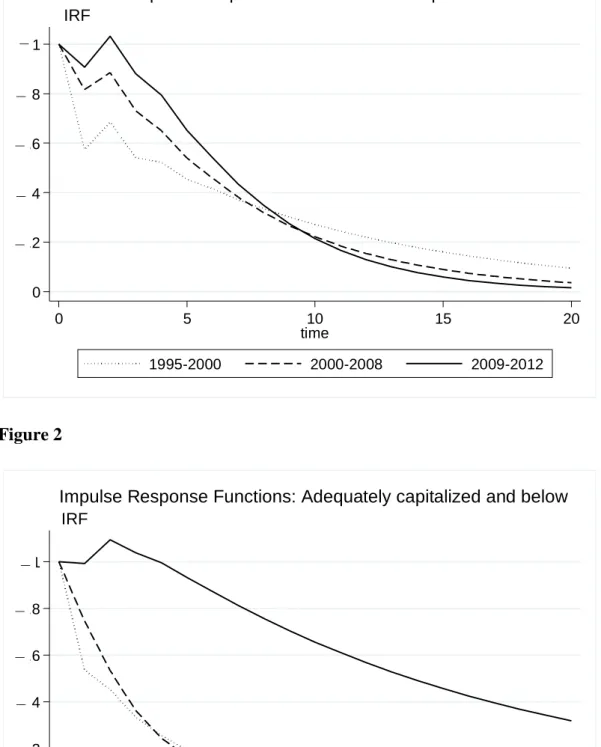
. Table 8 reports jm, based on the estimation using the data for all credit unions (first column of Table 7), and the corresponding impulse response functions (IRF). The IRF identify the impact on ki,t at selected values of t1, of the injection into [2] of an unanticipated negative unit capitalization shock of vi,t = –1 at t=0. Figure 1 illustrates the hypothetical adjustment paths following a capitalization shock of a credit union that is initially classified as well capitalized, for each of the three sub-periods. Figure 2 refers to a credit union initially classified as adequately capitalized or below.
According to Table 8, the time-series behaviour of the capital-to-assets ratio is mean-reverting, because 1j0(or 1
3 1 m j m
) in all six cases (j=1,...,6). In Figures 1 and 2, the rate of
mean reversion measure
3
1 m
j
m is represented by the total area between the IRF and the horizontal axis (over time to infinity), which provides a measure of the total exposure (the summation over time of the amounts by which the credit union was undercapitalized in each period). For any given rate of mean reversion, the relative magnitudes of the individual jm convey further information about the nature of the adjustment. If, for example, j1 is relatively
large and j2, j3 are relatively small (or negative), in the early stages recovery is relatively slow, but full recovery is achieved relatively fast. By contrast, if j1 is smaller and j2, j3 are larger, in the early stages recovery is relatively fast, but full recovery takes longer.
For well capitalized credit unions (ki,t–10.07), the adjustment to a negative capitalization shock is similar in all three sub-periods. For credit unions that were adequately capitalized or below, (ki,t–1<0.07), the adjustment (rate of mean reversion) was faster for the sub-periods 1995-2000 and 1995-2000-08 than for the sub-period 2009-12.27 According to the estimations for the sub-periods 1995-2000 and 2000-08, if a credit union that is initially adequately capitalized or below experiences a negative capitalization shock, the adjustment is faster than in the case of a similar shock to a credit union that is initially well capitalized. By contrast, for the 2009-12 sub-period the adjustment is slower for a credit union that is initially adequately capitalized or below than it is for one that is well capitalized.
For credit unions that were initially well capitalized, neither the introduction of PCA, nor the financial crisis, appears to have made much difference to the capital-adjustment process. For credit unions that were initially adequately capitalized and below, there was little change in the speed of adjustment following the introduction of PCA. There was, however, a marked reduction in the speed of adjustment in the aftermath of the financial crisis. The estimates for the
27 The differences between these estimated rates of mean reversion are statistically significant in all cases. A z-test
of the hypothesis 11 12 in [2] (equivalent to 1m 2m), interpreted as the condition that the rates of mean reversion are the same for well capitalized credit unions and credit unions adequately capitalized and below, 1995-2000, yields a z-statistic of 10.7 (p-value=.000). The test of 13 14 in [2], as above for 2000-08, yields z=8.21 (p=.000); and the test of 15 16 in [2], as above for 2009-12, yields z=2.22 (p=.026). An F-test of
5 1 3 1 1 1
in [2], interpreted as the condition that the rates of mean reversion for well capitalized credit unions are the same for all three sub-periods, yields F=33.7 (p=.000). Despite these three coefficients being qualitatively similar the test is highly significant, presumably owing to the large number of observations for well capitalized credit unions. The test of 12 14 16 in [2], as above for credit unions adequately capitalized and below, yields F=24.3 (p=.000).
periods 1995-2000 and 2000-08 are broadly comparable to those reported for US banks by Shrieves and Dahl (1992) and Aggarwal and Jacques (2001);28 although the latter report substantially smaller rate of mean reversion estimates for banks that were initially undercapitalized. These patterns might reflect the narrower range of options for raising new capital quickly that is open to credit unions, in comparison with banks.
Overall, the principal effect of the introduction of the PCA regulatory regime appears to have been a sustained reduction in the proportion of credit unions operating with capitalization below 7%. This reduction was already underway prior to, and presumably in anticipation of, the implementation of PCA in 2000, and the reduction continued until the onset of the financial crisis in 2007. The results reported in Table 8 and Figures 1 and 2 suggest, however, that the introduction of PCA made little or no difference to the pattern of capital adjustment in response to an adverse capitalization shock. Rather, the principal effect of PCA appears to have been deterrence: credit unions became less likely to reach a state requiring regulatory intervention.
Initially US credit unions appeared to have weathered the financial crisis better than the banks, with no sharp deterioration in the strength of balance sheets across the industry as a whole having been apparent in 2007 and 2008. A marked deterioration was recorded in 2009, however, from which recovery was far from complete at the time of writing. In the aftermath of the financial crisis, there was little change in the pattern of adjustment to an adverse capitalization shock for credit unions classified as well capitalized. A marked change was observed for credit unions in the adequately capitalized and below category, however, with the speed of mean
28 The estimations reported by Shrieves and Dahl (1992, p452, Table III) imply a corresponding rate of mean
reversion measure of 0.942 for US banks with capitalization above the mid-1980s regulatory threshold (7% equity capital-to-assets ratio), and 0.729 for banks below this threshold. Accordingly, the rate of mean reversion is slower for the former category, and faster for the latter. The corresponding estimates for the Tier 1 leverage ratio reported by Aggarwal and Jacques (2001, p1151, Table III) are: 0.857, 0.888, 0.895 for well capitalized banks in 1991, 1992 and 1993, respectively; 0.834, 0.771, 0.773 for adequately capitalized banks; and 0.637, 0.220, 0.565 for undercapitalized banks (same three years).
reversion following an adverse capitalization shock being sharply reduced. In other words, credit unions in this latter category have, in general, struggled to improve their capitalization since 2009. The ability of the PCA regulatory regime to facilitate rapid recovery in the event of a negative capitalization shock for credit unions in the adequately capitalized and below category appears to have come under considerable strain in the aftermath of the financial crisis.
6.2 Other influences on capital adjustment
In the estimation reported in the first column of Table 7 using the data for all credit unions, the coefficient on (yˆi*,t)/(yˆ*i,t), a positive and significant coefficient on the inverse Mills ratio, generated from the probit regression (Table 6), indicates that common unobservables impact on both the capital-to-assets ratio and the survival probability. Accordingly, the inclusion of the sample selection correction in the capital-adjustment equation mitigates the survivorship bias that would otherwise arise. Estimation of [2] with the sample-selection correction omitted produces values of the rate of mean reversion measure
3 1 m
j
m that are smaller than those reported in Table 8 (implying a faster speed of adjustment) for each j=1,…,4.29
The coefficients on the lagged first and second differences of capitalization, 11j and 12j in [2], reflect the short-run dynamics of capital adjustment: the responsiveness of ki,t to ki,t–1
29For j=1, the estimated rates of mean reversion are 0.8702 (estimation without the sample-selection correction) and
0.8735 (estimation with the correction). For j=2, the corresponding estimated rates of mean reversion are 0.6860 (without) and 0.7041 (with); for j=3, 0.8627 (without) and 0.8643 (with); for j=4, 0.6995 (without) and 0.7045 (with); for j=5, 0.8708 (without) and 0.8717 (with); and for j=6, 0.9403 (without) and 0.9462 (with). Although the exclusion of the sample-selection correction does not seem to carry any serious qualitative implications for the estimation of the capital-adjustment equation, these results suggest that exclusion introduces a modest downward bias into the estimated coefficients on the lagged dependent variable in the capitalization regression. The sample-selection correction attributes some of the variation in capitalization to a survivorship effect. Exclusion of this correction therefore increases the unexplained proportion of the variation in capitalization, making the latter appear more random, and making capitalization appear less highly autocorrelated.
and ki,t–2. The specification of [2] is based on an assumption that 11j and j 12
are the same for positive and negative values of ki,t–1 and ki,t–2, respectively. We examine the implications of relaxing this assumption by introducing additional dummy variables into [2] to allow for variation in the coefficients on ki,t–1 and ki,t–2, depending upon whether the latter are positive or negative. The following commentary focuses on the coefficients on ki,t–1 in the case of well capitalized credit unions. A positive coefficient suggests a tendency for a positive short-run persistence effect (the same direction of capital adjustment between consecutive six-month periods), while a negative coefficient suggests a tendency for negative persistence (reversal in the direction of adjustment).
For j=1 (well capitalized, 1995-2000), a coefficient on ki,t–1 in Table 7 of -.2999 is replaced by coefficients of -.4337 for ki,t–10 and -.1466 for ki,t–1<0. The larger absolute magnitude of the coefficient for ki,t–10 indicates that the negative persistence effect is stronger for positive changes in capitalization than it is for negative changes. For j=3 (well capitalized, 2000-2008), a coefficient on ki,t–1 in Table 7 of -.0478 is replaced by coefficients of -.2199 for
ki,t–10 and .0697 for ki,t–1<0. For j=5 (well capitalized, 2009-2012), a coefficient on ki,t–1 in Table 7 of .0347 is replaced by coefficients of -.0279 for ki,t–10 and .0533 for ki,t–1<0.30
In the estimation using the data for all credit unions, negative coefficients on ci,t–m reflect a tendency for an increase in lending to place downward pressure on the capital-to-assets ratio, through an increase in the assets denominator. Negative coefficients on ni,t–m imply that
30
For credit unions adequately capitalized or below the pattern is less consistent, presumably owing to the smaller numbers of observations on which the coefficient estimates are based. For j=2 (1995-2000), a coefficient on ki,t–1 in
Table 7 of -.1689 is replaced by very similar estimates of -.1680 for ki,t–10 and -.1691 for ki,t–1<0. For j=4
(2000-2008), a coefficient on ki,t–1 in Table 7 of .0413 is replaced by coefficients of -.0026 for ki,t–10 and .0423 for ki,t–1<0. For j=6 (2009-2012), a coefficient on ki,t–1 in Table 7 of .0451 is replaced by coefficients of .2491 for ki,t–10 and -.0087 for ki,t–1<0.
an increase in the non-performing loans ratio is associated with a subsequent decrease in the capital-to-assets ratio, as capital is destroyed by the losses arising from the eventual write-offs. Negative coefficients on ei,t–m support the hypothesis that a credit union that has difficulty in containing its operating costs may encounter difficulties in maintaining adequate capitalization.
The coefficient on gi,t–1 is large and positive, and the coefficient on gi,t–2 is small and negative. Unlike banks, credit unions do not have the option of raising new capital in the form of equity. Credit unions might therefore be expected to adopt a more cautious approach than banks to the management of their capital over the course of the economic cycle. This might explain the observed empirical tendency for capital-to-assets ratios to vary pro-cyclically. Our results concur with recent evidence that credit unions face relatively low exposure to business-cycle fluctuations, and are relatively robust to macroeconomic shocks (Smith and Woodbury, 2010).31 Finally, significant negative coefficients on intercept-shift dummy variables in the aftermath of the financial crisis (2009-12), for both credit unions with ki.t–10.07 and those with ki,t–1<0.07 (not reported in Table 7), reflect a deterioration in the capitalization of the credit union industry as a whole that is also apparent in the descriptive statistics reported in Tables 2, 3 and 4.
31 One-tail z-tests of null hypotheses of zero restrictions on the sums of the coefficients on the lagged differences of
c, n, e and g produce the following results: test β11+β12=0 (sum of coefficients on ci,t-1 and ci,t-2 = 0), z=-7.56,
p=0.000; test β21+β22=0 (sum of coefficients on n,t-1 and ni,t-2 = 0), z=-14.9, p=0.000; test β31+β32=0 (sum of
coefficients on ei,t-1 and ei,t-2 = 0), z=-8.57, p=0.000; test β41+β42=0 (sum of coefficients on gi,t-1 and gi,t-2 = 0),
z=7.56, p=0.000. These results indicate that permanent changes in the rates of growth of loans, non-performing loans ratio, or ratio of non-interest expenses to assets would produce a reduction in the equilbrium capital-to-assets ratio; and a permanent change in the rate of growth of gross state product would produce an increase in the equilbrium capital-to-assets ratio.
6.3 Capital adjustment for credit unions by 1994 assets size band, and post-1994 entrants
The remaining columns of Table 7 report estimations for credit unions in each of five assets size bands defined using 1994 data, and for a (smaller) sixth group comprising subsequent entrants. Survival rates are highly dependent on assets size: only 25.4% of the credit unions in the smallest 1994 assets size band survived until 2012, while 83.6% of the credit unions in the largest 1994 assets size band survived.
For credit unions classified as well capitalized (ki,t–10.07), the coefficients on i,t 1 j
t , i k
I
and Iij,tki,tm suggest that the rate of mean reversion in capital adjustment is faster for credit unions in the smallest and largest assets size bands, and slower for credit unions of intermediate size. For credit unions that are adequately capitalized or below (ki,t–1<0.07), there is more variation in these coefficients, presumably due to sampling error with relatively few observations in some cells. The rate of mean reversion for this group, both before and after the introduction of PCA, is fastest in the smallest assets size band.
We conjecture that the pattern for well capitalized credit unions might reflect a u-shaped relationship between the proportion of loans in a credit union’s assets portfolio, and its capital adjustment speed. In 2012, the average loans-to-assets ratios of credit unions classified by percentiles of the assets size distribution were as follows: 0.425 (below p10, the 10th percentile of the assets size distribution), 0.479 (p10-p25), 0.465 (p25-p50), 0.504 (p50-p75), 0.565 (p75-p90), and 0.594 (above p90). Over most of the assets size distribution, a credit union with a higher loans-to-assets ratio, and therefore a relatively low proportion of investments in its assets portfolio, is likely to adjust more slowly to an adverse capitalization shock, because it has lesser
capacity to adjust its balance sheet quickly by buying or selling investments. At the upper end of the size distribution, however, this pattern is not maintained: the largest credit unions are able to achieve enhanced flexibility in managing their loans portfolios through engagement with secondary loan markets: for example, buying and selling shares in syndicated loans, or trading real estate mortgage loans in secondary markets.
In the estimations for credit unions in each of the five 1994 assets size bands, the coefficients on the inverse Mills ratio are positive and significant for all but the smallest size band. In general, the importance of the sample-selection effect increases with assets size.32 The coefficients on ci,t–m are negative and predominantly significant. The coefficients on ni,t–m are predominantly negative, and significant in the estimations for the larger assets size bands. All coefficients on ei,t–1 and several of the coefficients on ei,t–2 are negative and significant. The coefficients on gi,t–1 are positive and significant, indicating that the capitalization of credit unions in all asset size bands is pro-cyclical. The coefficients on gi,t–2 are negative and significant for the larger size bands, and insignificant for the smaller size bands. Large variations in the magnitudes of several of the estimated coefficients for the post-1994 entrants should be interpreted with caution in view of the small number of observations for this estimation.
7. Conclusion
This study examines the capital-adjustment process for US credit unions before and after the implementation of capital requirements and PCA in 2000. Given that the credit unions
32 These results suggest that the link between survivorship and capitalization is stronger for large than for small
credit unions. Our conjecture is that the survival or disappearance of large credit unions is likely to be driven primarily by their capitalization. For smaller credit unions, by contrast, other factors may be paramount: for example, a small credit union might be acquired and absorbed into another credit union if its common bond becomes obsolete owing to the closure of the employer of its members, or because its present management wishes to retire.
decreased by over one-third during the 1994-2012 observation period, the capital-adjustment model estimated includes a control for survivorship bias (derived from a probit regression for the probabilities of survival or disappearance for each credit union in each six-month time period). The model also allows for different capital-adjustment speeds for well and adequately capitalized credit unions both before and after the implementation of PCA and in the aftermath of the financial crisis of the late-2000s.
According to the probit regression, larger credit unions are more likely to survive than smaller ones, and younger credit unions are more likely to survive than older ones. Other characteristics that increase the probability of survival include a high capital-to-assets ratio, a low liquid assets-to-assets ratio, a low non-performing loans ratio, a high loans-to-assets ratio, and a low ratio of non-interest expenses to total assets.
In the estimated capital-adjustment regression, credit union capitalization is mean-reverting around a long-run average value that has varied over time. The introduction of the PCA regulatory regime appears to have achieved a sustained reduction in the proportion of credit unions operating with capitalization below 7%. PCA appears to have exerted a deterrent effect, such that credit unions became less likely to reach a state requiring regulatory intervention. However, PCA seems to have made little or no difference to the pattern of adjustment following an adverse capitalization shock. In the aftermath of the financial crisis, there was little change to the pattern of capital adjustment for credit unions classified as well capitalized; but for credit unions in the adequately capitalized and below category, the speed of recovery following an adverse capitalization shock was sharply reduced.
Credit union capitalization is found to vary pro-cyclically. This suggests that credit unions may manage their capital cautiously over the business cycle, in the absence of an option
to raise new capital in the form of equity. By accumulating capital when it is easiest to do so during an economic upturn, there is more scope for capital to be depleted through write-offs during a subsequent downturn. This (along with constraints on asset and funding diversification) may explain why credit unions generally weathered the financial crisis of the late-2000s better than many commercial banks.
Overall, the findings of this study suggest that credit unions have for the most part been strongly capitalized, and have maintained capital above the threshold required by the PCA framework instituted in 2000. Nevertheless, the recent financial crisis has placed severe downward pressure on capitalization, leading to an increase in the number of credit unions triggering supervisory actions by the regulator in order to restore net worth. The ongoing legislative agenda in US Congress is likely to lead to regulatory change which will provide a new risk-based capital regime alongside existing leverage arrangements. This is likely to provide credit unions with more flexibility in the forms of capital held, and increase their ability to meet regulatory minima when changes in economic conditions (and resultant shocks to balance sheets) occur.