Combined application of cost–benefit and
multi-criteria analysis for decision support in
air quality management policy: a case study
in Lima and El Callao, Peru.
Gerardo Sanchez Martinez
Department of Applied Economics III (Econometrics and Statistics)
Faculty of Economics and Business
2017
1
Aplicación combinada de análisis coste-beneficio y multicriterio para apoyo de toma de
decisiones en políticas de calidad del aire: un caso de estudio en Lima y El Callao, Perú.
1. Introducción
La colección sistemática y utilización de datos y evidencia para la evaluación de impacto potencial de políticas ambientales se ha convertido en norma en la mayoría de países desarrollados. Aunque de manera menos sistemática, estos insumos también se utilizan para la toma de decisiones en países en desarrollo. Existe una gran variedad de herramientas para organizar y procesar esta información, y su tipología y ventajas han sido estudiadas exhaustivamente (por ejemplo, por Crabbé & Leroy, 2008). Los dos tipos de herramientas más utilizados en este tipo de evaluaciones son el análisis coste-beneficio (ACB) y el análisis multicriterio (AMC). Sólidos argumentos justifican el uso generalizado del ACB y AMC en la evaluación de políticas públicas ambientales (OECD, 2008). Ambas técnicas son lo suficientemente flexibles para aplicarse a casi cualquier tipo de evaluación. Además, existe un gran acervo de literatura e información acerca de sus bases conceptuales, aplicación en la práctica y casos de estudio –aunque algo menor en el caso del AMC, más reciente. Por otra parte, sus perfiles de ventajas y desventajas son complementarios, lo que sugiere un cierto valor añadido de su uso combinado. Sin embargo, existe poca información en la literatura científica y técnica acerca de las posibilidades del uso combinado de ACB y AMC. En concreto, apenas hay estudios sobre las limitaciones o el valor conceptual y práctico de las posibles combinaciones de ambas técnicas, particularmente en el campo de políticas ambientales. Es esta escasez la que dio origen al tema de esta tesis doctoral.
2. Objetivos
Los objetivos principales de esta tesis doctoral son:
Estudiar los ejemplos del uso combinado de ACB y AMC y sus implicaciones, y desarrollar un marco conceptual para la integración de ambos métodos;
Distinguir y analizar las principales opciones metodológicas para este uso combinado y aplicarlas a un caso de estudio real de priorización de políticas locales de gestión de la calidad del aire; e
Investigar las ventajas y desventajas, fortalezas y debilidades de cada opción de combinación En resumen, se trata de explorar la factibilidad y valor añadido de las posibilidades de combinación a través de un caso de estudio, que actúa como hilo conector del análisis. Tras la revisión de la literatura relevante, este proceso de análisis conllevó los siguientes pasos:
Evaluación de impacto ambiental y en salud de las políticas propuestas;
ACB de las políticas del caso de estudio;
AMC de las políticas del caso de estudio;
Combinaciones posibles de uso combinado de ACB y AMC, y discusión al respecto; y
Conclusiones.
Esta tesis también aporta producción de conocimiento e innovación. El ACB de las políticas de calidad del aire en Lima se añade a un muy pequeño conjunto de evaluaciones de este tipo en América Latina. En el caso del AMC, además de lo excepcional de su aplicación en este tema y esta región, todo el proceso fue guiado y canalizado por parte de los actores clave y representantes de partes afectadas, un aspecto infrecuente en la literatura. Y finalmente, la aplicación combinada de ACB y AMC es, de acuerdo a la búsqueda de literatura, el único caso en la región; además, entre los enfoques de combinación se propone una técnica novedosa con posible valor de aplicación en el futuro.
2
3. Caso de estudio: políticas de calidad del aire en Lima y El Callao, Perú
Los efectos en salud de la contaminación del aire urbano han sido estudiados minuciosa y exhaustivamente desde el punto de vista epidemiológico (Dockery & Pope, 2006; Dockery et al., 1993; Katsouyanni et al., 2001; Pope et al., 1995; Pope et al., 2002). Estos efectos incluyen mortalidad prematura, severas enfermedades respiratorias y cardiovasculares agudas y crónicas, y múltiples efectos más leves o subclínicos. La carga de enfermedad de la contaminación afecta de manera desproporcionada a grupos vulnerables de población como niños, ancianos y enfermos crónicos (Brook, 2010; Eftim et al., 2008; Samet & Krewski, 2007).
A pesar de la escasa evidencia epidemiológica en Lima, la pésima calidad del aire llevó a los gobiernos nacional y local a tomar medidas para disminuir la contaminación atmosférica en la ciudad. Estos esfuerzos iniciales continuaron a finales de la década de los 90 con la incorporación de Lima a la Iniciativa de Aire Limpio para América Latina del Banco Mundial, que proporcionó incentivos y asistencia técnica. A través de legislación, control de cumplimiento y programas específicos se consiguieron en la década pasada considerables descensos en las concentraciones de importantes contaminantes como los óxidos de nitrógeno y el dióxido de azufre. Sin embargo, las partículas inhalables se han mantenido en promedio muy por encima de los límites permisibles locales, de 50 y 15 microgramos por metro cúbico para PM10 y PM2.5, respectivamente (DIGESA, 2012).
Esta permanencia en altas concentraciones es preocupante, puesto que la materia particulada inhalable es el contaminante urbano con mayores y más severos efectos en salud pública (WHO, 2006). Dada la situación, los gobiernos locales de la Zona Metropolitana de Lima y el Callao (ZMLC) y el gobierno de Perú diseñaron el “Segundo Plan Integral de Saneamiento Atmosférico para Lima y Callao” (PISA II), estructurado en torno a tres programas básicos: P1: reducción de las emisiones y concentraciones de materia particulada; P2: prevención y reducción de la contaminación en general; y P3: investigación en contaminación del aire. El diseño e implementación del plan se coordinaron desde el Comité Gestor de la Iniciativa de Air Limpio (CGIAL), el cual estableció por su urgencia la reducción de las concentraciones de materia particulada como el área prioritaria de acción. Las autoridades peruanas solicitaron al Banco Mundial asistencia técnica para evaluar y priorizar estas acciones, así como sugerir herramientas de apoyo de toma de decisiones al respecto. El Banco Mundial contrató mi colaboración, y mi propuesta fue la de realizar tanto un análisis coste-beneficio (ACB) como un análisis multicriterio (AMC) de las medidas. Todas las partes aceptaron esta propuesta y el uso de los resultados para esta tesis doctoral. Las actividades clave del programa para la reducción de las partículas son:
Acción 1 (A1), renovación de la flota vehicular particular, basada en un sistema de incentivos, variaciones impositivas y restricciones a la importación de vehículos de segunda mano;
Acción 2 (A2), un bono de chatarreo para vehículos obsoletos de transporte público, diseñado como incentive para la renovación de la atomizada flota vehicular de transporte público en la ZMLC;
Acción 3 (A3), promoción del uso del Gas Natural Vehicular a través de subsidios para la adaptación de vehículos de transporte público;
Acción 4 (A4), fomentar el mantenimiento e inspección vehicular en todas las flotas.
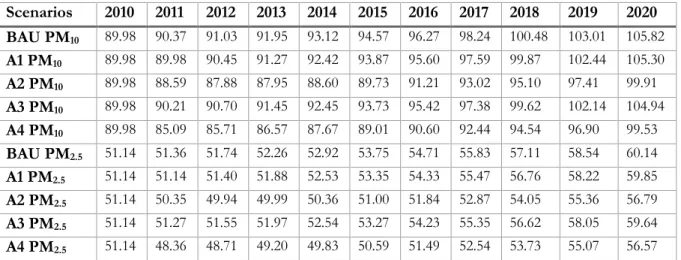
En base al modelo de emisiones de fuentes móviles aplicado (ver Gráfico 1), todas y cada una de las acciones planteadas conllevan un descenso relativo en las emisiones de materia particulada en comparación con el escenario base, en el horizonte temporal considerado (2011 a 2020). Sin embargo, en todas ellas hay a la larga un incremento total de emisiones debido a las rápidas tasas de motorización en el país previstas a corto y medio plazo.
3
Gráfico 1. Emisiones de PM10 (Tm) desde 2010 a 2020 bajo distintos escenarios
Fuente: elaborado por el autor, en base a datos del Instituto de Aire Limpio (CAI-LAC)
La acción A4 (mantenimiento e inspección vehicular) aporta las mayor reducción de emisiones, seguida de A2 (chatarreo de vehículos obsoletos de transporte público), y a mayor distancia de A3 (promoción del uso del Gas Natural Vehicular) y de A1 (renovación de la flota vehicular particular). En términos generales, las reducciones correspondientes de concentraciones de contaminantes y los beneficios en salud atribuibles son aproximadamente proporcionales.
4. Análisis coste-beneficio del caso de estudio
El ACB de las acciones se realizó conforme a la metodología estándar del Banco Mundial para evaluaciones ambientales nacionales (ver, por ejemplo, Golub, Klytchnikova, Sanchez Martinez, & Belausteguigoitia, 2014). La principal fuente de beneficios son los efectos en salud (mortalidad prematura y morbilidad) evitados, mediante las metodologías del coste de enfermedad y de valor de una vida estadística. Los costes son calculados a nivel social, incluyendo tanto los costes privados como los gubernamentales de implementación. Las tasas de descuento utilizadas son el 0% y el 3%, y los resultados están listados en la tabla 1.
Tabla 1. Resultados finales del análisis coste-beneficio, sin descuento y con una tasa de descuento del 3%
Indicador Acción A1 Acción A2 Acción A3 Acción A4
VP Beneficios( M.S/) sin descuento 1,159 8,804 1,325 10,888 VP Beneficios (M.S/) descuento 3% 954 7,109 1,063 8,930 VP Costes ( M.S/) sin descuento 8,130 5,122 388 1,280 VP Costes (M.S/) descuento 3% 7,169 4,983 330 1,052 Ratio Beneficio-Coste (RBC) sin descuento 0.14 1.72 3.41 8.50 Ratio Beneficio-Coste (RBC) descuento 3% 0.13 1.43 3.21 8.48
En términos de costes y beneficios a nivel social, la acción A1 no es costo-beneficiosa, con un RBC muy inferior a la unidad (por cada Sol peruano invertido sólo se obtendrían 0.14 Soles), mientras que A2, A3 y A4 sí lo son, con valores crecientes de RBC. En el caso de A3 (promoción del GNV), la discrepancia entre su escaso efecto de reducción de emisiones y su alto RCB se explica por el bajo coste de la medida. 3,900 4,100 4,300 4,500 4,700 4,900 5,100 2010 2011 2012 2013 2014 2015 2016 2017 2018 2019 2020 BAU A1 A2 A3 A4
4 5. Análisis multicriterio del caso de estudio
De entre los posibles modelos AMC, dadas las características y limitaciones del caso de estudio (baja disponibilidad de datos, tiempo de interacción con actores clave limitado, etc.), se optó por modelo del tipo “Outranking”, en concreto la metodología PROMETHEE-GAIA (Brans, 1982; Brans, Vincke, & Mareschal, 1986). De este modelo se pueden obtener dos tipos de priorizaciones: una parcial (en que se comparan separadamente la preferencia y la no preferencia) y una completa, que sintetiza todas las preferencias. Para obtener los criterios relevantes, el CGIAL identificó una muestra de 30 actores clave. Posteriormente se diseñó una entrevista semiestructurada (Gregory & Brierley, 2010; Naylor & Appleby, 2013) y se completaron y validaron 24 de las entrevistas. A través de sus respuestas se identificaron 26 criterios clasificables en seis categorías (Ambiental, Salud, Economía, Social, Política e Implementación). Estos criterios se presentaron a los 30 actores clave en un taller al efecto, y se priorizaron de acuerdo a una metodología de tipo “Semáforo”. Se entregaron a cada participante tres tarjetas de colores, con el siguiente significado: Verde –criterio clave; Amarillo –criterio relevante, pero no clave; Rojo –criterio no relevante. A cada selección se le asignó un valor numérico (3 al verde, 1 al amarillo, 0 al rojo) y se evaluaron los criterios preliminares. De este ejercicio se obtuvieron los criterios y pesos del AMC, y los criterios se evaluaron posteriormente a través de modelización (criterios cuantitativos) y de cuestionarios (criterios cualitativos). El problema AMC resultante está resumido1 en la tabla 2.
Tabla 2. Análisis multicriterio del caso de estudio
Criterios
C. Enf. Incl. Op. Púb. Cump. Impl. Coste Incentivos
P
ar
ám
et
ro Unidades DALYs N/A N/A N/A Años M. Soles N/A
Optimización Max. Max. Max. Max. Min. Min. Max. Peso 0.1910 0.1348 0.1124 0.1551 0.1865 0.1124 0.1079 A cci on es A1 renovación 7263 1.80 1.60 3.80 5.77 15.00 2.40 A2 chatarreo 55169 2.60 3.80 2.40 6.63 53.96 2.00 A3 GNV 8308 4.20 4.40 3.80 6.36 80.00 4.80 A4 mantenim. 68226 2.40 3.00 3.00 6.51 4.31 2.40
Verde: rendimiento máximo; Rojo: rendimiento mínimo
La priorización del AMC da una clara primera posición a la acción A3 (GNV), seguida de A4 (mantenimiento), y a mayor distancia A1, siendo A2 la peor clasificada. Claramente, la influencia de los criterios subjetivos, a su vez evaluados por los actores clave, favorecen a A3. Sin embargo, la primera posición global de A3 enmascara un bajo rendimiento en términos en los criterios cuantitativos (y monetizables), lo cual ejemplifica las limitaciones del AMC puro en considerar costes y beneficios sociales. Aunque no es generalizable, esta discrepancia refuerza la idea de la complementariedad de AMC y ACB.
6. Aplicación combinada de AMC y ACB al caso de estudio
Las metodologías publicadas de combinación del AMC y ACB se pueden clasificar en cuatro categorías: 1) Combinar los resultados del AMC y ACB;
2) Modificar un ACB con los atributos de un AMC;
3) Integrar resultados de un ACB en la estructura de un AMC; o 4) Crear un sistema híbrido.
1
Abreviaturas, de izquierda a derecha y de arriba a abajo: Carga de enfermedad, Inclusión social, Opinión pública, Cumplimiento, Implementación, Máximización, Minimización, Mantenimiento.
5
Sin embargo, el único ejemplo encontrado de sistema híbrido no representa una combinación real, sino una presentación alternativa de los resultados de ambas técnicas. Por tanto, no se aplicó al caso de estudio, al que sí se sometió al resto de técnicas.
La combinación de los resultados de AMC y ACB se realizó mediante la metodología COSIMA, propuesta por Barfod, Salling, & Leleur (2011). En esta metodología se obtiene una “Tasa Total de Retorno” que se compone de un término monetario aportado por el ACB y un término procedente del AMC, monetizado mediante una función de valor predeterminada. El peso relativo de uno y otro término es decidido por el analista o por los actores clave. Los resultados de la aplicación al caso de estudio revelan la dificultad conceptual asociada a la función de valor, escasamente replicable y de cuya forma y valoración depende completamente la priorización.
La modificación de un ACB con los atributos de un AMC se realizó mediante la metodología propuesta por Diakoulaki & Grafakos (2004) en el proyecto “External Costs of Energy” (ExternE). En esta metodología se realiza una monetización indirecta de los criterios del AMC basada en el rango de rendimiento de cada criterio y el peso asignado al mismo por los actores clave. Esta evaluación indirecta se suma después a los costes y beneficios del ACB, consiguiendo un ACB ampliado con elementos a priori no monetizables. Los resultados de la aplicación al caso de estudio revelan las restrictivas condiciones teóricas que hacen la metodología poco generalizable en términos de su aplicación; sin embargo, el método de monetización indirecta es transparente y replicable.
Para la integración de los resultados de un ACB en la estructura de un AMC se consideraron varias opciones de entre las publicadas, en concreto las propuestas por Gühnemann, Laird, & Pearman (2012); Nellthorp, Mackie, & Bristow (1998); y Schutte & Brits (2012); las cuales resultaron no aplicables o poco relevantes para el caso de estudio. Por tanto, se propuso una metodología alternativa. Esta metodología es replicable y permite la visualización de contrapartidas entre variables monetizables y no monetizables, aunque esto se consigue a costa de modificar el AMC a posteriori.
Una vez aplicadas al caso de estudio las opciones de combinación AMC-ACB, se hizo una evaluación cualitativa de las características deseables que cada opción presenta. Estas características son múltiples, incluyendo la reproducibilidad, eliminación de doble contabilidad, provisión de solución unívoca, etc. La comparación revela que en todas las opciones de combinación se pierde alguna característica deseable, sugiriendo una elección de tipo de combinación basada en el problema específico a tratar.
7. Conclusiones
Tras analizar y aplicar a un caso de estudio las opciones para la combinación de AMC y ACB para la toma de decisiones en políticas ambientales, se puede concluir que:
La combinación de AMC y ACB tiene valor añadido, permitiendo visualizar simultáneamente una perspectiva integral de aspectos monetizables y no monetizables, así como las contrapartidas entre unos y otros;
Específicamente, es potencialmente de gran utilidad para los actores clave y tomadores de decisiones la visualización de discrepancias entre criterios subjetivos, variables no monetizables y la representación de las preferencias de la sociedad, ilustradas por el ACB;
Sin embargo, no existe por el momento una modalidad de combinación que pueda conservar las características deseables de ambas técnicas, lo cual indica una elección del tipo de combinación basada en el problema de decisión planteado;
6 Bibliografía
Barfod, M. B., Salling, K. B., & Leleur, S. (2011). Composite decision support by combining cost-benefit and multi-criteria decision analysis. Decision Support Systems, 51(1), 167–175.
http://doi.org/10.1016/j.dss.2010.12.005
Brans, J. (1982). L’ingénièrie de la décision; Elaboration d’instruments d’aide à la décision. La méthode PROMETHEE. In R. Nadeau & M. Landry (Eds.), L’aide à la décision: Nature, Instruments et Perspectives d’Avenir (pp. 183–213). Québec, Canada: Presses de l’Université Laval.
Brans, J., Vincke, P., & Mareschal, B. (1986). How to select and how to rank projects: the PROMETHEE method. European Journal of Operational Research, 24, 228–23.
Brook, R. (2010). Particulate Matter Air Pollution and Cardiovascular Disease : An Update to the Scientific Statement From the American Heart Association. Circulation, 121, 2331–2378.
Crabbé, A., & Leroy, P. (2008). The Handbook of Environmental Policy Evaluation. London: Earthscan. Diakoulaki, D., & Grafakos, S. (2004). ExternE-Pol Multicriteria Analysis. Final report on Work Package 4.
Retrieved from http://www.externe.info/externe_d7/sites/default/files/expolwp4.pdf
DIGESA. (2012). Estudio de saturación de la calidad del aire en Lima y Callao 2011: vigilancia confiable para la protección de la salud de las personas y de su entorno. Dirección General de Sanidad Ambiental, Peru. Dockery, D. W., & Pope, C. A. (2006). Health effects of fine particulate air pollution: lines that connect (2006
critical review). Journal of the Air & Waste Management Association, 56, 709–742.
Dockery, D. W., Pope, C. A. I., Xu, X., Spengler, J. D., Ware, J. H., Fay, M. E., … Speizer, F. E. (1993). An association between air pollution and mortality in six US cities. New England Journal of Medicine, 329, 1753–1759.
Eftim, S., Samet, J., Janes, H., McDermott, A., & Dominici, F. (2008). Fine particulate matter and mortality: a comparison of the six cities and American Cancer Society cohorts with a medicare cohort. Epidemiology, 19(2), 209–216.
Golub, E., Klytchnikova, I., Sanchez Martinez, G., & Belausteguigoitia, J. C. (2014). Environmental Health Costs in Colombia: The Changes from 2002 to 2010. World Bank Occasional Paper Series, (92956). Gregory, C. E., & Brierley, G. J. (2010). Development and application of vision statements in river
rehabilitation: the experience of Project Twin Streams, New Zealand. Area, 42(4), 468–478. http://doi.org/10.2307/40890904
Gühnemann, A., Laird, J. J., & Pearman, A. D. (2012). Combining cost-benefit and multi-criteria analysis to prioritise a national road infrastructure programme. Transport Policy, 23, 15–24.
http://doi.org/10.1016/j.tranpol.2012.05.005
Katsouyanni, K., Touloumi, G., Samoli, E., Gryparis, A., Le Tertre, A., Monopolis, Y., … Schwartz, J. (2001). Confounding and effect modification in the short term effects of ambient particles on total mortality: results from 29 European cities within the APHEA2 project. Epidemiology, 12(5), 521–531.
Naylor, C., & Appleby, J. (2013). Environmentally sustainable health and social care: Scoping review and implications for the English NHS. Journal of Health Services Research & Policy, 18(2), 114–121. http://doi.org/10.1177/1355819613485672
Nellthorp, J., Mackie, P., & Bristow, A. (1998). Measurement and Valuation of the Impacts of Transport Initiatives. Retrieved from
http://ec.europa.eu/environment/archives/tremove/pdf/measurement_maintext.pdf
OECD. (2008). Introductory Handbook for Undertaking Regulatory Impact Analysis ( RIA ). Paris, France. Retrieved from https://www.oecd.org/gov/regulatory-policy/44789472.pdf
Pope, C. A. I., Burnett, R. T., & Thun, M. J. (2002). Lung cancer, Cardiopulmonary mortality, and Long-term exposure to fine particulate air pollution. Journal of the American Medical Association, 287, 1132–1141. Pope, C. A. I., Thun, M. J., Nambudiri, M. M., Dockery, D. W., Evans, J. S., Speizer, F. E., & Heath, C. W. J.
(1995). Particulate air pollution as a predictor of mortality in a prospective study of US adults. American Journal of Respiratory and Critical Care Medicine, 151, 669–674.
Samet, J., & Krewski, D. (2007). Health effects associated with exposure to ambient air pollution. J Toxicol Environ Health A, 70(3–4), 227–242.
Schutte, I., & Brits, A. (2012). Prioritising transport infrastructure projects: towards a multi-criterion analysis. Southern African Business Review, (3), 97–117.
WHO. (2006). Air quality guidelines for particulate matter, ozone, nitrogen dioxide and sulfur dioxide. Global update 2005. Summary of risk assessment. Geneva, Switzerland: World Health Organization. Retrieved from http://www.who.int/phe/health_topics/outdoorair/outdoorair_aqg/en/
1
2
TABLE OF CONTENTS
LIST OF TABLES ... 5 LIST OF FIGURES ... 6 LIST OF ACRONYMS ... 7 ACKNOWLEDGEMENTS ... 9Chapter 1. Introduction ... 11
1.1. Evidence in the general and environmental policy process ... 11
1.2. Case study: air quality policies in Lima and El Callao, Peru ... 14
1.2.1. Background: health effects of air pollution ... 14
1.2.2. Air pollution and air quality policy in Lima and El Callao ... 14
1.3. Objectives and structure of this dissertation ... 18
Chapter 2. Literature review ... 20
2.1. Methods ... 20
2.2. Cost–benefit analysis and environmental policy ... 21
2.2.1. Fundamentals of cost–benefit analysis ... 21
2.2.2. Application of CBA in air quality management ... 26
2.2.3. Limitations of CBA in the evaluation of environmental policies ... 27
2.3. Multi-criteria analysis and environmental policy ... 30
2.3.1. Fundamentals of multi-criteria analysis ... 30
2.3.2. MCA models... 32
2.3.3. Application of MCA in air quality management ... 38
2.3.4. Limitations of MCA in the evaluation of environmental policies ... 41
2.4. Combination of cost–benefit and multi-criteria Analyses ... 42
2.4.1. Combining the outputs of CBA and MCA ... 43
2.4.2. Expanding or modifying a CBA with MCA attributes ... 45
2.4.3. Integrating CBA components into a MCA framework ... 46
2.4.4. Creating a hybrid system... 47
2.4.5. Implications of CBA-MCA combination literature for case study ... 48
Chapter 3. Case study policy impact assessment ... 49
3.1. Introduction ... 49
3.2. Methods ... 50
3.2.1. Emissions scenarios ... 50
3
3.2.1.2. Action A2 (renewal of public bus transportation fleet) ... 53
3.2.1.3. Action A3 (promotion of vehicular natural gas in the bus fleet) ... 55
3.2.1.4. Action A4 (promotion and enforcement of vehicle maintenance) ... 55
3.2.2. Exposure to particulate matter at baseline (2010) ... 56
3.2.3. Health impact assessment ... 57
3.3. Results ... 61
3.3.1. Pollution at baseline and under prospective scenarios ... 61
3.3.2. Health impacts at baseline and under prospective scenarios ... 63
Chapter 4. Case study cost–benefit analysis ... 65
4.1. Introduction ... 65
4.2. Methods ... 65
4.2.1. Scope, timeframe and discounting ... 65
4.2.2. Benefits estimation ... 66
4.2.3. Costs estimation ... 68
4.2.4. CBA outputs and discount rates ... 72
4.3. Results ... 73
4.3.1. Benefits of proposed actions ... 73
4.3.2. Costs of proposed actions ... 74
4.3.3. CBA outputs ... 76
4.3.4. Sensitivity analysis ... 77
Chapter 5. Case study multi-criteria analysis ... 79
5.1. Introduction ... 79
5.2. Methods ... 79
5.2.1. The PROMETHEE-GAIA model ... 80
5.2.2. Preferences in PROMETHEE-GAIA ... 80
5.2.3. Rankings in PROMETHEE-GAIA ... 83
5.2.4. Weight stability intervals in PROMETHEE-GAIA ... 84
5.2.5. The GAIA plane ... 86
5.3. Ascertainment of criteria, weights and preferences ... 87
5.3.1. Interviews with key stakeholders... 88
5.3.2. Workshop with key stakeholders ... 89
5.3.3. MCA model parameters ... 94
5.3.4. Performance evaluation of actions... 96
4
5.4.1. Problem statement ... 97
5.4.2. Rankings and prioritization ... 98
5.4.3. Robustness of prioritization to weight variation ...100
5.4.4. Case study GAIA plane ...102
5.4.5. Conclusions of the case study MCA ...104
Chapter 6. Integrating MCA and CBA – application to the case
study ... 105
6.1. Introduction ...105
6.2. Combination of MCA and CBA outputs ...106
6.3. Expanding or modifying a CBA with MCA attributes...108
6.4. Integration of CBA into a MCA framework ...111
6.4.1. Introducing social economic costs and benefits into a MCA framework ...113
6.4.2. Introducing a “BCR” criterion into a MCA framework ...117
6.5. Conclusions of the combined application to the case study ...121
Chapter 7. Conclusions ... 122
REFERENCES ... 127
ANNEXES ... 141
ANNEX 1. Baseline data to calculate health cost per case ...141
ANNEX 2. Semi-structured interview (Spanish) ...142
ANNEX 3. Questionnaire for qualitative criteria in MCA (in Spanish) ...147
ANNEX 4. Weight stability intervals for original MCA ...151
ANNEX 5. Effect of normalization in the COSIMA approach on the case study ...155
ANNEX 6. Isolating the effect of BCR in Scenario 2 ...157
5
LIST OF TABLES
Table 1. Commonly used tools for the evaluation of environmental policies ... 13
Table 2. Examples of regulatory CBA for major interventions to reduce air pollution ... 27
Table 3. Key concepts in a multi-criteria analysis process ... 31
Table 4. Main characteristics of studies on the application of MCA to air quality policies ... 40
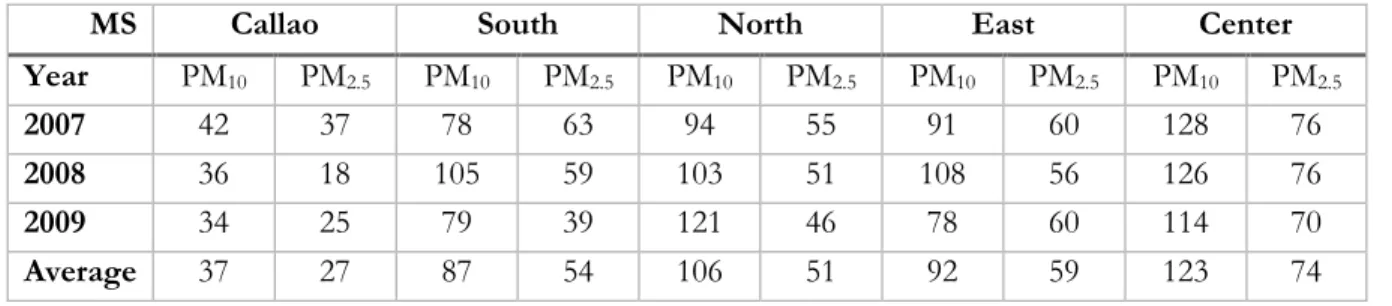
Table 5. Annual average concentrations of PM10 and PM2.5 in the MALC (μg/m3) ... 56
Table 6. Population and PM concentrations in the MALC ... 56
Table 7. Coefficients for morbidity outcomes attributable to PM10 ... 60
Table 8. DALYs lost per selected category of health effects ... 60
Table 9. Calculation of DALYs per case by category of health outcomes ... 61
Table 10. Concentrations of PM10 and PM2.5 in alternative scenarios, 2010-2020 ... 61
Table 11. Estimated health impacts of PM pollution in the MALC at baseline (2010) ... 63
Table 12. Total averted mortality and morbidity accrued over 10 years by each action ... 63
Table 13. Governmental budget allocated to action A2, by year ... 70
Table 14. Official vehicle inspection fees in the MALC, 2010 ... 71
Table 15. Projection of additional vehicles inspected by year under A4 compared with BAU scenario ... 72
Table 16. Estimated annual cost of health impacts (Soles, reference year 2010) ... 73
Table 17. Monetized annual health benefits (Soles) actions versus a “business as usual” scenario ... 73
Table 18. Governmental budget in Soles allocated to action A4, by year ... 76
Table 19. Cost–benefit analysis output indicators with no discounting... 76
Table 20. Cost–benefit analysis output indicators with a discount rate of 3% ... 76
Table 21. Sensitivity of benefit-to-cost ratios to VSL variation, under no discounting ... 78
Table 22. Sensitivity of benefit-to-cost ratios to VSL variation, under a 3% discount rate ... 78
Table 23. Types of preference functions in PROMETHEE ... 82
Table 24. Categories, criteria and point evaluation of their importance according to stakeholders ... 90
Table 25. Final set of criteria and weights ... 93
Table 26. Criteria units ... 94
Table 27. Criteria and their weights, as points and as a proportion of 1 ... 95
Table 28. Criteria preference functions choice and rationale... 96
Table 29. Original MCA problem, with criteria, weights and performance of each option ... 97
Table 30. Calculation of PROMETHEE I partial rankings ... 98
Table 31. PROMETHEE flows and resulting rankings ... 99
Table 32. Weight stability intervals for all criteria ... 100
Table 33. Scaling of "implementation" criterion ... 106
Table 34. MCA problem with all criteria in the same scale and preference function ... 107
Table 35. Change in VF and TRR with increasing values of α and score point ... 107
Table 36. MCA modified for application of ExternE CBA expansion ... 110
Table 37. Unit valuation of indirectly monetized criteria ... 110
Table 38. Variation in BCR due to indirect monetization of MCA criteria... 110
Table 39. Criteria and their weights in each considered scenario ... 113
Table 40. MCA Scenario 1 problem ... 114
Table 41. PROMETHEE ranking and flows in Scenario 0 and Scenario 1 ... 114
Table 42. Burden of disease (DALYs) avoided by each action, and its economic valuation ... 114
Table 43. Governmental and social cost of each action, in Millions S/. ... 115
Table 44. MCA Scenario 2 problem ... 117
Table 45. Scenario 2 PROMETHEE flows and resulting rankings... 117
6
LIST OF FIGURES
Figure 1. Yearly average of daily concentration of SO2 in Lima-Callao 2000-2010 ... 15
Figure 2. Yearly average concentration of NO2 in Lima-Callao 2000-2010 ... 15
Figure 3. Yearly average concentration of PM10 in Lima-Callao 2000-2010 ... 15
Figure 4. Steps in the analysis of the case study ... 19
Figure 5. COSIMA process for combining CBA and MCA outputs ... 44
Figure 6. Private car retirement rates by construction year under BAU scenario ... 52
Figure 7. Private car retirement rates by construction year under A1 scenario ... 52
Figure 8. Evolution of new vehicles incorporated to the private fleet ... 53
Figure 9. Bus retirement rates by construction year under BAU scenario ... 53
Figure 10. Bus retirement rates by construction year under A2 scenario ... 54
Figure 11. Bus fleet in the MALC under alternative scenarios ... 54
Figure 12. Bus fleet under A3 scenario ... 55
Figure 13. Evolution of PM10 emissions (Tm) from 2010 to 2020 under different scenarios... 62
Figure 14. New public transportation buses purchased ... 70
Figure 15. Annual expenditure in inspections ... 72
Figure 16. Net private cost of new vehicles by year (constant prices, reference year 2010) ... 74
Figure 17. Private expenditure in A2 relative to BAU (constant prices, reference year 2010) ... 74
Figure 18. Private and public costs A3 compared to BAU, (constant prices, reference year 2010) ... 75
Figure 19. Private net cost of action A4, (constant prices, reference year 2010) ... 75
Figure 20. Hierarchy and criteria groups for the MCA ... 94
Figure 21. Partial ranking PROMETHEE I ... 99
Figure 22. Complete ranking PROMETHEE II ...100
Figure 23. GAIA plane of the MCA problem Scenario 0 ...103
Figure 24. BCR and COSIMA TRR of actions at α=0.75 and increasing values of score point ...108
Figure 25. GAIA planes of Scenario 0 (top) and Scenario 1 (bottom)...116
7
LIST OF ACRONYMS
AF: attributable fraction AHP: analytic hierarchy process
AMR-D: subdivision of the WHO region of the Americas ARAPER: (Spanish) automotive dealers association of Peru BAU: “business as usual” scenario
BCR: benefit cost ratio BoD: burden of disease
CAI-LAC: Clean Air Institute for Latin American cities CBA: cost–benefit analysis
CE: choice experiments CEA: cost effectiveness analysis
CGIAL: (Spanish) management committee for the Clean Air Initiative CNG: compressed natural gas
COFIDE: (Spanish) Peru development finance corporation COI: cost of illness
CONFIEP: (Spanish) national confederation of private companies of Peru COSIMA: Composite Model for Assessment
CVM: contingent valuation methods DALYs: Disability-Adjusted Life Years
DEFRA United Kingdom Department of the Environment Food and Rural Affairs: DETR: United Kingdom Department of Transportation Planning
DIGESA: (Spanish) Peru environmental health directorate of the ministry of health DKK: Danish Kroner
DTU: Technical University of Denmark
ECAs: (Spanish) Peru environmental air quality standards ELECTRE: ELimination and Choice Expressing REality EUAC: equivalent uniform annual cost
ExternE: the External Costs of Energy, a research project funded by the European Union GAIA: Geometrical Analysis for Interactive Aid
GDP PPP: gross domestic product adjusted by purchasing power parity
ICD-10: International Statistical Classification of Diseases and Related Health Problems 10th Revision INEI: (Spanish) Peru national institute of statistics
IRR: internal rate of return
LAC: Latin America and the Caribbean LAM: linear additive model
LMP: (Spanish) Peru air quality maximum permissible thresholds MALC: metropolitan area of Lima and el Callao
MAUT: Multi attribute utility theory MCA: multi-criteria analysis
MCCBA: multi-criteria cost–benefit analysis MCDA: multi-criteria decision analysis MCDM: Multi-criteria Decision Methods NBER: National Bureau of Economic Research NOx: nitrogen oxides
8 NRA: National Roads Authority of Ireland
OECD: Organization for Economic Cooperation and Development
PISA-II: (Spanish) second plan for air quality improvement in Lima and Callao PM10: particulate matter smaller than 10 microns in diameter
PM2.5: particulate matter smaller than 2.5 microns in diameter PPI: potential Pareto improvement
PROMETHEE: Preference Ranking Organization METHods for Enrichment Evaluations PROTRANSPORTE: transportation authority of Lima and Callao
PV: present value
ROD: ranked order distribution SEB: social economic benefit SEC: social economic cost SEU: subjective expected utility
SMART: specificity measurability attainability relevance and time-boundedness SOx: Sulphur oxides
SUNAT: (Spanish) Peru national tax and tariffs superintendence SWF: social welfare function
SWING: standardized weight elicitation model
TOPSIS: Technique for Order of Preference by Similarity to Ideal Solution (TOPSIS) TRR: total rate of return
USEPA: United States Environmental Protection Agency VIKOR: multi-criteria optimization and compromise solution
VNG: vehicular natural gas VOCs: volatile organic compounds VSL: value of a statistical life WB: World Bank
WHO: World Health Organization WSI weight stability intervals: WTA: willingness to accept WTP: willingness to pay
YLD: years of life lost due to disability
9
ACKNOWLEDGEMENTS
I gratefully acknowledge the help and collaboration of: Sergio Sánchez, Executive Director of CAI-LAC; Juan Carlos Belausteguigoitia, former lead environmental economist of the LAC region at the World Bank; the World Bank Peru Country Office; all the members of the CGIAL and its coordinator Gladys Macizo; all the stakeholders involved in this policy process, particularly Peter Davis (ARAPER), Cecilia Mendiola (ASPEC), José Estrada (PETROPERU), Francisco Fuentes (DIGESA); Congressman Jaime Delgado Zegarra; Francisco Pimentel (COFIDE); and all the helpful and kind personnel at the Ministry of Housing of Peru. Special thanks to my PhD supervisors, Dr Maria Paz Moral Zuazo of the University of the Basque Country (UPV) and Dr Aline Chiabai of the Basque Centre for Climate Change (BC3).
I would like to dedicate this dissertation to my growing family, especially Nina, who unlike me never doubted that I would get it finished.
10
“Systems were made for men, and not men for systems”
C.H. Douglas, Economic Democracy (1920)
11
Chapter 1.
Introduction
1.1.
Evidence in the general and environmental policy process
While the use of empirical data and rational evidence to inform policy is far from new, the notion that rational decision-making should systematically prevail before ideologically-driven politics is relatively recent. The term “evidence-based policy-making” was popularized during the mandate of A.C.L. (“Tony”) Blair, Premier of the United Kingdom from 1997 to 2007. The UK government itself openly committed to using such approach (UKCO, 1999), stating that “[The government must] produce policies […] shaped by the evidence rather than a response to short-term pressures”.
The arguments in favor of evidence-based policy-making have been discussed extensively elsewhere (Banks, 2009; Bullock et al., 2001; Sutcliffe & Court, 2005). Some commonly used ones are:
Transparency: by relying on and making use of objective data in a formalized framework, decision-making is less prone to be affected by personal and/or sectorial interests.
Accountability: the availability of information may help hold decision-makers and administrations accountable to institutions and the public.
Efficiency: evidence can steer public resources away from costly and ineffectual policies and into interventions that provide the best financial and/or social returns.
Relevance: evidence can highlight the urgency of an issue and how it fits the real needs of the communities, which in turn may result in improved outcomes for the selected interventions.
However, the approach also draws criticism. A few frequently cited by researchers in the field are:
Resources: the collection and analysis of solid evidence frequently entails a financial cost and capacities that may not be readily available or affordable by the decision-making body.
Scope: evidence is just one element of decision-making, and neither can nor should displace other important ones such as values, political considerations, etc.
Speed: decision-making in the policy process often needs to happen in shorter timeframes than those required to gather adequate data and produce sound scientific evidence.
Uncertainty: very frequently, data and science cannot provide conclusive evidence on one or more aspects of the actions analyzed. Moreover, this sometimes creates a communication gap between analysts and decision-makers regarding the interpretation of uncertainty.
There are many more arguments in favor and against the reliance on evidence for policy-making proposed by researchers, policy-makers, analysts and other relevant actors. This dissertation does not enter that debate, and simply assumes significant value in the availability and use of relevant evidence for decision-making.
Researchers in the field commonly disaggregate the policy process in different stages. These stepwise models can be used to identify “entry points” for policy inputs, including evidence. There are numerous conceptual models describing these stages in a linear (or rather, circular) way, the scope of which is besides the intent of this dissertation.
12
A simplified conceptual model by Young & Quinn (2002) based on Anderson (1994) among others, can be summarized in the following steps:
1. Problem definition/agenda setting: at some point in time or periodically, one or more groups within society identify a particular issue that is deemed to require government action. Once acknowledged the issue and need for action by the government, it is included into the political agenda.
2. Policy alternatives/formulation: once the problem is defined and in the government’s agenda, and upon gathering enough detail information, policy alternatives are defined. Ideally those should be mutually exclusive, so that adequate prioritization can occur.
3. Selection of preferred policy option/s: once policy alternatives are defined, one or more policy options are selected based on a set of evaluation criteria. These criteria can vary widely (e.g. effectiveness, cost, feasibility, etc.) but once agreed upon, they can serve both to prioritize the most suitable alternative/s and to defend the legitimacy of selected policy options.
4. Policy design: once the policy option/s are selected, government authorities need to decide how to implement them most effectively, including choices as to which instruments to use, mechanisms of enforcement if necessary, etc.
5. Implementation and monitoring: the policy option/s is/are implemented according to the policy design. Simultaneously, information on process and intermediate outcome/s is collected in order to enable an appropriate evaluation.
6. Evaluation: in order to accurately measure the effectiveness of any policy it is necessary to evaluate its outcomes. Such evaluation is particularly important as inputs for further policy-making processes. A common approach to gathering, analyzing and providing evidence in a workable format for the different stages of the policy cycle is the use of analytical tools imported from several disciplines. Depending on the specific needs of each policy process, analysts can resort to one or more of the vast pool of available analytical techniques that each discipline provides. The amount and diversity of those techniques is large and well beyond the objectives of this document, which will focus only on a subset of techniques commonly used to evaluate environmental policy.
In the case of environmental policy as in several other areas, public policy-makers require information on the foreseeable consequences of diverse policy interventions in order to make informed decisions regarding their implementation or revision. The range of approaches to gathering and organizing that information is large and growing, and although none of the existing tools are exclusive to the field of environmental policy, certain types of tools are systematically favored in this area (Table 1 lists some of the most widely used).
This dissertation deals only with tools which can include a central economic component that can be applied to environmental policy. The analysis is applied in the context of air quality management. The tools analyzed are cost–benefit analysis1 (CBA) and multi-criteria analysis (MCA), for several reasons. Firstly, they are comprehensive enough to be applied to almost any evaluation, which helps explaining why they are the most widely used tools regulatory impact assessment (OECD, 2008). Secondly, there is a very large body of literature on them (more so on CBA, but MCA is growing rapidly) spanning theoretical foundations, practical rules for application and several case studies to draw from. And thirdly, in combination they offer possibilities to consider economic impacts in broad terms, integrating monetized impacts with those that do not admit monetization. Moreover, there is little research on the possibilities of this combination, and how to draw the positive aspects of both tools.
13
Table 1. Commonly used tools for the evaluation of environmental policies
Evaluation tool Summarized description
Needs analysis Evaluation of the relevance of a policy by confronting expected outcomes with policy needs
Program theory evaluation Analysis of the assumptions and rationales upon which the policy is based, and its contribution to outcomes
Case study evaluation Analysis of real government intervention case studies that can serve as examples
Experiment and quasi-experiment
Measures effects of policies in selected groups, before and/or after the intervention
Formative/developmental evaluation
Evaluates effectiveness and the quality and performance of policy implementation
Goal-free evaluation The evaluator is not informed of the goals of the policy, rather focusing on needs of the impacted
Impact assessment Process of evaluating different policy impacts before their implementation Cost–benefit and
Cost-Effectiveness Analysis
Comprehensive and systematic evaluation of costs versus either economic benefits or impact of policies
Log frame method Provides and analyzes a logical summary of a project through a preset matrix of events vs. available information Multi-criteria analysis Explicitly considers criteria and their relative importance in the evaluation
of one or more policies
Realistic evaluation Includes the specific context in the evaluation to maximize impact in a specific situation
Source: Adapted from Crabbé & Leroy (2008).
MCA and CBA are used in difficult policy problems, including those concerning environmental risks. In urban settings, poor air quality is frequently among the most severe such environmental risks. Increasingly aware of the large burden that air pollution imposes, governments around the world are trying to tackle its causes and effects. However, adopting policies that effectively reduce urban air pollution is challenging, since such policies typically affect sensitive pillars of urban life, such as people’s mobility (Molina & Molina, 2005). Often times, actions required to improve air quality (e.g. fuel quality improvement) cannot be readily acted upon by local governments. The types of actions included in air quality management program frequently involve long timeframes and large investments. Importantly, considerable uncertainty as to the real effects of each measure plagues the decision-making in the process of improving urban air quality. These uncertainties have been frequently used as an argument in favor of the use of multi-criteria analysis (MCA) in urban environmental policy-making. MCA processes fit the characteristics of local urban decision-making regarding air quality, namely: 1) Hard budget constraints; 2) Limited capacity and data availability; 3) Conflicting views and criteria; 4) Need for inter-sectorial and multi-disciplinary action; and 5) Consensus is needed for an effective implementation.
Notwithstanding this alignment, the role of MCA in air quality policy evaluation remains minor in comparison with CBA. In this dissertation, the two tools (CBA and MCA) are applied to the same case study, separately and in combination, in order to obtain insights as to their relative and joint value for decision support. The case study, based on an actual policy process in a Latin American megacity, supports the conceptual exploration of the opportunities and pitfalls of the combination of CBA and MCA. The background and specifics of this case study are laid out in the next section.
14
1.2.
Case study: air quality policies in Lima and El Callao, Peru
1.2.1.
Background: health effects of air pollution
Evidence on the health effects of urban air pollution has been substantial for decades, with extensive studies showing the association between certain air pollutants and respiratory and cardiovascular mortality, chronic bronchitis, respiratory infections, and several other related disorders, both acute and chronic (Golub et al., 2014). These health outcomes affect disproportionately some vulnerable groups, including children, the elderly and those with preexisting cardiovascular and respiratory conditions (Dockery & Pope, 2006; Dockery et al., 1993; Katsouyanni et al., 2001; Pope et al., 1995; Pope et al., 2002). Although health effects are not the only impacts2 of air pollution in cities, they are the most important and best studied. Epidemiological studies show an association between certain air pollutants and respiratory and cardiovascular mortality, chronic bronchitis, respiratory infections, and several other disorders. Research shows the strongest effects for inhalable particulate matter, particularly PM2.5 (smaller than 2.5 microns in diameter). After comprehensive reviews on the effects of particulate matter on health in the late 1990s and early 2000s (e.g. Dockery & Pope, 2006; Pope et al., 2002) large epidemiological studies, including meta-analyses, have followed. These included multiple locations, mostly in Europe and North America (e.g. Samet et al., 2000). Large cohort studies (Brook, 2010; Eftim et al., 2008; Samet & Krewski, 2007) have since confirmed significant effects of inhalable particles on mortality and morbidity in different age groups.
Because of the severity of their health effects and their preponderance in the burden of disease caused by urban air pollution, fine particles are commonly used in studies on the cost of environmental degradation as the exposure indicator of choice to assess attributable mortality and morbidity (Golub et al., 2014). Notwithstanding, several types of anthropogenic emissions are associated with adverse health outcomes, including (but not limited to) sulfur oxides, nitrogen oxides, volatile organic compounds (VOCs), carbon monoxide, lead, and especially ozone (WHO, 2006). Tropospheric (i.e. ground-level) ozone can trigger a large number of respiratory effects and aggravate certain chronic diseases, thus increasing outcomes such as health care usage or absenteeism, with high costs to society (USEPA, 2011, 2012). Overall, however, both the population-wide observed effect and the evidence on impacts of particles is greater than those of any other major air pollutant (WHO, 2006).
Besides the solid body of literature from developed countries, a growing body of evidence is being established from cities in Latin American countries. There are currently several studies from large and medium cities in Mexico, Brazil and Chile (for instance Bell et al., 2011; Bell et al., 2006; O’Neill et al., 2008). However, the amount of locally-generated information available regarding the health effects of air pollution in Peru is scarce, in particular with regard to peer-reviewed epidemiological studies.
1.2.2.
Air pollution and air quality policy in Lima and El Callao
Air quality monitoring in the Metropolitan Area of Lima and El Callao (hereafter MALC) is carried out through five monitoring stations placed in different parts of the city: Callao, South, East, Center, and North. According to governmental data (DIGESA, 2012), the concentrations of Sulfur dioxide (SO2) and Nitrogen Dioxide (NO2) have dropped sharply in the capital area since the year 2000, when systematic measurements started, to well below the established national regulatory thresholds (80 and 100 micrograms per cubic meter, respectively) by 2010.
2 Other typical impacts of urban air pollution include loss of visibility, damages to buildings and cultural heritage, corrosion of materials and various impacts on vegetation.
15
The same, however, cannot be said about inhalable particulate matter (PM) which on average has stayed over the regulatory thresholds (50 and 15 micrograms per cubic meter for PM10 and PM2.5, respectively). These trends are visible in Figure 1, Figure 2, and Figure 3 below3.
Figure 1. Yearly average of daily concentration of SO2 in Lima-Callao 2000-2010
Source: DIGESA, 2012. Years in X axis. Concentration units (Y axis): µg/m3
Figure 2. Yearly average concentration of NO2 in Lima-Callao 2000-2010
Source: DIGESA, 2012. Years in X axis. Concentration units (Y axis): µg/m3
Figure 3. Yearly average concentration of PM10 in Lima-Callao 2000-2010
Source: DIGESA 2012. Years in X axis. Concentration units (Y axis): µg/m3
3 The monitoring stations are denoted by their coded names in Spanish: Callao (for El Callao); L. Sur (for South); L. Este (for East); L. Centro (for Center) and L. Norte (for North). Additional detail on the situation is provided in Chapter 3.
0 20 40 60 80 100 120 140 2000 2001 2002 2003 2004 2005 2006 2007 2008 2009 2010
Callao L. Sur L. Este L. Centro L. Norte
0 50 100 150 200 250 2000 2001 2002 2003 2004 2005 2006 2007 2008 2009 2010
Callao L. Sur L. Este L. Centro L. Norte
0 20 40 60 80 100 120 2001 2002 2003 2004 2005 Año 2006 2007 2008 2009 2010
16
In summary, and according to the available data, the MALC has a severe air pollution problem, largely due particles emitted by mobile sources (i.e. vehicles), which supposes an environmental health risk causing premature mortality and disease. These health outcomes are largely preventable through coordinated policies that could effectively reduce population exposure to air pollutants, and specifically inhalable particles.
Efforts towards a comprehensive management of air quality in Peru started in earnest in the late 1990s with the incorporation of Lima to the World Bank-sponsored Clean Air Initiative for Latin America, followed by regulations establishing maximum thresholds for key pollutants. The 2001 National Air Quality Standards decree (Reglamento D.S. Nº 074-2001-PCM) established basic thresholds (locally known as Estándares de Calidad Ambiental del Aire) that were subsequently developed and sometimes modified by other regulatory tools. In the late 2000s the Maximum Permissible Thresholds (Spanish acronym: LMP) were progressively approved in order to limit emissions by mobile and stationary sources in all urban areas, but with special focus on the MALC. Whereas the LMPs are unlikely to change in the short term, ECAs have been progressively lowered in a continuous policy process.
Currently, most competencies regarding environmental issues are carried out by the Peruvian Ministry of the Environment. However, air quality remains an exception, with competencies shared among the Ministry of Housing, the environmental health directorate (Spanish Acronym: DIGESA) of the Ministry of Health and the Ministry of the Environment. Of note is the role of the “Committee for the management of the clean air initiative for Lima and Callao” (CGIAL), a multi-stakeholder organ maintained by the Ministry of Housing which has in effect designed and developed most air quality regulations and policies.
In the MALC, the capital area and largest metropolitan concentration of Peru, the first comprehensive air quality management program was the “Plan integral de saneamiento atmosférico para Lima y Callao 2005-2010” (General air quality improvement plan for Lima and Callao 2005-2010), a heterogeneous pool of measures affecting mobile and stationary sources, fuel quality, economic incentives, urban management and traffic calming. Such measures were unequally implemented but marked a strong improvement in general air quality in the MALC, even in a context of rapid motorization rates. In summary, Nitrogen and Sulfur Oxides have decreased significantly in the last decade, but inhalable particles (PM10 and PM2.5) remain on average above national standards and continue to represent a significant public health hazard.
Acknowledging this situation, the “Second plan for air quality improvement in Lima and Callao” (hereon PISA-II) set out to curb air pollution trends, and specifically to reduce PM levels. PISA-II is structured into three work programs:
P1: Reduction of the emissions and concentrations of particulate matter;
P2: Mid-term pollution prevention and abatement; and
P3: Research in air pollution.
According to the CGIAL (and sensibly, in terms of public health) the most urgent program is P1, aimed at reducing particulate matter, so this dissertation focuses on said program. The proposed timeframe of the plan was from 2011 to 2015. However, most of the policies (including those pertaining mobile sources) were as of the end of 2014 neither evaluated nor implemented.
17
The key activities within the PISA-II plan with potential for reduction of particulate matter can be integrated into four actions, formulated as follows:
Action 1 (A1), private vehicle fleet renewal: this action is based on the implementation of a vehicle fleet renewal scheme, including incentives for the purchase of new vehicles and disincentives for the use of older vehicles, which in this case are proposed as variations of the existing tax regime as applied to light vehicles. This would be complemented by a sweeping ban on imports of used light vehicles and their incorporation into the vehicle fleet: Peru’s private vehicle fleet is one of the oldest in Latin America, vehicles are on average more than 12 years old (ARAPER, 2011).
Action 2 (A2), bonus for scrapping older public transportation vehicles: public transportation in the MALC is atomized into myriads of providers operating obsolete and polluting vehicles. This policy is meant to incentivize the replacement of these older vehicles by newer, cleaner ones through a bonus for scrapping, a measure used in multiple settings across the world.
Action 3 (A3), promotion of vehicular natural gas (VNG) use in public transportation vehicles, specifically through the allocation of grants for the retrofitting of public transportation vehicles in order to be able to use VNG, as well as a line of loans with no interest to facilitate the purchase of new, native VNG user vehicles.
Action 4 (A4), enforcement of better vehicle maintenance: this entails an overall effort to enforce better vehicle maintenance, thus reducing net pollutant emissions through better functioning engines and exhausts. In this direction, a renewed effort of compliance monitoring can ensure that inspections are carried in accordance with national standards. It will be further enforced through random checks of vehicle emissions in streets and roads: this measure intends to increase the proportion of vehicles that actually undergo annual inspection from the pool that is mandated by law to have such inspections. Compliance levels are currently rather low, inducing poor maintenance which in turn results in higher pollutant emissions.
These actions and their implications are further detailed in Chapter 4 (CBA), and they constitute the basis of the CBA and MCA problems, and of the subsequent integration which is the focus of this dissertation. The purpose of the evaluation in the case study is not to discard alternatives in favor of an “optimal” one, but rather to have an idea of the trade-offs and potential benefits of each, so that their implementation can be prioritized or postponed in a context of challenging governance, competing public demands and constrained resources.
This case study resulted from a request of technical assistance from the competent authorities in air quality management in Peru (the Ministry of Housing) to the Clean Air Institute in Washington, DC. My help (in collaboration with the Clean Air Institute) was requested in exploring decision-support tools for the prioritization of sectorial policies aimed at improving air quality in the capital city area, and specifically to consider cost–benefit analysis and multi-criteria Analysis. The PISA-II air quality management plan was established as an illustrative case study, specifically its actions to reduce particulate matter. Despite the timeframe of PISA-II, the analyzed actions are as yet neither evaluated nor implemented. These actions are also not mutually exclusive, and in principle all will eventually be implemented. Relevant information was obtained from direct sources of the Ministries of the environment, housing, energy, health and finance; the national institute of statistics, the national geographic institute, the municipalities of Lima and El Callao, COFIDE (Corporación Financiera de Desarrollo, a public-private development bank), and two industry associations (ARAPER and CONFIEP, Asociación de Representantes Automotrices del Perú and Confederación Nacional de Instituciones Empresariales Privadas, respectively).
18
1.3.
Objectives and structure of this dissertation
Both MCA and CBA present numerous advantages (as well as some disadvantages, explored in the literature review chapter) for the problem at hand. Moreover, advantages of each approach roughly complement each other, raising the question of whether a combined approach could preserve the main qualities of each analysis while simplifying the output for decision support. This question has received little attention in the relevant literature, and thus is relatively open. Therefore, the main objectives of this dissertation are:
To provide a background to understand the implications of the combined use of CBA and MCA, and to develop a conceptual framework for the integration of the two methods.
To lay out and analyze the main methodological options for CBA-MCA combination and apply them to a real case study for the prioritization of air quality policies in the local governance context (an application not yet featured in the published literature, to my knowledge).
To explore advantages and disadvantages, strengths and conceptual pitfalls of each combination option.
In summary, I intend to explore the feasibility and added value of the possibilities of combination through a case study of air quality management options in a large metropolitan area. The case study serves as a connecting thread for the conceptual discussion. The different steps of the core analysis of the case study are illustrated in the next page (Figure 4). The structure of the dissertation from here onwards is as follows:
A review of the relevant literature on CBA and MCA in the context of air quality (Chapter 2);
An impact assessment of the actions proposed in the case study (Chapter 3);
A CBA of the actions proposed in the case study (Chapter 4);
A MCA of the actions proposed in the case study (Chapter 5);
A set of possible combinations of the CBA and the MCA applied to the case study, with a discussion on the value of each combination approach (Chapter 6);
Conclusions of the process (Chapter 7)
In addition, this work is bound to add some value for research and a degree of novelty:
In the case of the CBA, it adds to a very small pool of examples of an application of the technique at the local level for air quality management in the region of Latin America and the Caribbean;
In the case of the MCA, the added value is two-fold: firstly, its application in this context is rare for cities in LAC; secondly, the entire process is driven by the stakeholders, including the scoping, criteria ascertainment, and weighing; this is also rather uncommon in the existing literature;
The application of a CBA-MCA combination to local air quality policy in LAC is, to my knowledge, not yet featured in the published literature. In addition, after applying published CBA-MCA integration approaches to the case study, a novel approach for the combination of both techniques is proposed.
What follows in Chapter 2 is an overview of the scientific literature regarding the concept and framework of both CBA and MCA, as well as their application to air quality management. The chapter also explores the published approaches for the combination or integration of CBA and MCA for decision-support purposes, including their theoretical basis, general application and specific use for environmental policy with a focus on air quality management. The main limitations of each technique are also listed and elaborated on.
19
20
Chapter 2.
Literature review
2.1.
Methods
In a well-developed area like the application of decision-support tools to environmental policy, any overview of the current state of the science requires a comprehensive literature review. Given the potentially large number of references, I developed a basic search strategy and basic selection criteria for inclusion in the review. These restrictions were particularly important in the review of evidence in the application of each of the analysis (CBA and MCA) where an indiscriminate search would have provided an unmanageable number of references. However, such restrictions were deliberately loosened in the main topic of concern (the combination of both tools) in order to capture the bulk of relevant literature in that specific area. The principles used in the literature review were thus:
Search strategy: relevant research concerning the topics covered in the structure above was identified through a search in scientific and economic databases (RePEc, ScienceDirect, JSTOR, EBSCO, NBER) as well as academic search engines (Google scholar and Mendeley) and electronic libraries (Source OECD, Worldbank iLibrary and the Royal Library at the University of Copenhagen). The search terms were deliberately kept broad to capture most relevant studies. These included the single terms and combinations of: multi-criteria analysis, multi-criteria decision analysis, public policy cycle, evidence-based policy-making, decision-support systems, environmental policymaking, cost–benefit analysis, air quality management, air quality policy prioritization, environmental policy evaluation tools, combination multi-criteria cost benefit. After a first review of articles found using these terms, further key literature and authors were identified through referenced citations (backward snowballing), and accessed mostly through direct e-journal consultations. In addition, to capture governmental reports, international organization publications and grey literature, an internet search was conducting using the same search terms in two freely available internet search engines (Google and Duckduckgo).
Selection criteria: As far as possible, academic journal articles were used. All materials for which proper authorship, date of publication or attribution could not be established were discarded. For large research area topics such as public policy, decision-support systems, or the application of CBA or MCA, only those studies and publications directly related to environmental policies and/or air quality management policies were kept. However, for areas where literature is scarce, such as the combination of MCA and CBA, all relevant material was kept regardless of its relationship with environmental policies.
The results of the literature review are presented in phases: first, cost–benefit analysis in environmental policymaking (framework, application, examples and limitations); second, multi-criteria analysis in environmental policymaking (framework, application, examples and limitations); and last, the combinations of CBA and MCA (strategies and examples). The rest of this chapter summarizes the most relevant information derived from the reviewed literature, in order to establish the theoretical basis for the analysis and to ensure the originality of the work presented.