Bankruptcy Prediction for Financial
Sector of Pakistan: Evaluation of Logit
and Discriminant Analysis Approaches
*Usama Ehsan Khan
Abstract- Bankruptcy prediction is one of the core area in finance that is quite rich in empirical and theoretical work. This study compares two models for measuring the financial position of financial firms listed in Karachi Stock Exchange. The study gives a comprehensive review of two models, namely Altman’s [1] Z-score and an O-Score derived from Ohlson [14]. The purpose of this paper is two folded. First to identify unique characteristics of business failure and to compare effective variables responsible for this response. Secondly to compare two popular accounting-based measures. summarize publicly-available information about bankruptcy. The sample period for this study is from 2009 to 2015. From the KSE listed financial firms, a total of 40 firms were selected and accounting ratios were extracted from balance sheet analysis reports published by State bank of Pakistan. The empirical results concluded that the logit model has a high rate of classification as compared to multiple discriminant analysis. The model has obtained overall 85.5% accuracy and identified three significant accounting ratios that are: retained earnings to total asset, earnings before income and taxes to the total asset, and current liabilities to total asset. The finding of this study would benefit stakeholders that are affected by bankruptcies. So in order to take an advantage, it is important to understand the phenomenon that causes bankruptcies.
Keywords: Multiple Discriminant Analysis, Logit, and Z-Score.
I. I
ntroductIonFinancial distress is the situation when a company becomes unable to meet its financial
obligations. There have been numerous studies regarding bankruptcies since the pioneering studies of Beaver [7] and Altman [1]. Multiple models and techniques have been proposed widely to
examine bankruptcy in order to help investors, managers, and financial analysts. A prediction model
can also be used to aid these decisions and that can act as a warning system. Events, like Global
Financial crisis of 2007 challenged the predictability of the existing models. Predicting financial distress of companies from financial ratios have been explored in various ways and model may
still be very useful. Extensive literature is available on predicting bankruptcy based on historical accounting ratios, security market information or macroeconomic indicators. Recent studies argued for the combined approach. Tinoco and Wilson [16] tested all three set of variables and concluded that the utility of combined approach is higher. These models have been extensively applied to the
companies through statistical procedures such as MDA, logit, hazard and more recently artificial
The present study contributes to the existing literature. It identifies the merits of logit model over
discriminant analysis (DA). This model also helps in determining potential factors that are affecting
significantly the financial status of the companies in the financial sector. Moreover, there has been no investigation of bankruptcy for the financial sector of the Pakistan, although the economy heavily
relies on this sector. None of the world wide studies have particularly focused on Pakistan. There
are only a few studies that have explored the financial vulnerability of the firms in the context of Pakistan but they are mainly concerned with non-financial sectors. The previous research of Abbas and Rashid [5] employed multiple discriminant analysis (MDA) for the non-financial sector
of Pakistan and achieved 76.9% prediction accuracy. Mehta [13] conducted a study for assessing
the financial position of textile sector. His study use 37 bankrupt and 53 non-bankrupt companies
and modeled bankruptcy using logit discriminant model. Their model achieved 92% accuracy.
Waqas, Hussain and Anees [17] used probit model and attained a maximum of 73.8% accuracy in classification. His study was based on 412 companies of the manufacturing sector of Pakistan.
Bankruptcy study is of great significance for practitioners, financial analyst and academicians.
Pakistan is a developing country with the status of emerging markets. A large number of bankruptcy incidents have occurred in the last two decades, so there is a growing need of developing prediction models with a certain level of accuracy.
The structure of the rest of the paper is as follows. Section: 2 reviews the existing literature,
section: 3 is a methodology and data, section: 4 show the results and section: 5 is the conclusion of
the study.
II. L
Iteraturer
evIewBankruptcy prediction and evaluation of financial distress are the core areas of finance. The
literature is quite rich with bankruptcy prediction studies. Since the 1960s, researchers have been contributed much in order to examine the bankruptcy prediction all over the world.
The study of Beaver [7] is considered as the pioneering work in the area of bankruptcy prediction,
which identified 30 ratios and by using univariate logistic model, the study found that best predictor was working capital to debt ratio and net income/total assets which correctly classified 90% of the
cases. Altman [1] used a similar model for bankruptcy prediction by using multiple discriminant
analysis (MDA) and developed Z - score model which identified five accounting ratios responsible for such discrimination. If the company’s Z-score is above 2.675, it indicates a fine financial status; if it is less than 2.675 then it indicates that the company has financial vulnerabilities. Altman’s [1] model remained a benchmark model for other studies. He revisited Z-score and ZETA model to improve the predictability by including non-manufacturing firms as well. This study was based on a sample of 66 corporations and found that model has a 95% rate of classification.
Ohlson [14] used a probabilistic model by using nine financial ratios and argued that probabilistic
model has advantages over MDA as it does not require variables to be normally distributed. This is
quite common that financial variables deviate from normal distribution. Recent study of Ahmadi, Soleimani, Vaghfi, and Salimi [6] also verified the superiority of logistic model over MDA in terms
of bankruptcy prediction. Recently, Keener [11] showed the predictive ability of logit model by
using a sample of 1203 retail firms and five financial ratios. His study concluded the extremely accurate prediction using logit. Hardle and Prastayo [10] showed the higher prediction accuracy of regularized logit model for South East Asian economies by using 24 accounting ratios. Their study
employed Lasso and elastic-net penalty functions for the approach of regularization.
Several other studies also used different methods with different set of variables for assessing
financial sustainability. For example, Cihak and Hesse [8], whose analysis examined the relative performance of Islamic banks and their financial status. Their study used 77 Islamic banks and 397
commercial banks from 20 different countries and by using z-score, the study concluded that small
Islamic banks are financially healthy than small commercial banks, but the case is reversed for large banks. However, small Islamic banks tend to financially more stable than that of larger Islamic banks. Lennox [12] used a sample of 949 firms and examined the bankruptcy using logit, probit, and DA. The study revealed that well-specified logit and probit models can identify failing companies
more accurately.
III. d
ataandM
ethodoLogyThis section is devoted to the sample and the methodology employed in the study. It firstly tells
about the sample and variable selection which is followed by the data analysis. A. Sample and variable selection
The population consists of all those companies that are listed in KSE and the sample covers
20 financially sound companies and 20 financially distressed companies. Pindado, Rodrigues and Torre [15] stated two conditions that are needed to be met in order to predict the financial distress
condition, (i) when earnings before interest, taxes, depreciation and amortization (EBITDA) are
below their financial expense for two consecutive years, and (ii) firm suffers from negative growth in market value for two consecutive years. This study used following criteria for the financially distressed firm:
1) All financial companies that are delisted by the Karachi Stock Exchange (KSE) due to
liquidation/ winding up under court order.
2) The company must have at least five years of financial information.
less than its expense for two consecutive years.
The total number of companies confirming the aforementioned criteria was 20, then 20 financially sound firms were randomly selected. So, there are total 40 firms with five years of
observation available over the period of 2009-2015.
The data has been extracted from “Financial statement analysis of financial sector” published
by the State bank of Pakistan. This study included following accounting ratios:
1) Working capital/Total assets (WCTA). The working capital to total assets is the liquidity ratio found frequently in corporate problems. It is the measure of net liquid asset to the total
capitalization. It is one of the five accounting ratios that were the best predictor classified
by Altman [1].
2) Retained earnings/Total assets (RETA). Retained earnings are the account that shows the
total amount of reinvested earnings or loses over the entire life of the firm. It is also referred
as earned surplus.
3) Earnings before income and taxes/Total assets (EBITTA). It is the measure of the firm’s
productivity, refraining from any tax or leverage effect. Firm’s survival is ultimately depending upon its earning capacity.
4) Book value/Total assets (BVTA). Book value is also the net asset value. Book value to total asset is the fraction of the net asset from the total assets.
5) Debt to equity ratio (DE). It is the ratio that compares the capital invested by owners to the capital provided by lenders. Since high debt to equity ratio can put the business at risk, so it is the appropriate ratio for the bankruptcy study.
6) Total income/Debt (TID). TID proxy the leverage ratio. It proxies the long run leverage effect.
7) Current asset/current liabilities (CACL). It is the ratio that ascertain whether a company’s short term assets are available to pay-off its short-term liabilities.
8) Net income/Total assets (NITA). It is the most common ratio to measure profitability of the firm.
9) Current liabilities/Total assets (CLTA). Current liabilities are short-term liabilities. CLTA is the measure of short-term leverage effect to the firm.
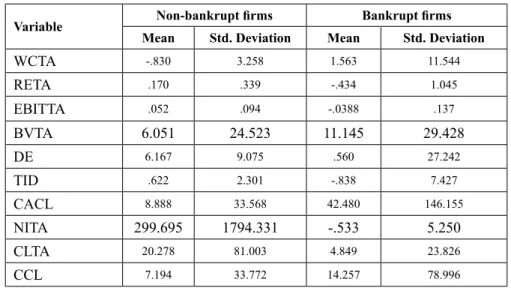
10) Cash/Current liabilities (CCL). Cash available measure the liquidity of the firm and it is the measure component of current assets. CCL ratio is measuring liquidity of the firm. The mean and standard deviation of ten financial ratios of the company are reported in the Table-1. It is evident that the high indebtedness, lower profitability and poor liquidity are the key
characteristics of the bankrupt firms which support our analysis.
TABLE 1 Profile AnAlysis
Variable Non-bankrupt firms Bankrupt firms
Mean Std. Deviation Mean Std. Deviation
WCTA -.830 3.258 1.563 11.544 RETA .170 .339 -.434 1.045 EBITTA .052 .094 -.0388 .137 BVTA 6.051 24.523 11.145 29.428 DE 6.167 9.075 .560 27.242 TID .622 2.301 -.838 7.427 CACL 8.888 33.568 42.480 146.155 NITA 299.695 1794.331 -.533 5.250 CLTA 20.278 81.003 4.849 23.826 CCL 7.194 33.772 14.257 78.996
B. Data Analysis Models
Over the last many decades bankruptcy prediction remained a hot topic. Extensive work has been done in this area and there are several models proposed by various studies of bankruptcy. Abbas and Rashid [5] obtained 76.9% accuracy by using MDA while Mehta [13] found 92% accuracy of
logit model when applied to textile sector of Pakistan. This study models financial distress by using both MDA and logit model for the financial sector of Pakistan aimed to identify the model with higher rate of classification.
C. Multiple Discriminant Analysis (MDA)
Altman [1] derived a Z-score model for the bankruptcy prediction by combination of five ratios with the extension of Beaver’s [7] approach. In 1977, Altman, Haldeman, and Narayan [2] obtained Z-score model for non-manufacturing firms that contains four accounting ratios. The model that is
developed through MDA takes the following form:
Z= β1X1+ β2X2 +β3X3+ β4X4+….+ βnXn. (1)
Where Z is the overall Z-score and βi are the discriminant coefficients and X1, X2,…Xn are the
independent variables. MDA technique can draw the best combination of the key ratios from the set of accounting ratios. We choose the best predictor by looking F and Wilk’s lamda statistics to check
statistical significance of each individual ratio. Further, chi-square statistics are also used for- the overall significance of various discrimination functions.
D. Binary logit model
The profile analysis in Table-1 shows that the bankrupt firms have several unusual characteristics. In order to model the financial distress of the company through accounting ratios, an alternative approach is probabilistic model (i.e. logit). Following Ohlson [14], we now estimate the probability of default of the firm.
We assume that marginal distribution of the failure follows the logistic distribution of the following form:
= β0 + β1X1+ β2X2 +β3X3+ β4X4+….+ βnXn (2)
Iv. e
MpIrIcaLr
esuLtsThis section provides the empirical estimates of multiple discriminant analysis (MDA) and logit
model. Furthermore, receiver operating characteristic (ROC) curve technique is used to evaluate the
predictive performance of the models. A. Results of the discriminant analysis
A sample of 40 companies with five years of data resulted 200 firm-year observation. We initially used ten financial ratios and through step-wise multiple discriminant analysis (MDA) we identified six ratios that are depicted in Table-2. Ratios are selected according to their relative significance and maximum significance to enter the variable is 10%.
TABLE 2
VAriAbles entered / remoVed
Step Entered Wilks’ Lambda F-Statistics Sig.
1 RETA .867 30.329 .000 2 EBITTA .793 25.645 .000 3 CACL .769 19.641 .000 4 CLTA .752 16.113 .000 5 WCTA .739 13.709 .000 6 DE .727 12.050 .000
At each step, the variable that minimizes overall Wilk’s Lamda is entered. a Maximum number of step is 20
b Maximum significance of F to enter is 0.10. c Minimum significance of F to remove is 0.20.
The discriminant procedure concluded significant variables and excluded the remaining variables as shown in Table-2. Consequently, from the set of prior ten accounting ratios, six accounting ratios
are selected. Retained earnings to total asset (RETA), EBIT to total asset (EBITTA), current asset
to current liabilities (CACL), current liabilities to total asset (CLTA), working capital to total asset (WCTA) and debt to equity (DE) were found significant at 1% level of significance.
The final Z score/discriminant score derived from Table-2, takes the following form:
Z=0.077 + 0.044WCTA + 1.110 RETA+ 4.465 EBITTA + 0.012 DE – 0.003 CACL + 0.005 CCL
Where, Z is the Discriminant score. The midpoint or the cut-off value of the non-bankrupt and
bankrupt centroid is zero. It can be concluded that the movement of the firm’s Z-score above zero is approaching toward non-bankrupt group and the firm’s Z-score below zero is approaching toward the bankruptcy. Finally, the firm having Z-score -0.609 classified as “bankrupt” and the firm having Z-score -0.609 is classified as “non-bankrupt”, as depicted in Table-3.
TABLE 3 GrouP Centroid
Group Z-score
Non-bankrupt .609
Bankrupt -.609
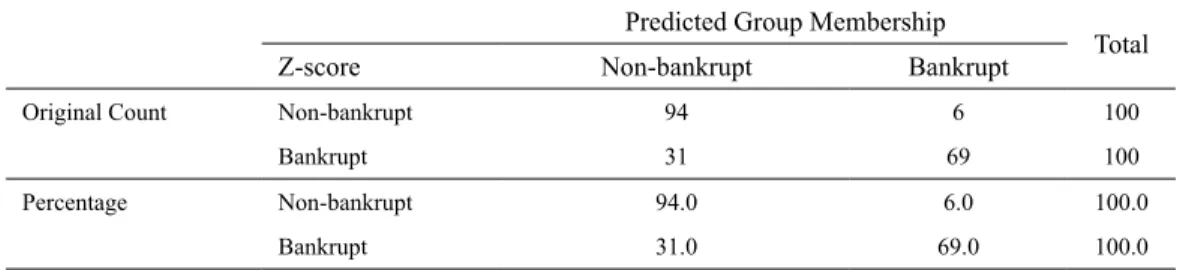
The classification results presented in Table-4 compares the actual with the predicted outcome. The model has overall 81.5% accuracy of classification. It is evident that six significant financial ratios have high classification power which suggests that model has potential to predict corporate
failure in Pakistan.
TABLE 4
ClAssifiCAtion results: disCriminAnt AnAlysis
Predicted Group Membership
Total
Z-score Non-bankrupt Bankrupt
Original Count Non-bankrupt 94 6 100
Bankrupt 31 69 100
Percentage Non-bankrupt 94.0 6.0 100.0
Bankrupt 31.0 69.0 100.0
B. Results of the logit model
Logit model is very popular in prediction since it has a probabilistic interpretation embedded in
it It can be seen from Table-5 that the signs of the estimates are almost same as expected. Coefficients
in the table depicted are the odd ratios and the p-value is the probability value of the corresponding
earnings to the total asset (RETA), earnings before income and taxes to the total asset (EBITTA) and
current liabilities to the total asset (CLTA).
Signs for RETA and EBITTA are negative as expected because firms with higher retained
earnings to total asset ratio are less likely to default. Furthermore, EBITTA is the measure of the
productivity of the firms so it was expected to have the negative relationship between probability of
default and EBITTA which is supported from the empirical evidence of the study. TABLE 5
loGit results
Variables Coefficients p-value
WCTA 0.033 0.726 RETA -4.780* 0.000 EBITTA -6.600** 0.022 BVTA 0.00008 0.993 DE -0.018 0.263 TID 0.018 0.828 CACL 0.0093 0.277 NITA -0.0013 0.819 CLTA -0.0188* 0.009 CCL -0.00929 0.381 _cons 0.1779 0.424 * Significant at 1% ** Significant at 5%
Classification results in Table-6 reported that out of 100 non-bankrupt firms-year observations, 91 were considered as non-bankrupt and from 100 bankrupt firms-year observation model successfully classified 80 firms as bankrupt so the model accuracy in this regard is 80%. Overall model acquired 85.5% prediction accuracy.
TABLE 6
ClAssifiCAtion results: loGit model
Predicted Group Membership
Total
Z-score Non-bankrupt Bankrupt
Original Count Non-bankrupt 91 9 100
Bankrupt 20 80 100
Percentage Non-bankrupt 91.0 9.0 100.0
Literature evident that the logit model has a high rate of classification of bankrupt and non-bankrupt companies. However in context to Pakistan, it was not revealed that whether it has a high rate of prediction in financial sector. This study shows that the logit model has potential to be used for bankruptcy in the financial sector.
C. Receiver Operating Characteristic (ROC) curve analysis
Receiver operating characteristics (ROC) curve was developed by engineers in world war-II in order to analyze the position of the enemy. Later it gained popularity in different fields and financial literature also made intensive use of ROC curve to compare the predictability of the models. Altman, Sabato, and Wilson [4] argued that the ROC curve plots the false positive rate and true positive rate to discriminate between two groups. Cleves and Rock [9] used ROC curve technique to compare the
predictive accuracy of the probit and logit probabilistic models.
Figure-1: ROC curve analysis
The area under the ROC curve (AUC) corresponding to the model-1 is 87.4% and AUC corresponding to model-2 is 88.2%. Overall, AUC for the two models showed that model-2 corresponds marginally higher rate of classification.
v. c
oncLusIonConsistent with the previous studies, logit model has outperformed as compared to the
the financial sector of Pakistan. The financial sector is the backbone of the Pakistan’s economy.
Bankruptcy prediction work as a warning bell therefore should be accurate giving timely predictions. The discriminant analysis has produced a model with six accounting ratios namely retained earnings
to total asset (RETA), EBIT to total asset (EBITTA), current asset to current liabilities (CACL), current liabilities to total asset (CLTA), working capital to total asset (WCTA) and debt to equity (DE). The model has attained an accuracy of 81.5%. The estimates provide that firms having a Z-score below zero are more toward bankruptcy, however, Z-score above zero indicates financially healthy firms.
In addition to this, logit model produced a parsimonious model with three significant financial ratios and has attained overall 85.5% accuracy. These three ratios are retained earnings to the total
asset (RETA), earnings before income and taxes to the total asset (EBITTA) and current liabilities to
the total asset (CLTA). It is evident that these three ratios are also among six ratios provided by DA. Furthermore, RETA and EBITTA were also identified by benchmark Z-score model of Altman [3].
In aggregate, this study provides comparison of the classification accuracy and predictive power
of two well-known models in the area of bankruptcy. It contributes to the bankruptcy prediction
literature using a broader definition of bankruptcy. The advantage is that the definition used in this study does not only correspond to the bankruptcy but includes those who are financially distressed. Second, this study revealed the bankruptcy situation in the financial sector, which has filled the gap in the existing literature. Third, it explored three significant variables that have a high predictive accuracy if modeled with logit. Furthermore, the study confirmed that logit model is the most
parsimonious model as it possesses relatively high prediction accuracy with rather a small number
of variables in the financial sector also. This study suggests that stakeholders should keep these significant ratios in order to assess the financial health of the firm.
r
eferences[1] E. Altman, “Financial ratios, discriminant analysis and the prediction of corporate bankruptcy,” J. finance, 23(4), 589-609, 1968.
[2] E. Altman, G. Haldeman, and P. Narayanan, “ZETATM analysis A new model to identify bankruptcy risk of corporations,” J. Banking and Finance, 1(1), 29-54, 1977.
[3] E. Altman, “Predicting financial distress of companies: revisiting the Z-score and ZETA models,” Stern School of
Business, New York University, 9-12, 2000.
[4] E. Altman, G. Sabato, and N. Wilson, “The value of non-financial information in small and medium-sized enterprise risk management,” The J. Credit Risk, 6(2), 95, 2010.
[5] Q. Abbas, and R. Ahmad, “Modeling Bankruptcy Prediction for Non-Financial Firms: The Case of Pakistan,” Available at SSRN 1917458, 2011.
[6] S. Ahmadi, B. Soleimani, H. Vaghfi, and M. Salimi, “Corporate bankruptcy prediction using a logit model: Evidence from listed companies of Iran” World Applied Sciences Journal, 17(9), 1143-1148, 2012.
2008.
[9] A. Cleves, and L. Rock, “From the help desk: Comparing areas under receiver operating characteristic curves from two or more probit or logit models,” The Stata Journal, 2(3), 2002, pp. 301-313.
[10] K. Härdle, and D. Prastyo, “Default Risk Calculation based on Predictor Selection for the Southeast Asian Industry,”2013
[11] M. Keener, ”Predicting The financial failure of retail companies in the united states,” J. Business and Economics Research (Online), 11(8), 2013, pp. 373.
[12] C. Lennox, “Identifying failing companies: a re-evaluation of the logit, probit and DA approaches. J. Economics and Business, 51(4),1999, pp. 347-364.
[13] A. Mehta,“Rescuing Business; Analysis of Bankruptcy in textile Sector of Pakistan Using Logit Model From Year 2005-2010,” Strategic Management Quarterly, June. 2014, pp. 81-99.
[14] A. Ohlson, “Financial ratios and the probabilistic prediction of bankruptcy,” J. accounting research, 1980, pp. 109-131.
[15] J. Pindado, L. Rodrigues, and C.Torre, “Estimating financial distress likelihood,” J. Business Research, 61(9), 2008,
pp. 995-1003.
[16] H. Tinoco, and N. Wilson, “Financial distress and bankruptcy prediction among listed companies using accounting, market and macroeconomic variables,” International Review of Financial Analysis, 30, 2013, pp. 394-419.
[17] H. Waqas, N. Hussain, and U. Anees, “ Zmijewski financial distress prediction model and its predictability: A case of Karachi stock exchange. J. Basic and Applied Scientific Research, 4(4), 2014, pp. 155-163.