University of Zurich Main Library Strickhofstrasse 39 CH-8057 Zurich www.zora.uzh.ch Year: 2019
Lightweight Assessment of Test-Case Effectiveness using
Source-Code-Quality Indicators
Grano, Giovanni ; Palomba, Fabio ; Gall, Harald
Abstract: Test cases are crucial to help developers preventing the introduction of software faults. Unfor-tunately, not all the tests are properly designed or can effectively capture faults in production code. Some measures have been defined to assess test-case effectiveness: the most relevant one is the mutation score, which highlights the quality of a test by generating the so-called mutants, ie variations of the production code that make it faulty and that the test is supposed to identify. However, previous studies revealed that mutation analysis is extremely costly and hard to use in practice. The approaches proposed by re-searchers so far have not been able to provide practical gains in terms of mutation testing efficiency. This leaves the problem of efficiently assessing test-case effectiveness as still open. In this paper, we investigate a novel, orthogonal, and lightweight methodology to assess test-case effectiveness: in particular, we study the feasibility to exploit production and test-code-quality indicators to estimate the mutation score of a test case. We firstly select a set of 67 factors and study their relation with test-case effectiveness. Then, we devise a mutation score estimation model exploiting such factors and investigate its performance as well as its most relevant features. The key results of the study reveal that our estimation model only based on static features has 86% of both F-Measure and AUC-ROC. This means that we can estimate the test-case effectiveness, using source-code-quality indicators, with high accuracy and without executing the tests. As a consequence, we can provide a practical approach that is beyond the typical limitations of current mutation testing techniques.
DOI: https://doi.org/10.1109/TSE.2019.2903057
Posted at the Zurich Open Repository and Archive, University of Zurich ZORA URL: https://doi.org/10.5167/uzh-169143
Journal Article Accepted Version Originally published at:
Grano, Giovanni; Palomba, Fabio; Gall, Harald (2019). Lightweight Assessment of Test-Case Effective-ness using Source-Code-Quality Indicators. IEEE transactions on software engineering:1-17.
Lightweight Assessment of Test-Case
Effectiveness using Source-Code-Quality
Indicators
Giovanni Grano, Fabio Palomba, and Harald C. Gall
Abstract—Test cases are crucial to help developers preventing the introduction of software faults. Unfortunately, not all the tests are properly designed or can effectively capture faults in production code. Some measures have been defined to assess test-case effectiveness: the most relevant one is the mutation score, which highlights the quality of a test by generating the so-calledmutants,
i.e., variations of the production code that make it faulty and that the test is supposed to identify. However, previous studies revealed that mutation analysis is extremely costly and hard to use in practice. The approaches proposed by researchers so far have not been able to provide practical gains in terms of mutation testing efficiency. This leaves the problem of efficiently assessing test-case effectiveness as still open. In this paper, we investigate a novel, orthogonal, and lightweight methodology to assess test-case effectiveness: in particular, we study the feasibility to exploit production and test-code-quality indicators toestimatethe mutation score of a test case. We firstly select a set of 67 factors and study their relation with test-case effectiveness. Then, we devise a mutation score estimation model exploiting such factors and investigate its performance as well as its most relevant features. The key results of the study reveal that our estimation model only based on static features has 86% of both F-Measure and AUC-ROC. This means that we can estimate the test-case effectiveness, using source-code-quality indicators, with high accuracy and without executing the tests. As a consequence, we can provide a practical approach that is beyond the typical limitations of current mutation testing techniques.
Index Terms—Automated Software Testing, Mutation Testing, Software Quality
✦
1
I
NTRODUCTIONSoftware testing is a crucial part in the process of evolv-ing and deliverevolv-ing high quality software, especially when catching regression faults [1]. Development teams rely on test case results and code reviews to decide on whether to merge a pull request [2] or to deploy a system [3]; moreover, their productivity is partly dependent on the quality of tests [4]. Thus, being able to assess the reliability of a test case is of a paramount importance for a number of software maintenance and evolution activities.
In recent years, the research community heavily inves-tigated novel approaches for automatically evaluating the quality of tests [5]. Amongst the others, mutation testing is widely recognized as the high-end test coverage criteria [5]: the basic concept of mutation testing is the creation of artificially modified versions of the source code, called mutants[6]. Changes in the production code are introduced bymutation operatorsto mimic real faults [7]; at the end, the test suite is executed against such mutants and evaluated according to the resulting mutation score, i.e., the ratio of detected(i.e., killed) mutants over the total number of gen-erated ones. Previous studies showed that mutation testing provides developers with a better and trustworthy test-case effectiveness measure with respect to other code coverage criteria (e.g., branch or block coverage) [7], [8].
Despite being so powerful, mutation testing still has one major limitation: it is an extremely expensive activity • G. Grano, F. Palomba and H.C. Gall are with the University of Zurich,
Switzerland
E-mail:{grano, palomba, gall}@ifi.uzh.ch
since it requires (i) the generation of the mutants, (ii) their compilation, and (iii) the execution of the test suites against each of them. Given its nature, this process becomes harder and harder as the size of a system increases during its evolution or when the frequency of commits is high [9].
To address the scalability limitation of mutation testing, researchers investigated three types of approaches [10]: (i) the“do fewer” ones, where the goal is to select a subset of mutants to evaluate; (ii) the“do smarter”ones, that exploit run-time information to avoid unnecessary test executions; and (iii) the “do faster” ones, that aims at reducing the execution time for each single mutant [11]. While these ap-proaches provided some promising results, Gopinath et al. [12] showed that most of them do not provide enough prac-tical gain in terms of mutation testing efficiency if compared with a random selection of mutants. As a consequence, the problem of automatically assessing test-case effectiveness in a timely and efficient manner is still far from being solved.
In this paper, we present a novel methodology to as-sess test-case effectiveness, which is orthogonal to exist-ing approaches. Rather than workexist-ing on the quality or quantity of mutants to generate, we investigate to what extent we canestimate test-case effectiveness—as indicated by mutation analysis—by using source-code-quality indicators computed on both production and test code (e.g., quality metrics [13] or code/test smells [14], [15]). It is important to immediately point out that the use of Machine Learning (ML) techniques in the context of mutation testing has been initially explored by Zhang et al. [16], who proposed a classification model aiming at selecting the most powerful mutants by predicting whether a mutant will be killed or
not. Their technique, therefore, can be seen as an assistant tool for other mutation testing assessment techniques, which can use the model to speed up their performance. The goal of this paper is diametrically different, as we aim at studying the possibility to devise a estimation model able to directly estimate the mutation score of test classes relying on source-code-quality metrics. We argue that such a predictive model might be exploited (i) to limit the use of mutation analysis,e.g., by focusing expensive computations only on some specific tests, and (ii) to support developers in understanding what are the characteristics (i.e., the features used by the estimation model) of both production and test code that limit/boost test-case effectiveness.
With this aim, we firstly conduct an exploratory study to understand the relation between 67 different factors and test-case effectiveness. On the basis of this preliminary study, we then propose and evaluate a Machine Learning model to discerneffectivetests fromnon-effectiveones.
The key results of our study reveal significant differences betweeneffectiveandnon-effectivetest code with respect to a number of test and production-code factors, which can be thus further explored. A test-code effectiveness estimation model exploiting static code-quality metrics can achieve about 86% of both F-Measure and AUC-ROC; moreover, when compared with a model that also includes statement coverage as predictor (i.e., the coverage criterion that is more related to test-code effectiveness according to recent findings [16], [17]), we observe that the use of dynamic in-formation can only provide partial improvements, thus not being extremely needed for obtaining better performance. We argue that the devised static model can be practically useful to assess test-case effectiveness in a real-case scenario, since it does not require the execution of the test cases.
Replication packageTo enablefull replicabilityof this study, we publish all the data extraction and analysis scripts in our replication package [18].
2
R
ELATEDW
ORKMutation testing is an expensive activity and, thus, research has been conducted in last years to reduce its computational cost. In this section, we present an overview of the various approaches presented to achieve such a goal. For the sake of space limitation, we do not discuss previous work having as goal the definition of techniques for improving mutation testing. However, a complete overview on these approaches is available in the survey conducted by Jia and Harman [5]. Offutt and Untch [10] grouped techniques for speeding-up mutation analysis into three distinct categories, i.e., do fewer,do smarter, and do faster. The first category has been the most investigated one: It aims at reducing the number of mutants to be evaluated. Kurtzet al.[19] relied on sym-bolic execution to build static subsumption graphs, where a mutant subsumes another if tests that kill the first also kill the second one. Such graphs are then used to reduce the number of mutants to consider for the mutation analysis. Strug and Strug [20] used machine learning classification algorithm to detect and discard similar mutants. The pro-posed approach relies on a hierarchical graph representation of mutants, representing a graph kernel using to compute the similarity. Justet al.[21] exploited run-time information
in order to reduce the number of mutant executions. When two mutants lead to the same state, only one execution is needed, while the other can be inferred. Recently, Gopinath et al.[12] empirically showed that common mutation reduc-tion techniques do not give advantage over random sam-pling, given the tiny effectiveness improvements and the considerable introduced overhead. Zhu et al. [11] showed how to improve the efficiency of mutation testing adopting Formal Concept Analysis to cluster mutants and test cases based on reachability (code coverage) and necessity (weak mutation) conditions. Their results show that the approach can speed up mutation analysis up to 94 times, maintaining an accuracy > 90%. The papers discussed above share the goal of reducing the computational time required to apply mutation testing and assess test-case effectiveness. Our work has the same underlying objective: nonetheless, we propose a drastically different alternative, namely a lightweight estimation model exploiting static source-code-quality attributes as opposed to more expensive compres-sion or dynamic approaches.
The closest work to the proposed one is the study of Zhanget al.[16]. They devised a classification model relying on 12 static and dynamic features to estimate whether a mutant will be killed or not, showing that code coverage can be a powerful indicator for assessing the quality of single mutants. Therefore, the approach aims atselectingthe most powerful mutants in order to reduce the overall cost of mutation analysis. While Zhanget al. [16] initially showed the suitability of Machine Learning techniques in the context of mutation testing, they limit the approach to the evalu-ation of the quality of single mutants, as opposed to test cases. Moreover, they need to collect a series of dynamic information about code coverage and execute mutation testing, which still remains computationally costly besides requiring the exploitation of several tools for gathering the features to be used in the model and possibly hampering its applicability in a real-case scenario. Conversely, our work has a different and more comprehensive goal, namely the one of exploiting Machine Learning models to (i) estimate the overall effectiveness of test cases without performing any mutation analysis and (ii) support developers in the understanding of the key factors to take into account while developing test cases.
Furthermore, other Machine Learning applications have been experimented for software testing. Daka et al. [22] adopted the readability prediction model originally pro-posed by Buse and Weimer [23] in the context of auto-matic test case generation with the goal of improving the comprehensibility of the generated tests, while Granoet al. [24] preliminarily assessed the feasibility of branch coverage prediction models, showing promising results. Our work can be seen as complementary with respect to these papers, as it aims at estimating test-case effectiveness as measured by mutation score.
Finally, it is worth to remark that the proposed model could be helpful to filter out non-effective test cases. This potentially makes it suitable for improving existing test-case selection, minimization, and prioritization approaches [25]. As an example, the output of our model could be employed within search-based solutions (e.g., [26], [27]) as an additional fitness factor.
3
E
MPIRICALS
TUDYV
ARIABLESThe first step of our analysis is the selection of dependent and independent variables.
3.1 Dependent Variable
As dependent variable we use the mutation score, i.e., the percentage of killed mutants over the total of number of generated mutants [5]. The choice is driven by previous research in the field of software testing, which reports muta-tion score to be the most important code coverage criterion [5] as well as one the most relevant indicators for developers [7], [8]. To compute the mutation score, we rely on PITEST1 (or PIT). This choice is due to the fact that PIT was found to be the most mature publicly available mutation testing tool [28] and has been shown to limit the generation of equivalent mutants [29]. Moreover, it has been employed by most studies concerning mutation testing in the last years [4], [30], [31]. PIT generates mutants via bytecode manipulation and provides a wide set of built-in mutators. It provides a total of 13 mutation operators: 7 are active by de-fault,i.e.,Conditional Boundary,Increments,Invert Negatives, Math,Negate Conditional,Return ValuesandVoid Method Calls Mutator; 6 are by default deactivated,i.e.,Constructor Calls, Inline Constant,Non Void Method Calls,Remove Conditionals, Member Variable and Switch Mutator. In the context of this work, we apply all the 13 mutators provided by the tool: in this way, we can have a representative set of mutants. Indeed, we consider both line-related operators (e.g.,Invert Negatives) and class-related ones (e.g.,Member Variable Muta-tor), thus covering a wider range of of operators that better simulate the presence of real faults in production code. For the sake of space, we do not report a complete description of the operators in the paper; however, this can be find —along with code examples— in the PIT website.2 For each production class being mutated, we only execute the corresponding test case—retrieved according to the strategy explained in Section 4.1—rather than executing every time all the test cases of the considered projects (including those that are not related to the mutated production class). 3.2 Independent Variables
In the context of this study, we consider a total of 67 factors along 5 dimensions i.e., Code Coverage, Test Smells, Code Metrics,Code Smells andReadability. On the one hand, we consider all the code quality dimensions that include metrics statically computable: test smells, production and test-code metrics, code smells, and readability. Such metrics allow us to test whether the test effectiveness can be actually related to source-code quality. On the other hand, we select statement coverage with the aim of evaluating whether it is actually needed to assess test effectiveness (more details later in Section 4). Our final goal is to define a lightweight estimation model only relying on static code-quality fea-tures that can be quickly computed on the current version of test classes. Therefore, we exclude from our analysis the so-called process metrics (e.g., code churn or historical metrics about the pass/fail results of the tests). In the following sections, we briefly discuss the selection of the factors and
1 http://pitest.org 2 http://pitest.org/quickstart/mutators/
their extraction. For the sake of space, we report the detailed definition of the metrics, as well as the exact versions and parameters used by the data extraction tools, in the wiki page of our replication package [18].
3.2.1 Code Coverage
Code coverage describes the degree to which the production code is executed when a particular test case runs, and has been largely used in software engineering to decide on the quality of a test suite [32]. We compute the statement coverage, i.e., the number of production code statements executed by a test case, rather than other types of code coverage (e.g., branch or block coverage) because of several reasons: (i) Gopinath et al. [17] showed that this type of coverage is the most related to test-case effectiveness, (ii) it is fast computable by PIT and (iii) it has a direct relation with mutation operators that act at line-level [17].
3.2.2 Test Smells
Test smells represent sub-optimal design or implementation choices applied by developers when defining test cases [15], [33], [34]. On the one hand, previous research showed that the presence of test smells can lead the test code to be less maintainable [35]–[37]. On the other hand, recent work demonstrated that test smells can be related to problems like test flakiness or fault-proneness of test and production code [37], [38]. Thus, test smells may negatively influence the overall ability of a test case to find faults in production code. We investigate 8 different test smell types originating from the catalog by van Deursenet al.[15] and that, together with the others included in the catalog, have been shown to be either related to maintainability or effectiveness issues [35], [37], [38], i.e.,Assertion Roulette,Eager Test, Lazy Test, Mys-tery Guest,Sensitive Equality,Resource Optimism,For Testers Only, and Indirect Testing. A description of these factors is available in the wiki page of our replication package [18].
To detect these smells, we employ the detection tool proposed by Bavota et al. [35], which has been employed in several previous works in the area [34], [35], [38]. Unlike other existing detection tools (e.g., [39], [40], or [41]), this tool can identify all the test smells considered in this study with a high precision and recall (88% and 100%, respectively). To ensure the validity of the tool in the context of our study, we re-evaluate the precision of the detector3 on a statistically significant sample of 330 test smell instances it identified over the considered systems (more details on them in Section 4). Such a set is a 95% statistically significant stratified sample with a 5% confidence interval of the 2,323 total smell instances detected by the tool. The validation has been independently manually conducted by two authors of this paper, who verified each test method and con-firmed/refused the recommendation given by the detector. We evaluate the resulting validation agreement using the Krippendorff’s alpha Krα[42], a test that is generally more
reliable than other existing ones (e.g., Cohen’sk) [42]. The agreement was equal to 0.94, considerably higher than the 0.80 standard reference score for Krα [42]. The remaining
instances were discussed until an agreement was reached.
3 The recall cannot be evaluated because of the lack of an oracle of test smells for the considered projects.
As a result, the precision of the approach on our dataset is 85%, thus sufficiently accurate for performing our study. 3.2.3 Production and Test Code Metrics
This set is composed of 21 factors measuring both size and complexity of the code in various ways. We compute those metrics separately for both production and test code. Most of them belong to the object-oriented (OO) metric suite pro-posed by Chidamber and Kemerer [13], while others capture complementary aspects (e.g., the McCabe cyclomatic com-plexity [43]) or are an evolution of the original OO metrics (e.g., the LCOM5 defined by Henderson-Sellers [44]). The rationale for using these metrics is twofold. Firstly, larger and more complex production classes might be harder to test, and, as a consequence, writing effective test cases for such classes might be harder [45]. Secondly, large and complex test cases might deeper exercise thecode under test (CUT), leading to a better fault revelation capability. 3.2.4 Code Smells
Code smells indicate symptoms of the presence of poor design and implementation choices [14]. Previous research demonstrated that they contribute to the technical debt of a system, possible affecting its maintainability [46], [47]. For this reason, we include code smells into the considered factors; our hypothesis is that writing tests for smelly code is harder, and therefore, tests tend to be less effective. In the context of this work, we consider a total of 8 code smells,i.e., Class Data Should Be Private, Complex Class, Blob,Spaghetti Code, Message Chain,Long Method, Feature Envy,Functional Decomposition. Again, a detailed description of these smells is available in the shared wiki page. The choice of selecting this wide range of code smells is driven by the willingness of reaching a high degree of representativeness with respect to the entire set of code smells available in literature. Indeed, we consider design flaws that affect most of the suboptimal aspects of object-oriented design: from methods and classes having poor cohesion and/or high coupling and complexity to methods and classes presenting symptoms of poor encap-sulation or, again, developed using a different programming paradigm. Furthermore, these smells have different levels of granularity and have been shown to be highly harmful for both maintainability [47] and comprehensibility [48], [49].
We employ DECOR [50] to identify instances of the considered code smells. While the authors of DECOR al-ready showed its accuracy (F-measure=≈80%), we also re-evaluated its precision in the context of our work to ensure that this is the right tool to use. We follow a similar process as the one described for test smells: We manually validate a sample composed of 322 code smell instances output by DECOR. Also in this case, the stratified sample is deemed to be a 95% statistically significant (confidence interval=5%) of the 1,967 code smell instances detected. The Krαagreement
between the two authors was 0.96. In this case, the precision reached 75%: While this value can be considered pretty high, we are aware of the existence of other detection tools that might perform better (e.g., [51], [52]). Nevertheless, we still preferred DECORbecause it is lightweight and fast, as opposed to other approaches (e.g., the ones that analyze the entire change history of systems [51]).
3.2.5 Readability
The final dimension investigates the readability of both test cases and production code. Besides being a desirable prop-erty to have while performing maintenance and evolution tasks [53], readability-based metrics have been related in the past to the fault-proneness of source code [54]. Thus, it is reasonable to think that might be easier to write effective unit tests for readable production code [55]. At the same time, test cases with poor readability can be harder to be evolved and maintained [55], becoming less effective overtime. To compute the readability scores on both tests and CUTs, we rely on a state-of-the-art model defined by Scalabrino et al. [56]. This model improves the seminal work by Buse and Weimer [23] by (i) adding textual-based features, being able to be more precise in the assessment of readability, and (ii) training the model on both production and test code, allowing its usability in both the contexts. The approach computes the continuous readability level
r∈[0,1]as the probability for a given class to be readable. It is worth noting that we employed the original tool made available by Scalabrinoet al. [56] with the aim of avoiding biases due to re-implementation.
4
R
ESEARCHQ
UESTIONS ANDC
ONTEXTThegoalof the empirical study is to gain a deeper under-standing about the factors that might affect the effectiveness of test cases,i.e., the ability to reveal faults, with thepurpose of devising an automated approach able to support develop-ers when assessing the goodness of test cases. Theperspective is of both researchers and practitioners: The former are interested in evaluating the extent to which lightweight code quality indicators can be exploited as an alternative to standard mutation analysis to assess test-case effectiveness; The latter are instead interested in more scalable solutions to be adopted in a real use-case scenario.
To achieve our goal, we formulated three research ques-tions (RQs). The first one represents apreliminaryanalysis of the relation between the 67 independent variables selected and discussed in Section 3 and test-case effectiveness—as indicated by the mutation score. In particular, we aim at understanding whether and to what extent the distribution of the independent variables values differ for test cases hav-ing high or low mutation scores. If so, this might possibly indicate a dependence between independent and dependent variables considered that can be further explored:
RQ1.Is there a relationship between the selected code-quality
factors and test-case effectiveness?
Once established the value of code quality metrics in the context of test-case effectiveness assessment, we move toward the definition of an automated technique, based on Machine Learning approaches [57], able to estimate whether a test is effective or not, based on its mutation score. This leads to our second research question:
RQ2.To what extent can we estimate the effectiveness of test
Besides evaluating the mutation score estimation model as a whole, we then conduct a fine-grained analysis aimed at investigating which are the most relevant features em-ployed by the devised approach. This can provide further information for developers with respect to the source code aspects to keep under control to make a test case effective. Thus, we formulate our third research question:
RQ3. What are the important code-quality factors that can
indicate that a test case is effective?
The following sections examine the methodological choices applied to address our three research questions. 4.1 Context Selection
The context of the study is composed of 18 different Java open source projects whose characteristics are reported in Table 1. Specifically, the column “build” reports the build tool (eitherMavenorGradle) used by the selected projects; the column“pairs”reports the number ofhCU T, testi ana-lyzed,i.e., the pairs of associated production and test classes; the columns“LOC CUTs”and“LOC Tests”report the overall size of production and test classes in the considered systems; the column“mutants”shows the number of mutants gener-ated for every project. We select such projects as follow: at first, we select 8 Java open source projects from the list of projects used by previous mutation testing studies [7], [58], [59]: these are marked with a ‘*’ symbol in Table 1. Then, we rely on Google BigQuery4to select the most popular—based on the number of stars—GITHUB’s Java projects in 2017. We include the SQL query in our replication package [18]. 4.2 Linking Production to Test Classes
We consider the mutation score achieved by a test case when exercising the correspondent CUTs as a proxy measure of test-case effectiveness. Hence, starting from the JUnit test classes belonging to the considered systems, we need to identify the production class associated with each of them, i.e., we need to link each test class to a production class.
To select such pairs, depending on the build tool, we rely either on the pom(for the MAVEN projects) or on the build.gradle file (for the GRADLE ones). They contain the rules to identify the test classes to execute when the projects need to be built or packaged. We proceed as follows: At first, we identify all the production and test classes by scanning the pomor the gradle.buildfile, e.g., looking for the sourceDirectory and testSourceDirectory fields, in the former case. They indicate the location of the production and test code, respectively. If those fields are not explicitly reported, we consider the default source and test directories. After that, we use the include and excludetag of themaven-test-plugin(or of thetest task, in the case of GRADLE), so that we consider only the test cases that are actually ran when the project is built. In other words, we consider all test cases that developers of the subject systems ran when they test them, discarding those that are likely to be not reliable from the developers’ perspective [60]. Once completed this filtering phase, we use
4 https://cloud.google.com/bigquery/
TABLE 1
Characteristics of the projects used for the empirical study PROJECT BUILD PAIRS LOC CUTS LOC TESTS MUTANTS RxJava Gradle 442 109,978 159,044 21,181 cat Gradle 62 11,918 5,052 9,850 checkstyle* Maven 228 61,931 46,995 64,330 closure-compiler* Maven 308 140,264 165,600 95,742 commons-beanutils* Maven 56 15,293 20,465 5,542 commons-collections* Maven 103 27,950 23,344 9,957 commons-io* Maven 61 11,397 9,088 4,315 commons-lang* Maven 109 75,160 52,610 39,975 commons-math* Maven 409 133,248 95,589 88,865 fastjson Maven 64 30,107 6,376 36,903 gson Gradle 23 8,691 4,979 6,347 guice Maven 24 6,641 10,685 2,649 javapoet Maven 12 3,589 4,938 2,789 jfreechart* Maven 315 165,631 67,185 86,912 joda-beans Maven 11 3,939 2,712 3,038 jsoup Maven 23 9,872 5,861 7,974 junit4 Maven 48 6,898 5,599 3,066 opengrok Gradle 113 36,342 20,912 25,049 Total - 2,411 858,849 707,034 514,484
a pattern matching approach based on naming conventions to find the production class related to a certain test class, as done in many other previous work [34], [61], [62]. Such an approach has been previously empirically assessed [63], showing an accuracy close to 85%, that is comparable with more sophisticated but less scalable techniques (e.g., the slicing-based approach proposed by Qusef et al. [64]). We report in the following an example ofpomfile that refers to the APACHECOMMONSBEANUTILSproject.
1 <plugin> 2 <groupId>org.apache.maven.plugins</groupId> 3 <artifactId>maven-surefire-plugin</artifactId> 4 <configuration> 5 <includes> 6 <include>**/*TestCase.java</include> 7 </includes> 8 <excludes> 9 <exclude>**/*MemoryTestCase.java</exclude> 10 </excludes> 11 ... 12 </plugin>
It declares the include pattern **/*TestCase.java. We remove the detected pattern from the test filename and we use the obtained name to match the test with its CUT. For instance, given a test case DoubleConverterTestCase.java and the pattern **/*TestCase.java, we remove the word TestCase to determine the name of the CUT, i.e., DoubleConverter.java. While most of the projects use the default *Test.java pattern, we rely on the described approach to tackle non-default text matching. In case of noincludetags, we assume the default behavior.
5
O
N THEC
HARACTERISTICS OFE
FFECTIVET
ESTSThis section reports empirical study design and results aimed at answering to ourRQ1.
5.1 RQ1Design: Factors Analysis
With our first research question, we are interested in under-standing to what extent the distribution of the values related to the 67 considered factors differs for test cases havinghigh orlowmutation scores. To this aim we build two sets of test cases, namedeffectiveandnon-effective, starting from the all test cases in the exploited dataset. To assign test cases to
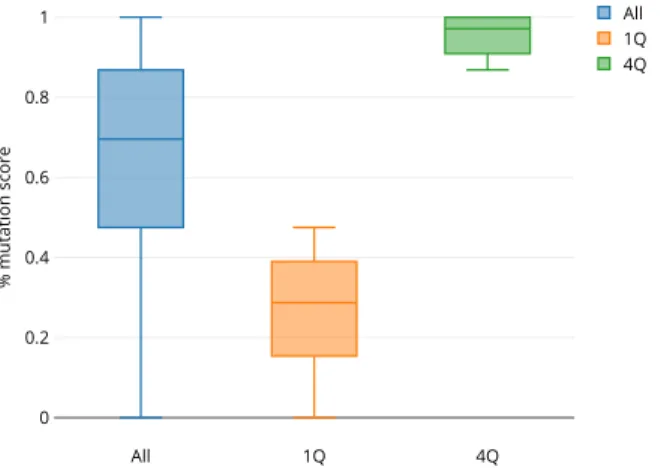
All 1Q 4Q 0 0.2 0.4 0.6 0.8 1 All 1Q 4Q % mutation score
Fig. 1. Distribution of the mutation score for the entire set, the first (non-effective tests) and the fourth quartile ((non-effective tests).
one of the two sets, we use the quartiles of the mutation score: those falling within the first quartile are assigned to the non-effective set, while the ones in the fourth quartile to the effective set. In this process, we discard test cases that fall between the first and fourth quartiles. This is a conscious design decision based on what has been reported in previous software engineering literature [65], [66] with respect to the so-called discretization noise [67]. This term refers to the introduction of biases in the data analysis due to the presence of data points that are not clearly assignable to a certain class. Since we aim at studying the characteristics of effective and non-effective tests, then we accept to not consider test classes having an average effectiveness and focus only on those that can be considered as having a high-or low-quality. Note that the impact of this design decision is further analyzed in Section 8. At the end of this process, theeffectiveset is composed of 604 test classes, while the non-effectiveone of 605 tests. It is worth to remember that every test in those set comes with its correspondent CUT.
Figure 1 shows the distribution of mutation scores con-sidering the entire dataset (“All”), the first (“1Q”), and the fourth (“4Q”) quartiles. As it is possible to observe, the effectiveset contains test classes often reaching the maximum mutation score (median = 0.97), meaning that they can actually considered as good test classes able to reveal faults in production code. As for thenon-effectiveset, we observe that the mutation score is much more scattered (median
= 0.28) and has 0.48 as maximum value: this means that the set contains test classes that are at most able to“kill”almost half of the mutants generated on the production class.
To answer RQ1, we compare the distribution of each
factors in the two sets of test classes applying the Wilcoxon Rank Sum statistical test [68] with α-value = 0.05 as sig-nificance threshold. Since we performed multiple tests, we adjusted ρ-values using the Bonferroni-Holm’s correction procedure [69]: it firstly sorts theρ-values resulting fromn
tests in ascending order of values, multiplying the smallest
ρ-value by n, the next by n−1, and so on. Then, each resultingρ-value is then compared with the desired signifi-cance level (i.e., 0.05) to determine whether there is statisti-cally significant difference in the distribution of two factors within the two sets of test classes. In the second place, we also estimated the magnitude of the observed differences
TABLE 2
Relation between each factor and mutation score. Rel. = relationship. “+” indicates that tests with higher mutation score have significantly
higher value on this factor; “-” indicates the opposite case DIMENSION METRICS REL D-VALUE
Coverage statement coverage + 0.84 (large)
Test Smells Eager Test - 0.31 (small)
CUT’s Code Metrics
LOC - 0.43 (medium) HALSTEAD - 0.40 (medium) RFC - 0.62 (large) CBO - 0.38 (medium) MPC - 0.58 (large) IFC - 0.29 (small) DAC - 0.35 (medium) DAC2 - 0.34 (medium) LCOM1 - 0.60 (large) LCOM2 - 0.49 (large) LCOM3 - 0.38 (medium) LCOM4 - 0.49 (large) CONNECTIVITY - 0.15 (small) LCOM5 - 0.39 (medium) COH - 0.37 (medium) TCC - 0.33 (medium) LCC - 0.39 (medium) ICH - 0.36 (medium) WMC - 0.61 (large) NOA - 0.35 (medium) NOPA - 0.23 (small) NOP - 0.44 (medium) McCABE - 0.62 (large)
Test Code Metrics
LOC + 0.22 (small) HALSTEAD + 0.17 (small) RFC + 0.37 (medium) MPC + 0.34 (medium) LCOM1 + 0.44 (medium) LCOM2 + 0.40 (medium) LCOM4 + 0.34 (medium) CONNECTIVITY + 0.25 (small) LCC + 0.35 (medium) ICH + 0.19 (small) WMC + 0.45 (medium) McCABE + 0.40 (medium)
Code Smell MC + 0.33 (medium)
FE - 0.31 (small)
Readability production - 0.19 (small)
test - 0.18 (small)
using the Cliff’s Delta (or d), a non-parametric effect size measure for ordinal data [70]. We interpret the effect size values following well-established guidelines [70],i.e., small for 0.147 < d < 0.33, as medium for 0.33 ≤ d < 0.474
and large for d ≥ 0.474. If the differences in the metric distributions ofeffectiveandnon-effectivetests are statistically significant and with a large effect size, then we verify the possible existence of a relationship between a certain factor and the effectiveness of test cases.
5.2 RQ1Results: Factors Analysis
Table 2 reports the results achieved for RQ1. For the sake
of space, we only show the factors having statistically sig-nificant difference,i.e.,p < 0.05and at least a small effect size. Factors having ad≥0.33,i.e., at least a medium effect size betweeneffectiveandnon-effectivetests are presented in
bold. The relationship direction is also reported: A “+” sign indicates a positive relationship, i.e., that tests with higher mutation scores exhibit higher values for the correspondent factor; On the contrary, a “-” sign indicates a negative relationship,i.e., when the test is more effective, the factor tends to be lower.
From the results we can observe that in most cases (41 factors out of 67, i.e., ≈61%) the differences between the distributions ofeffectiveandnon-effectivetests are statistically significant. Perhaps more importantly, 21 factors report a medium effect size and 8 a large one. This result seems highlighting that the two sets of test classes have relevant differences with respect to the qualitative parameters taken into account, possibly indicating therelevance of source-code-quality metrics —of both production and test code— for assessing test-case effectiveness. Deeper investigating the single dimen-sions, interesting findings arise. The first noticeable one is the relationship between statement coverage and mutation score, which is the strongest achieved in the entire set of collected factors (d = 0.84), i.e., the difference in terms of statement coverage between effective and non-effective tests is large and statistically significant. From the relationship direction we can claim thatthe more the statements executed by a test case, the higher its effectiveness. It is worth noting that this result partially contradicts studies that found code coverage to benotassociated to the ability of tests to reveal faults in production code [30], [32]. On the contrary, we can rather confirm the findings obtained by Gopinathet al.[17] and Zhanget al.[16] on the relevance of statement coverage as a metric related of test-case effectiveness.
A second noticeable finding concerns the relation be-tween test-case effectiveness and the metrics representing code complexity. Looking at the metrics computed on the production classes, 20 of them seem to have a relevant impact (i.e.,mediumat least) on test-case effectiveness: These are related to size (i.e., LOC), complexity (i.e., Halstead, RFC, WMC, and McCabe), coupling (i.e., CBO, MPC and DAC), cohesion (i.e., LCOM1, LCOM3, LCOM4, LCOM5, TCC, and LCC). As for size and complexity, our results confirm the “common wisdom” reporting that if the production code is large and complex, then test cases suffer more and cannot properly reveal faults [71]. Cohesion and coupling metrics support the result obtained for complexity: indeed, low cohesion and high coupling heavily contribute to the increase of source code complexity as well the decrease of source code maintainability [72], [73].
Similarly, we observe analogous relations between the code metrics computed on test code: indeed, 8 metrics have at least amediumimpact on test-effectiveness. They are again mostly related to complexity (i.e., RFC, McCabe and WMC), coupling (i.e., MPC) and cohesion (i.e., LCOM1, LCOM2, LCOM5 and LCC). However, in this case the direction of the relations is positive: this seems to suggest a tendency for whichthe higher the quality and the complexity of test code, the higher its ability to find faults in the production code. We cannot confirm this hypothesis based on our results, however we plan future studies on the relation between test-code quality and test-case effectiveness.
Looking at the relation between test-effectiveness and test smells, we do not observe important statistically signif-icant differences. Nevertheless, we show analmost medium result for theEager Test smell. Such a smell arises when a test checks more than one method of the class to be tested [15]. As reported in previous literature [41], [74], eager tests are harder to understand, being therefore hardly usable as documentation; moreover, production code tested by tests affected by this smell tends to be more fault-prone [37].
As a direct consequence, the test is likely to not be well-designed to effectively find faults and, at the same time, the production class badly-designed to be tested in isolation.
A similar phenomenon can be observed looking at code smells affecting the production code. Indeed, 2 out of 8 factors in this dimension have a statistically significant negative relationship with mutation score, meaning thatthe lower the number of code smells, the higher the ability of tests to find faults. This result is somehow expected, since code smells indicate the presence of design issues that make the source code more complex and harder to maintain [75], thus making the corresponding tests less effective.
Finally, we do observe a small difference in terms of readability betweeneffective andnon-effective tests for both production and test code. This may indicate that writing effective tests might be harder if the production code is less readable; on the other hand, a low test readability can be a symptom of general poor test quality [55].
The results discussed so far estimate test effectiveness as mutation scores obtained by using the 13 operators altogether. We also conduct additional analysis to estimate the impact on the relation between factors and effectiveness for each operator individually. This would indicate if, in practice, it would be more convenient to exploit subsets of the considered factors to estimate the effectiveness of tests with respect to specific mutations. To this aim, we re-run the experiment done inRQ1 by considering as dependent
variable the mutation score achieved when running PIT on individual operators. Our analysis reveals that the strength of the relation between the source code quality factors and the mutation score is way lower than the one obtained when considering the operators altogether. Note that having fewer operators would also decrease the effectiveness of mutation testing itself [7]. This is true for all the individual operators. From a practical perspective, this means that the larger the number of mutation operators used to estimate the effectiveness of a test, the higher the ability of source code quality indicators to be impactful in its estimation. The detailed results of this additional analysis are available in our replication package [18].
In Summary.Effective tests statistically differ from non-effective ones for 41/67 of the investigated factors. A test case tends to be more effective when it has a high statement coverage and does not contain test smells. The absence of design flaws in the CUTs and its quality represent strong factors for test effectiveness.
6
O
N THEE
STIMATION OFE
FFECTIVET
ESTSBased on the results achieved in RQ1, in this section we
present design and results of the empirical study conducted to answerRQ2andRQ3.
6.1 RQ2-RQ3 Design: Evaluating the Capabilities of a
Test-Case Effectiveness Estimation Model
To answerRQ2andRQ3, we (i) devise and evaluate a
test-case effectiveness estimation model only exploiting static code quality factors, (ii) compare the latter with a model that includes the statement coverage as independent variable,
and (iii) analyze what are the most relevant features that allows the model to estimate the effectiveness of tests. The following subsections detail the methodological steps conducted to answer our research questions.
6.1.1 Independent and Dependent Variables
As independent variables, we evaluate two different config-urations of the factors selected in Section 3, leading to the construction of two test-case effectiveness estimation models. In the first configuration, we consider all factors: while in our preliminary study we already identified a number of relevant factors that might be potentially used as predictors of test-case effectiveness, it is important to point out that in this research question we are adopting Machine Learning algorithms, which might (i) use different independent variables to properly estimate the dependent variable [57], [76], [77] and (ii) take into account interactions among independent variables, as opposite to the individual statistical tests ran in RQ1. In other words, it is not said
that the relevant factors identified through statistical tests (RQ1) are the same used by the Machine Learning algorithm
to estimate test-case effectiveness (RQ2). For this reason,
we involved all the factors in the construction of the first estimation model, letting the exploited classifier (Section 6.1.2) to decide on the their importance for classification. From now on, we refer to this model as thedynamicone.
In the second configuration, we decide to exclude the statement coverageas independent variable. This factor rep-resents the only dynamic metric used in the study: as such, in a real-case scenario it might be costly to compute since it requires the execution of all test cases of a software system. For this reason, we aim at measuring the extent to which a estimation model containing only statically computable code-quality features can estimate test-case effectiveness as opposed to a model that mixes both static and dynamic analysis being therefore, more computationally intensive. As a side effect of this design choice, we can also evaluate the actual gain (if any) given by code coverage to the performance of the estimation model. In the remaining of this paper, we refer to this model asstaticwhile we refer to the model exploiting statement coverage asdynamic.
Asdependent variablewe adopt the boolean classification of test-case effectiveness coming fromRQ1,i.e.,non-effective
andeffectivetests are based on the first and fourth quartiles of the mutation score distribution, respectively—the effect of discarding other tests is discussed in Section 8.
6.1.2 Selection of the Classifier
As shown in previous literature [78], the classifier used for prediction purposes can strongly influence the model per-formance. For this reason, we test different classifiers before selecting the one that fits better our estimation model: we compare RANDOM FOREST (RFC), K-NEIGHBORS (KNN), and SUPPORT VECTOR MACHINES (SVM), as these are (i) those more frequently adopted for the prediction of testing-related properties (e.g., Zhanget al.[16] and Strug and Strug [20] exploited these algorithms in their works), and (ii) they make different assumptions on the underlying data, as well as have different advantages and drawbacks in terms of execution speed and over-fitting [57]. The outcome of this step is the creation of six combination of estimation models,
i.e.,dynamic andstaticfor each classifier, which are trained and evaluated as reported in the following.
6.1.3 Preprocessing Steps
Before being able to properly evaluate the estimation mod-els, some preprocessing steps are required: Songet al. [79] proposed a general framework that defines an appropriate learning pipeline that includes (i) data normalization, (ii) feature selection, and (iii) classifier configuration. In our work, we included all these steps as detailed below. We do not apply any data balancing strategy [80], since the two classes—effective and non-effective tests—are naturally balanced (604 vs 605).
Data normalization. In both the configurations of fea-tures we perform the feature scaling (a.k.a., data normal-ization) [81], as recommended in previous works [82], [83]. This technique mutates the raw feature vector into a more suitable representation for the downstream estimator: such a normalization is needed to contrast the fact that different in-dependent variables have a pretty different range of values, whose make more likely the possibility that some of them get more influence than they should [81]. We rely on the STANDARDSCALER implemented in scikit-learn that processes the features by removing the mean and scaling to unit variance, thus centering the distribution around 0 with a standard deviation of 1. This scalarization is important especially for Support Vector Machine algorithms [84], since they assume the data to be in a standard range.
Feature Selection. While RFC is able to automatically filter out non-relevant features—thus avoiding problems related to multi-collinearity [85]—this is not true for KNN and SVM. To perform a fair comparison, in these cases we apply the WRAPPER feature selection algorithm [57], that systematically exercises all the possible subsets of features in order to identify the one giving the best performance.
Classifier Configuration. Finally, we also take into ac-count the problem of configuring the classifiers, as it has a strong impact on the final performance achieved by estima-tion models [86]. To this aim, we apply to all the models— following the procedure described in the next section— the well-known Grid Search method [84], which performs a systematic exploration of the parameter space to find the configuration giving the best performance. We rely on the GridSearchCVutility5provided byscikit-learn. 6.1.4 Training and Testing Procedures
To train and validate the experimented models, we use a nested cross-validation strategy [87]. This selection follows the advances achieved in the field of Machine Learning re-search [87], [88], which showed that nested cross-validation allows to reliably estimate generalization performance of a learning pipeline involving both parameters tuning and models evaluation. Indeed, model selection without nested cross-validation uses the same data for both the tuning and the evaluation: information might thus leak into the model overfitting the data, depending on the dataset size and on the model stability [89]. Nested cross-validation avoids that by using a set of train, validation and test splits in two separate loops: (i) aninnerloop, used to tuning the model
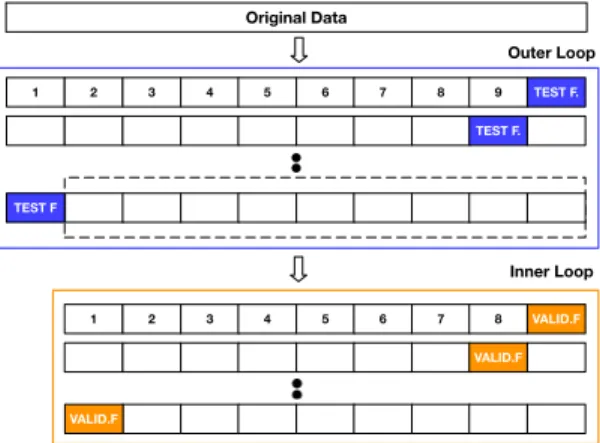
1 2 3 4 5 6 7 8 9 TEST F. TEST F. TEST F Original Data Outer Loop 1 2 3 4 5 6 7 8 VALID.F VALID.F VALID.F Inner Loop
Fig. 2. 10-fold nested cross-validation. The outer loop is contained in the blue box, while the inner loop used for parameters tuning is contained in the orange one.
parameters and (ii) anouterloop, used to evaluate the per-formance of the model. To better explain the procedure, Fig-ure 2 shows an example of 10-fold nested cross-validation. Assume we aim at tuning and evaluating a certain model
M that has a parameterk; and assume the goal is to find an assignment ofkin the setK = {10,100,1000,10000}that maximize the performance of the model.
The first step adopted by the nested cross-validation consists of dividing the entire set of data in 10 folds. One of these folds is retained as test (the blue box in Figure 2) and left untouched until the end of the computations done in the inner loop. The remaining nine folds are instead used within the inner loop: amongst them, one fold is reserved for the validation (the orange box in Figure 2), while eight of them are used to trainM for eachk∈ K. Once the training phase is completed, the resulting model is evaluated against the validation fold. This gives as output four performance measurements, one for each value of k. The procedure is repeated nine times, allowing each of the nine folds to be the test set exactly once: this leads to9·4performance indicators (that is, nine folds multiplied by four possible values ofk). Afterwards, thekthat minimizes the average training error over the nine folds is selected and used to evaluate M on the test folder previously left out the outer loop. Such a process is then repeated ten times, so that each fold of the outer loop is used as test once. The overall accuracy of the model is finally estimated using the mean of the evaluation measures over the ten test folds,i.e., the model with the best average is chosen.
Nested cross-validation allows to select an arbitrary number of folds for the inner and outer loop. In our study, we rely on 10-folds for both the two loops. To obtain such folds, we use a random stratified split approach: in this technique, each split contains approximately the same percentage of samples of each target class as the complete set. To accurately evaluate the trained models, we rely on 7 different widely-adopted evaluation measures,i.e., accuracy, precision, recall, F1 Score, AUC-ROC, Mean Absolute Error (MAE) and Brier Score [90]. From our experiments, the model based on the RANDOM FOREST classifier performs better than the others in terms of all the evaluation metrics considered. For the sake of space limitations, in the remain-ing of the paper we only report and discuss the results for this model, while a detailed report of the performance of
the models built using the KNN and SVM as classifiers is available in our replication package [18].
6.1.5 Feature Analysis
Besides evaluating the test-case effectiveness estimation model as a whole, we also conduct a fine-grained analysis to understand which are the most influential factors it uses to actually estimate the dependent variable. This fine-grained analysis aims at answering toRQ3.
To perform this examination, we rely on the built-in features of RANDOMFOREST: as explained above, the model built using this classifier performs better than the other experimented ones. Thus, we focus our feature analysis based on the characteristics of this specific model. In par-ticular, RANDOMFOREST can automatically select the most relevant features that influence the dependent variable. In doing so, it relies on the so-calledGiniindex (a.k.a., Mean Decrease in Impurity) [91], which indicates the relevance of a certain feature in terms of the reduction it provides to the overall entropy of the model, i.e., how much the model gains by having a feature as independent variable. By computing the Gini index for all the considered features during every validation run of the model, we can assess the gain provided by each feature. Then, we can rank the features according to the average Gini index achieved over the 10 different validation runs. Thescikit-learn implementation of the RANDOM FOREST algorithm stores the information about the Gini index of each feature in the feature_importances_vector variable of the model.
It is worth noting that while with the Gini index we can precisely estimate the contribution given by each pre-dictor to the actual predictions performed by the model and understand which factors are more relevant for the outcome, we cannot statistically verify the importance of the features. For this reason, as suggested in literature [92], [93] we complement our feature importance analysis by adopting the Scott-Knott Effect Size Difference (ESD) test [94], which allows us to verify the statistical ranking of the model features with respect to their contribution. This test represents an effect-size aware variant of the original Scott-Knott test [95] that (i) uses hierarchical cluster analysis to partition the set of treatment means into statistically distinct groups according to their influence in the RANDOMFOREST classification, (ii) corrects the non-normal distribution of an input dataset, and (iii) merges any two statistically distinct groups that have a negligible effect size into one group to avoid the generation of trivial groups. To measure the effect size, the tests uses the Cliff’s Delta [70]. In this work, we employed theScottKnottESDimplementation6 provided by Tantithamthavornet al.[94].
6.2 RQ2-RQ3 Results: Evaluating the Capabilities of a
Test-Case Effectiveness Estimation Model
Table 3 shows the performance of the RANDOM FOREST classifier for the seven considered evaluation metrics. As explained in Section 6.1.2, we build two test-case effective-ness estimation models: one containing all the factors (row dynamicin the table), one excluding the statement coverage
(row static), i.e., the only dynamic metrics requiring the execution of the code.
As shown, the model exploiting both coverage and static metrics has extremely strong performance, not only considering the F-Measure (95%) but also when analyzing AUC-ROC, MAE and Brier Score for which we observe values reaching 95%, 0.053 and 0.037, respectively. These results clearly suggest that Machine Learning methods can be effectively adopted to assess test-case effectiveness.It is worth to note that we select projects coming from different domains; therefore, we are confident that our estimation model might be generally usable in different contexts.
To better understand the features allowing the model to be so performing, Figure 3 depicts a bar plot showing the most 20 relevant features used by the model together with the information about their Gini index. To show the dominant contribution of the statement coverage, we plot two bars, one for the statement coverage only, and one that stacks the remaining 19 factors. Indeed, statement coverage is the feature providing the major contribution (Gini index=0.7). On the one hand, this result confirms the observations made inRQ1, where we found this measure to
be the main characteristic discriminating effectiveand non-effective tests. On the other hand, we can confirm again previous findings that reported on the usefulness of state-ment coverage in the context of mutation testing [16], [17]. The second most important feature is represented by the presence ofAssertion Rouletteinstances, while other features mainly used by the estimation model to classifyeffectiveand non-effectivetests regard both production and test code met-rics. In particular, our results show that cohesion, coupling, and complexity of both production and test-source-code are three important aspects that developers should take into account to ensure a high effectiveness of test cases.
Our findings are generally in line with those ofRQ1,
con-firming that source code quality indicators can be exploited to discriminate the effectiveness of tests. Nevertheless, we notice some mismatches between the specific features as-sessed in RQ1 and RQ3. These are basically due to test
and code smells. While inRQ1 theEager Testfeature had a
statistically significant relation with test code effectiveness, inRQ3 the smells considered by RANDOMFORESTare
As-sertion RouletteandMystery Guest. The likely reason behind this mismatch is the interaction that occurs between the features: indeed, as shown by Tufanoet al.[34], the presence ofAssertion RouletteandMystery Guestinstances induce the co-presence of anEager Testinstance, whileAssertion Roulette andMystery Guest provide two orthogonal information on the quality of tests. Thus, the proposed model exploits only two of the three features when predicting the effectiveness of tests. Similarly, the absence of code smells from the set of relevant features adopted by the RANDOMFOREST can be explained by the relations that such smells have with the other production code metrics considered. As an example, theMessage Chainssmell—that had a statistically significant relation with test code effectiveness in RQ1—indicates the
existence of a long chain of external calls performed by a production method. This smell is naturally related to complexity metrics like the Halstead or readability ones [14]; since our explanatory model considers the metrics altogether, the contribution given by the smell is limited by
TABLE 3
Performance of the RFC on nested cross-validation. We report accuracy (Acc.), precision (Prec.), recall (Rec.), F1 Score (F1), AUC-ROC (AUC), Mean Absolute Error (MAE) and Brier Score (Brier)
ACC. PREC. REC. F1 AUC MAE BRIER Dynamic 0.948 0.940 0.960 0.949 0.949 0.051 0.035 Static 0.864 0.864 0.865 0.864 0.864 0.137 0.095
the co-presence of other complexity metrics.
The discussion on the most relevant variables done so far is also supported by statistical analysis. Indeed, we observe that statement coverage consistently appeared in the top Scott-Knott ESD rank (which was computed on the basis of the Gini index values), followed by the other metrics in the same order as discussed above: for the top 20 factors, the test builds 10 distinct groups, where the group 1, i.e., the most influent, contains the statement coverage only. We report the script and the raw data needed to replicate such a statistical test in our replication package [18].
While the analysis of the dynamic model reports that statement coverage represents a key indicator for predicting test-case effectiveness, we also investigate whether its com-putation is actually needed to obtain good prediction perfor-mance. Looking at the results achieved by thestaticmodel, we can claim thatthe exclusion of statement coverage does not drastically decrease the prediction capabilities of the devised model. More specifically, both F-Measure and AUC-ROC reach 86%, being therefore≈8% less accurate than the model including the statement coverage, yet still highly performing. This is confirmed by both MAE and Brier coefficients (0.14 and 0.10), that indicates how (i) the prediction error done by the model is pretty limited and (ii) the accuracy of the predictions is high. It is important to point out that the lower performance of thestaticmodel is expected given the importance of code coverage for mutation testing. However, in our opinion the results achieved by this model are much more important than those of thedynamicone from a prac-tical perspective. Indeed, they highlight thatdevelopers can accurately estimate the effectiveness of test cases without actually executing them.
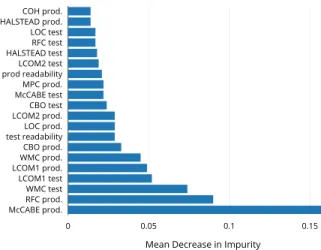
Figure 4 shows the most relevant features for the static model. We observe that it exploits test and code metrics in a more balanced way with respect to the dynamic, i.e., there is no feature having a much higher Gini index with respect to the others. In other words, the model has more difficulties in classifying the effectiveness of test cases be-cause of the lack of a strong information like the statement coverage: for this reason it weights features differently in order to gather sufficient knowledge to correctly perform a prediction. This is especially true for the weights assigned by the model to production code attributes: indeed, while in thedynamic model the four most relevant variables are all related to test-related characteristics, the static one mainly relies on production code complexity factors such the as McCabe and RFC metrics. This means that a fully static model requires different information to balance the lack of statement coverage, yet having high performance.
More in general, 11 of the top 20 features are related to production code size, cohesion, coupling, and complexity. At the same time, it is interesting to observe how also
test-0 0.2 0.4 0.6 stmt cov. others RFC test WMC prod. WMC test COH prod. HALSTEAD test BUSWEIMER test LCOM1 prod. LCOM2 prod. LOC prod. prod readability HALSTEAD prod. RFC prod. CONNECT. test test readability NOPA prod. McCABE prod. MysteryGuest CBO test Mean Decrease in Impurity
Fig. 3. Feature importance for the Random Forest Classifier with the statement coverage
code quality comes into play: 9 test-related metrics involv-ing cohesion, couplinvolv-ing, and complexity of tests are still in the top 20 factors according to their Gini index. The results are all statistically significant, and the ranking provided by the Scott-Knott ESD test (reported in our replication package [18]) reflects the most important features discussed so far: indeed, the same top 20 factors are all reported in the first 10 groups created by the test.
To better understand the static model performance as compared to the coverage-including one, the first two au-thors of the paper manually analyzeall the wrong predic-tions given by the two models. By relying on (i) the source code of the misclassified tests and (ii) a document reporting the metrics computed on each of them, they perform a code review of the tests aimed at understanding which charac-teristics may have led to a misclassification. The process is conducted in two joint meetings of eight hours each: this allows the two inspectors to discuss together about the possible reasons behind the errors done by thestaticmodel with respect to thedynamicone. As a result, we first observe that the number of misclassified tests is balanced between the two models considering both false negatives (FN), i.e., tests wrongly predicted as non-effective, and false positive (FP), i.e., tests wrongly predicted as effective: we have 84 versus 82 FPs and 32 versus 22 FNs for thestaticanddynamic models, respectively.
Considering the FN cases of thestaticmodel, we observe that in 94% of the cases these predictions are biased by fac-tors that characterize non-effectivetests. For instance, these tests have high values for production-code complexity-metrics (e.g., RFC) and, at the same time, low values for test-code cohesion ones (e.g., LCOM metrics): fromRQ1we
see that this is the case for non-effective tests. Similarly, the CUTs have high values for complexity metrics, while the same is not true for the correspondent test code. On the contrary, statement coverage is high in 90% of those cases: while thestaticmodel misclassifies them, thedynamicmodel is instead able to give correct predictions. Also for false positive tests, thestaticmodel misclassifies the ones having metric values that characterize effective tests. Indeed, we observe that 88% of these tests (i) are not smelly, (ii) have a pretty high complexity and coupling values, while the
0 0.05 0.1 0.15
McCABE prod.RFC prod. WMC test LCOM1 test LCOM1 prod.WMC prod. CBO prod. test readabilityLOC prod. LCOM2 prod.CBO test McCABE testMPC prod. prod readabilityLCOM2 test HALSTEAD testRFC test LOC test HALSTEAD prod.COH prod.
Mean Decrease in Impurity
Fig. 4. Feature importance for the Random Forest Classifier without the statement coverage
corresponding production code has low complexity, and (iii) the cohesion and coupling metrics for the production code are counterbalanced by similar values in the tests. In these cases, thestaticmodel misclassifies the tests independently from their level of coverage; on the contrary, the dynamic model misclassifies only those tests having a very high coverage. While this qualitative analysis identifies some limitations of thestatic model, it is important to point out that the number of misclassified cases remains limited, thus indicating once again the high ability of source-code-quality indicators to distinguisheffectivefromnon-effectivetests.
In Summary. Estimation models can be effectively ex-ploited to classify test-case effectiveness. A model relying on both dynamic and static information achieves perfor-mance close to 95% in terms of F-Measure and AUC-ROC, while the performance of a model only using static indicators decreases of≈9%, yet being highly performing and a more practical solution in a real-case scenario.
7
D
ISCUSSIONThe key result of our study points out the role of source code quality with respect to the effectiveness of test cases. While the results reported so far already demonstrate the accuracy of our automated technique, in this section we further discuss our findings, especially in relation to the motivations behind the achieved results and how the proposed model can be used by practitioners in a real-case scenario.
7.1 Why Source-Code Metrics can Estimate the Test-Effectiveness
The foremost finding of our analysis is concerned with the high ability of static source-code metrics in predicting test-code effectiveness. On the one hand, this is surprising since none of the considered source-code metrics explicitly take into account the specific instruction types where a mutation can be injected (e.g., in if-statements). On the other hand, most of the considered factors have a relation with the degree of source-code complexity (that directly impacts, for instance, the number and quality ofif-statements) as well as other properties of production/test code that