the Primary Visual Cortex
Danko Nikolic´1,2.*, Stefan Ha¨usler3., Wolf Singer1,2, Wolfgang Maass2,3
1Department of Neurophysiology, Max-Planck-Institute for Brain Research, Frankfurt, Germany,2Frankfurt Institute for Advanced Studies (FIAS), Johann Wolfgang Goethe University, Frankfurt, Germany,3Institute for Theoretical Computer Science, Graz University of Technology, Graz, Austria
Abstract
It is currently not known how distributed neuronal responses in early visual areas carry stimulus-related information. We made multielectrode recordings from cat primary visual cortex and applied methods from machine learning in order to analyze the temporal evolution of stimulus-related information in the spiking activity of large ensembles of around 100 neurons. We used sequences of up to three different visual stimuli (letters of the alphabet) presented for 100 ms and with intervals of 100 ms or larger. Most of the information about visual stimuli extractable by sophisticated methods of machine learning, i.e., support vector machines with nonlinear kernel functions, was also extractable by simple linear classification such as can be achieved by individual neurons. New stimuli did not erase information about previous stimuli. The responses to the most recent stimulus contained about equal amounts of information about both this and the preceding stimulus. This information was encoded both in the discharge rates (response amplitudes) of the ensemble of neurons and, when using short time constants for integration (e.g., 20 ms), in the precise timing of individual spikes (#,20 ms), and persisted for several 100 ms beyond the offset of stimuli. The results indicate that the network from which we recorded is endowed with fading memory and is capable of performing online computations utilizing information about temporally sequential stimuli. This result challenges models assuming frame-by-frame analyses of sequential inputs.
Citation:Nikolic´ D, Ha¨usler S, Singer W, Maass W (2009) Distributed Fading Memory for Stimulus Properties in the Primary Visual Cortex. PLoS Biol 7(12): e1000260. doi:10.1371/journal.pbio.1000260
Academic Editor:Jonathan D. Victor, Weill Cornell Medical College, United States of America ReceivedJune 22, 2009;AcceptedNovember 10, 2009;PublishedDecember 22, 2009
Copyright:!2009 Nikolic et al. This is an open-access article distributed under the terms of the Creative Commons Attribution License, which permits unrestricted use, distribution, and reproduction in any medium, provided the original author and source are credited.
Funding:This work was supported by a grant from Deutsche Forschungsgemeinschaft (NI 708/2-1), by the German Federal Ministry of Education and Research (BMBF) within the ‘‘Bernstein Focus: Neurotechnology’’, through research grant 01GQ0840, Alexander von Humboldt Stiftung, and Hertie Stiftung. Additional partial support was obtained also from the Austrian Science Fund FWF#S9102-N13 and project#FP6-015879 (FACETS), project#FP7-216593 (SECO), and project#FP7-506778 (PASCAL2) of the European Union. The funders had no role in study design, data collection and analysis, decision to publish, or preparation of the manuscript.
Competing Interests:The authors have declared that no competing interests exist.
Abbreviations:AUC, area under receiver-operating characteristics; I&F, integrate-and-fire; ISI, interspike interval; IT, inferotemporal; Mfr, mean firing rate; PSTH, peristimulus time histogram; RBF, radial basis function; RF, receptive field; SD, standard deviation; SVM, support vector machine; XOR, exclusive OR * E-mail: [email protected]
.These authors contributed equally to this work.
Introduction
A number of analysis methods have been designed to investigate how neuronal spiking activity correlates to sensory stimulation or behavior and, as expected, many relations have been found. All of the following variables—firing rates [1–4] and the synchronization [4–7] and the differential timing of spiking activity [8–10]—have been reported to correlate, one way or another, with stimuli and/ or with behavior. Most of the efforts to distinguish between relevant and epiphenomenal variables face the problem that they have to rely on correlative rather than causal evidence. In the absence of direct access to the information of causal nature, one way to begin addressing this issue is to complement the highly specialized statistical methods that have been developed to detect specific stimulus-related changes in responses [9,11–18] with analyses that make minimal assumptions about putative codes [19–21], and examine how much information can be extracted by a single cortical neuron from the joint responses of its presynaptic neurons and then find out which variables were carrying the relevant information [22,23]. To adjust to the conditions under which these cortical ‘‘readout’’ neurons are likely to operate, the
data must be presented to the readout units in parallel, i.e., the responses of the putative feeding neurons must be recorded simultaneously. Also, analysis and classification of data should correspond to that conducted in real time. Thus, the results should be available with short delays. Hence, the analysis method should be allowed no more time for accumulating evidence than is available for cortical neurons to accomplish their task. To fulfill these requirements, readout neurons need to be simulated on a computer and fed with data obtained in parallel recordings from a large number of cortical neurons, the assumption being that a certain fraction of these neurons provides input to neuronal classification.
The present study was designed to fulfill these premises. Applying multielectrode technology, we recorded simultaneously from a large number of neurons in area 17 of lightly anesthetized cats and evoked responses with brief sequences of different, stationary flashed stimuli (letters of the alphabet). These responses were then fed as inputs to artificial readout neurons simulated on a computer (also referred to as classifiers). We first trained the artificial neurons to classify the visual stimuli that have generated the responses, and once the classification had reached criterion, we
investigated which of the information-carrying variables were used by these artificial—but neuron-inspired—readout systems. A recent study provided evidence that an artificial readout system can extract stimulus-specific information from the spiking activity of neurons that were sequentially recorded from macaque inferotemporal (IT) cortex [23]. However, in this study, responses of different neurons that were supplied in parallel to the readout system had been obtained by recording sequentially from the different cells. This approach eliminates temporal relations between neuronal responses that are not time locked to the stimulus, but established by internal interactions (referred to also as ‘‘noise correlation’’ [24]). Thus, it was not possible to determine whether stimulus-specific information is encoded by internal adjustment of spike timing, as this information cannot be retrieved unless responses are recorded simultaneously.
In addition to the identification of response variables containing stimulus-specific information, we were particularly interested in determining the duration over which this information was retrievable after the stimuli have disappeared. In case there was evidence for ‘‘fading memory’’ already in primary visual cortex, the data would allow for inferences on the mechanisms underlying perceptual phenomena such as visual persistence and iconic storage [25–29]. Moreover, the lack of evidence for fading memory would provide an important constraint for hypotheses on processing modes implemented in primary visual cortex. Computer simulations of sparsely connected recurrent circuits of neuron-like processing units [30–33] as well as theoretical analyses of related circuits with simpler (linear) processing units [34,35] have shown that systems with fading memory exhibit powerful computational capabilities because they permit integration of stimulus information over time. Negative evidence of fading memory would render such models unlikely and support more classical views that emphasize sequential step-by-step processing of single frames resulting from a pipelined organization of the circuits [36,37].
In order to distinguish between processing with or without fading memory, we presented sequences of different stimuli and investigated whether information about preceding stimuli was
erased by the presentation of subsequent stimuli or whether it persisted. The latter case would provide strong evidence for the existence of fading memory, whereas the former would be supportive of models favoring frame-by-frame analysis of succes-sive stimuli.
Results Methods
We used silicon-based multielectrodes (Michigan probes, see Materials and Methods) to obtain highly parallel recordings from up to 124 randomly selected neurons in the primary visual cortex (area 17) of lightly anesthetized cats. These neurons, most of which had overlapping receptive fields (RFs), were activated by presenting stationary flashed (100 ms) uppercase letters (A, B, C, D, and E). The letters were always shown with maximal contrast and were either presented singly, one per trial, or in a sequence of two or three (e.g., ABC; and a 100-ms blank interval between letters in most experiments) (see Table S1 for experiments made on each cat). The times at which letters were presented are indicated in all graphs by gray rectangles. Each stimulation condition was presented 50 to 300 times in a randomized order.
To emulate classification processes realized with leaky integrate-and-fire (I&F) readout neurons (but without reset or a refractory period), the time stamps of discharge sequences were first convolved with an exponentially decaying kernel (if not specified otherwise, time constant, t= 20 ms) that mimicked the time course of excitatory postsynaptic potentials (EPSPs) [38,39] (see Materials and Methods). The continuous convolved signal was fed to the classifier system, as illustrated in Figure 1C. If not specified otherwise, the classification was made by a single I&F readout whose activation, at a time point,t, was computed as the weighted sum of the input signals at that time. The classifier ‘‘fired’’ (i.e., detected the stimulus) if its activation crossed a threshold. The optimal weights and the firing thresholds of the classifiers were found (learned) by applying support vector machines (SVM) with linear kernels. All reported results were obtained from test datasets derived from trials that were not part of the training datasets, only the latter being used to adjust the input weights for the readout neurons (see Materials and Methods for a 10-fold cross-validation scheme). In a few additional analyses (reported later in ‘‘Superposition of Information about Different Stimuli’’), we used also SVMs with polynomial and radial basis function kernels to investigate whether classification performance improved with these more sophisticated, nonlinear transformations of the input variables. If not specified otherwise, the results are reported for classifiers trained only on a single instance in time,t, which were the values of the continuous signal resulting from the convolution of the spike trains by the exponential kernel (Figure 1C). The total number of values used to train each classifier depended on the number of trials (see Table S2). Thus, for most analyses, different classifiers were trained for each time point along the trial, each classifier having its own unique set of weights. These classifiers are denoted as Rt and should be
distinguished fromRintclassifiers, which were trained to generalize
by using only one set of weights to classify neuronal responses over longer periods of time (e.g., 100-ms or 300-ms long). In general,Rt
classifiers have better performance thanRintclassifiers because a
single Rint classifier uses only one set of weights to accomplish
a number of different classification tasks, each taking place at a different time point. A corresponding collection of Rt classifiers
approaches this problem by sharing the workload—each classifier having its own set of weights optimized for the unique properties of the responses at that time point,t. Consequently, the recent history affecting the activity at time t imposes fewer constraints on the Author Summary
Researchers usually assume that neuronal responses carry primarily information about the stimulus that evoked these responses. We show here that, when multiple images are shown in a fast sequence, the response to an image contains as much information about the preceding image as about the current one. Importantly, this memory capacity extends only to the most recent stimulus in the sequence. The effect can be explained only partly by adaptation of neuronal responses. These discoveries were made with the help of novel methods for analyzing high-dimensional data obtained by recording the responses of many neurons (e.g., 100) in parallel. The methods enabled us to study the information contents of neural activity as accessible to neurons in the cortex, i.e., by collecting information only over short time intervals. This one-back memory has properties similar to the iconic storage of visual informa-tion—which is a detailed image of the visual scene that stays for a short while (,1 s) when we close our eyes. Thus, one-back memory may be the neural foundation of iconic memory. Our results are consistent with recent detailed computer simulations of local cortical networks of neurons (‘‘generic cortical microcircuits’’), which suggested that integration of information over time is a fundamental computational operation of these networks.
Rt than on the Rint classifier, the latter having to accommodate
variability of response properties over an entire time interval. All classifications were made as binary choices among two stimuli (such as A and D), the chance level for correct classification being 50%. In
all graphs, the classification performance ofRt (Rint) readouts is
shown as percentage correct classifications of the presented stimulus (see Materials and Methods for more details on experimental and analysis procedures).
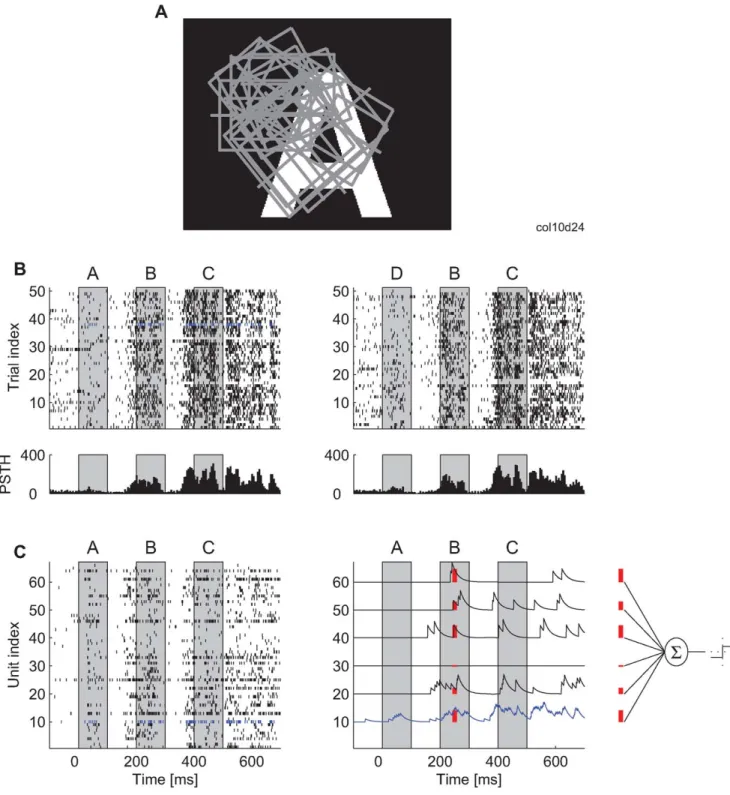
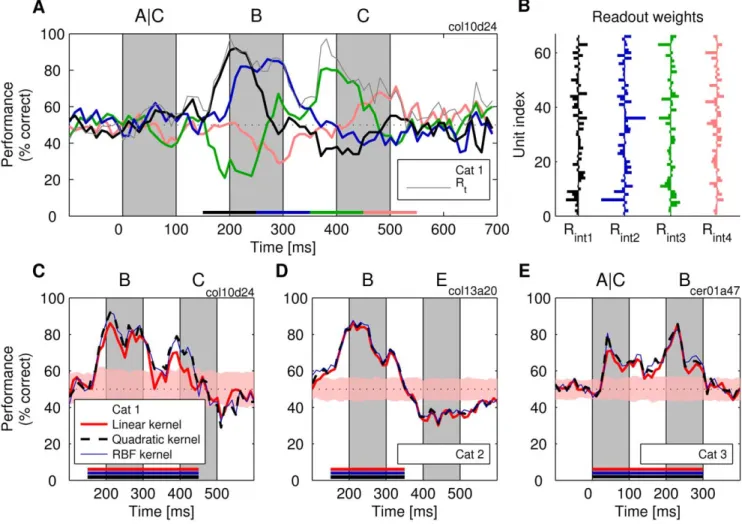
Figure 1. Experimental setup and illustration of the analysis method.(A) An example of a visual stimulus in relation to the constellation of receptive fields (rectangles) from one Michigan probe. (B) Upper part: spike times recorded from one neuron across 50 stimulus presentations and for two stimulus sequences (ABC and DBC). In this and in all other figures, the gray boxes indicate the periods during which the letter stimuli were visible on the screen. Lower part: peristimulus time histogram (PSTH) for the responses of this neuron (5-ms bin size). (C) Left: spike trains obtained simultaneously from 66 neurons in one stimulation trial. Blue: the neuron for which all 50 trials are shown in (B). Right: for the classification analysis, each spike train is convolved with an exponential kernel (i.e., low-pass filtered). The spike trains for only six example neurons are shown. Red: example values of the convolved trace that are used as inputs to the classifier (far right).
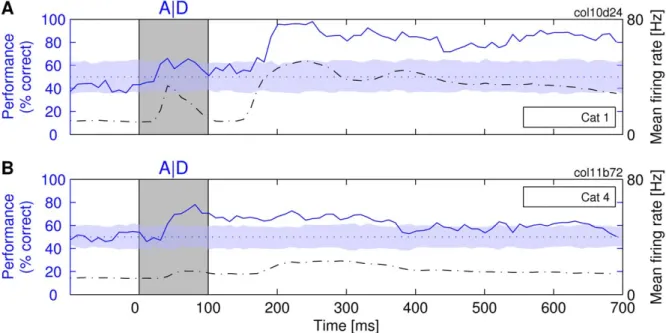
High-Classification Performance and Fading Memory High-classification performance. Figure 2 shows an example for the classification performance when a single letter is presented at a time. The classifiers achieved near perfect performance in some experiments (in Figure 2A, close to 100% correct at t=,200–250 ms), in others, the performance stayed reliably above chance level (Figure 2B). This high-classification performance was achieved despite the high trial-to-trial variability of the responses (see Materials and Methods). The main factor influencing performance was the total number of spikes available for the analysis. Classification was almost always better for datasets with larger numbers of spikes. The classification shown in Figure 2A was based on an average of 1,729 spikes per second (62 units recorded simultaneously), whereas the classification in Figure 2B had to be performed with only 874 spikes per second (49 units) (see Text S1 for more details on predictors of overall classification performance).
This dependence of classification performance on spike counts also held for stimulus-specific changes in firing rate. High rate responses were associated with better classification performance than weak responses. For the cases shown in Figure 2, best classification performance was achieved at the times at which the mean firing rates (Mfrs) had also the highest values. This relationship is most clearly seen in Figure 2A, where the Mfr shows a strong biphasic modulation in response to the on- and offset of the stimulus. The initial increase in discharge rate at
,50 ms is associated with an increase in classification perfor-mance, and the second, much larger increase in Mfr that peaks at about 200–250 ms is associated with the highest level of classification performance (approaching 100%). This correlation between classification performance and Mfr is clearly expressed by a positive value of Pearson’s coefficient of correlation (r= 0.91) between Mfr and classification. Here, one needs to consider that
cortical neurons respond with latencies of 30–60 ms to light stimuli [40]. Therefore, the stimulus-induced changes in Mfrs and the corresponding changes of the classification performance are always delayed relative to the stimuli (which are indicated by gray rectangles in the figures).
In Figure 2B, the biphasic changes in rate responses are much less pronounced than in Figure 2A. Consequently, the changes in classification performance are also less pronounced, the correla-tion between classificacorrela-tion and Mfr remaining positive (r= 0.63). The overall correlation for all investigated responses was 0.65. Similar results were obtained for theRintclassifiers (see Figure S1).
Long-lasting persistence of information. A remarkable finding was that information about stimulus identity did not disappear quickly after the removal of the stimulus but was often available for an extended period of time. In some cases, the performance stayed above chance level for the entire duration of our trials for which we initially recorded neuronal responses (i.e., 700 ms after stimulus onset for the experiment shown in Figure 2A). The results from the experiment summarized in Figure 2B are similar. Although the classification performance dropped considerably at about 400 ms in this experiment, the performance nevertheless stayed above chance level for a large part of the remaining duration of the trial. Therefore, the information about the nature of stimuli appears to be available as long as the neuronal firing rates stay elevated. Similar long-lasting off-responses in area 17 and under anesthesia have been reported previously ([41], pp. 108–109, 116). These results indicate clearly that the information about stimuli persists long beyond the disappearance of the stimuli, which allows us to investigate the interactions with new stimuli presented after the offset of the first stimulus.
To investigate whether these long-lasting responses were en-trained (learned) during the stimulation procedure, we compared the
Figure 2. The ability of a linear classifier to determine the identity of the presented letters, A or D.The classification performance is shown (solid line) as a function of time passed from the presentation of the stimulus (at 0 ms) until the moment at which a sample of neuronal activity was taken for training/testing theRtclassifier (the stimulus was removed at 100 ms). Dash-dotted line: the mean firing rate across the entire
population of investigated neurons. Dotted line: expected performance at chance level (50% correct). The shaded horizontal stripe around the dotted line covers the region of statistically nonsignificant deviations from the chance level (p.0.05), estimated by a label-shuffling test. In this and all other figures, the color of the stripe matches the color of the performance curve for which the statistical test was performed. (A and B) Two different experiments on different cats.
peristimulus time histograms (PSTHs) to the sequences of flashed letters early in the stimulation protocol (e.g., first 10 or 50 trials) with those occurring late (e.g., last 10 or 50 trials). The Mfrs were similar across all subsets of trials and always at least two times larger than spontaneous activity, even 700 ms after stimulus onset (in the case of cat 4, only 300 ms after stimulus onset), indicating that there was no entrainment of these long-lasting responses. Moreover, the duration of the elevated Mfrs in the off-responses were not specific to flashed stimuli, as we observed a similar duration also for off-responses to classical sinusoidal grating stimuli (Figure S2).
Sequences of Stimuli
Responses to a second letter in a sequence. In most of our experiments, we presented not one but a series of three letters. This made it possible to investigate whether new stimuli erase the information about the preceding ones—akin to the masking effect in iconic memory [26,27,29,42]—or alternatively, whether the information about the new stimuli can coexist with and is superimposed on the information about the preceding stimuli.
In all experiments, the classifiers could retrieve the information about the first stimulus in the sequence, not only in the on- or off-responses to that stimulus (i.e., up to 200 ms after its onset), but also in the responses to a later stimulus in the sequence (i.e., from
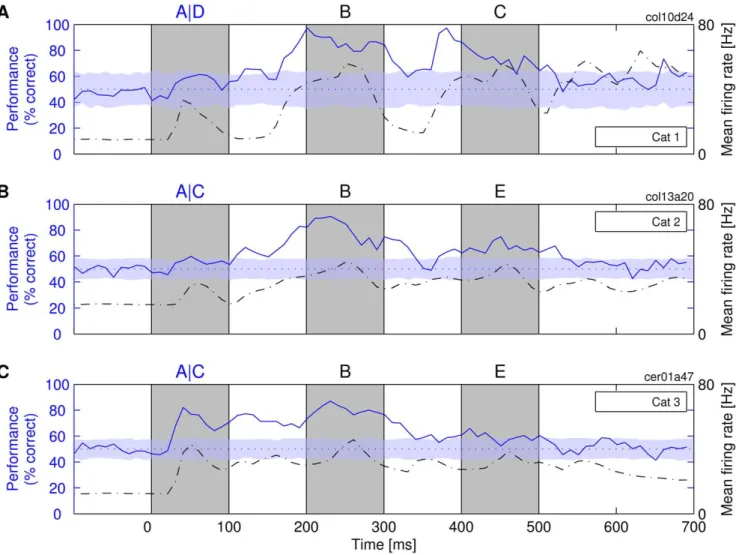
,250 ms onward). In some cases, even classification based on the off-responses to the second stimulus approached 100% accuracy for the identification of the first stimulus (Figure 3A, at,380 ms). See Figure 4D for classification performance over all experiments made. Thus, when a novel letter was presented, the information about the previously presented letter was not erased but was still present in the responses to the novel stimulus and could be extracted reliably by a linear I&F classifier. This suggests that the second letter in a sequence produces none or only weak masking effects on the information about the first letter.
As with the presentation of single letters, there was again a strong positive correlation between classification performance and Mfr. For the case exemplified in Figure 3A–3C,r-values were 0.45, 0.68, and 0.66, respectively (explained variance: 20%–46%; analysis window: 800 ms). Thus, the best classification perfor-mance coincided with maximal Mfr. Importantly, however, in the present analysis, the elevated Mfr was evoked, not by the stimulus that was classified, but by another stimulus that was presented later. This suggests that elevated firing rates (i.e., the total spike count) are more important for the readout than the identity of the stimulus that has caused the elevated rates or than the time elapsed since the presentation of the target stimulus. In a control experi-ment, we could show that the first letter could be classified well
Figure 3. Availability of information about a stimulus presented as a part of a sequence.ClassifiersRtwere trained to identify the first
letter in the sequences, i.e., ABC versus DBC in one experiment (cat 1) and ABE versus CBE in the other two experiments (cats 2 and 3). (A–C) Three different experiments on different cats. Notations are the same as described in Figure 2.
even if, as the second stimulus, we presented a blank white screen instead of a letter (Figure S3). Thus, it did not matter whether the Mfr was increased by a structured or by an unstructured stimulus. The role of various factors for coding information in these elevated Mfrs, such as rate responses over longer periods of time (e.g., 100 ms) and temporal structure of action potentials on a shorter time scale (e.g.,#,20 ms), is investigated explicitly in ‘‘Analyses of Information-Carrying Variables.’’
Suppressive role of the second stimulus. A comparison between responses to one- and three-letter stimuli (i.e., Figures 2
and 3; for a direct comparison, see Figure S4) suggested that the second stimulus had strong suppressive effects on the off-responses to the first stimulus. This was confirmed by a control experiment in which we manipulated systematically the interval between the first and second stimulus (see Figure S3), where the second stimulus interacted with the dynamics of the off-responses to the first stimulus: The on-response to the second stimulus did not simply sum up with the off-response to the first stimulus. Instead, when presented in temporal proximity (e.g., interspike interval [ISI] = 100–300 ms), the second stimulus clearly produced a Figure 4. Simultaneous availability of information about multiple stimuli in a sequence.(A) Performance of time-specialized classifiersRt
trained on individual time points to identify the second letter in the sequences of three letters (i.e., ABC vs. ADC). The results should be compared to Figure 3A. (B and C) Simultaneous availability of information about two different letters of a sequence. The following four sequences were presented: ABE, CBE, ADE, and CDE, and two classifiers identified each the presentation of either the first (blue line) or the second letter (green line). Shaded stripe and dotted lines are as described in Figure 2. (D and E)Rtclassification performance for 16 different recordings made across four cats. Due to
the sparseness of responses, the results are given as average classification performance within 100-ms windows. Thick black curve: gross average across all datasets. Vertical lines: standard error of the mean across all datasets of all cats. Asterisk: the datasets chosen for further analysis. doi:10.1371/journal.pbio.1000260.g004
suppressive effect on the otherwise strong and sustained off-responses to the first stimulus (i.e., with ISI = 500 ms). Likewise, the properties of the preceding stimulus affected the on-responses to the second stimulus, an effect that was obviously sufficiently specific to classify accurately the first stimulus. Interestingly, we found only very limited evidence that this one-back memory mechanism occurs due to the adaptation of neuronal responses (see Figure S5). Also, the control experiment in Figure S3 was designed to avoid repetitive presentation of stimuli with a single ISI, unlike the other experiments. Thus, this experiment provides additional evidence that the long-lasting off-responses cannot be explained by an entrainment (learning) process that would develop expectancies for a specific ISI (i.e., the rhythm of stimulation).
Responses to a third letter in a sequence. The responses to the third stimulus in the sequence (C or E in Figure 3; from
,450 ms onward) contained much less information about the first stimulus than the responses to the second stimulus. This did not appear to be due to a simple decay of information over time. In one experiment, we were able to compare directly the responses of the same neurons to a single stimulus and to triplets of stimuli (cat 1 in Figures 2A and 3A; direct comparison in Figure S4). With a single stimulus, classification performance was still high at delays as long as 450 ms, but had dropped to chance level at the same time point when sequences of three stimuli were presented. Similar results were obtained in other experiments (Figure 3B and 3C). In contrast to the presentation of one or two letters, information about the first letter was always considerably reduced when a third letter was presented. Also, in the experiment with varying interstimulus interval in Figure S3, the on-responses to the distant second stimulus (300 ms) contained much more information about the first stimulus than any other on-responses to equally distant third stimuli in Figure 3. Furthermore, the reduction in classification performance in third stimulus responses was not due to a reduction of Mfrs. This indicates that the third stimulus in the sequence actually acted as a mask and erased the information about the identity of the first stimulus. Thus, the system has nearly unimpaired memory for one-back but not for two-back stimuli.
Another remarkable finding was that off-responses often returned temporarily to the level of spontaneous activity before again assuming high levels of Mfr (e.g., 100–150 ms and,350 ms in Figure 3A; see also Figure S3). This rebound was strongest if the screen was left blank, and hence, no suppression was induced by the presentation of subsequent stimuli. Therefore, the changes in the system responsible for the memory effect have persisted across intervals during which the activity of the neurons used for classification was low and carried little or no information about the stimulus.
Superposition of Information about Different Stimuli Responses that carry the information about past stimuli should also carry information about the most recent stimuli, i.e., about those that evoked the responses. The results of the following analyses indicate that this is the case. In Figure 4A, a readout is fed with inputs from the same set of neurons as in Figure 3A (and in Figure 2A), but this time, the readout is trained to classify the second stimulus in the sequence of three letters (letter B vs. D). The classification performance was high (,80%) despite the high degree of similarity of the shapes. Consistent with our previous findings, classification performance correlated positively with Mfr (r= 0.39 for the entire period of 800 ms).
In Figure 4B and 4C, we show results for cats 2 and 3 in which both the first and second letter in the sequence were varied at the same time, allowing us to estimate whether information was available to classify simultaneously both the first and the second
stimulus in the sequence. We found that such sequence-specific information was available in the on- and off-responses to the second stimulus. During this period, the classification performance for the first stimulus was not lower than the performance for the recent stimulus that evoked the response (e.g., around 70% correct in both cases for cat 3). We could also show that readouts could be trained to perform nonlinear exclusive OR (XOR) classification, i.e., fire if either a sequence AB_ or CD_ was presented, but not if sequences AD_ or CB_ were presented (for details, see ‘‘Nonlinear superposition of information’’ in Text S1).
In Figure 4D and 4E, we show that these findings generalized across all the cats and, as a rule, also across different recordings made from the same cat. For the classification of the first letter, the gross average maximum performance across the total of all 16 recordings peaked at,80% correct during the presentation of the second letter (Figure 4D), and similarly, the classification of the second letter peaked at,75% correct during the presentation of the third letter (Figure 4E). In Figure 4D and 4E, one can also see one more remarkable result: classification performance is typically better for off- than for on-responses (e.g., in Figure 4D, the performance is overall higher at 250 ms than at 150 ms). This result can also be seen in Figures 2A, 3A, and 3B (i.e., for cats 1 and 2). The results indicate that successful stimulus classification is a ubiquitous phenomenon and that off-responses contain substan-tial information about the stimuli even when interacting with on-responses to stimuli presented next in the sequence.
Analyses of Information-Carrying Variables
The information extracted by the classifier could be encoded either by slow changes in firing rates (slow-rate code; e.g.,
,100 ms) or by precise timing of neuronal spiking events (i.e., fine temporal code; e.g., #,20 ms) or both. Our next step was to investigate the contribution of information encoded at these two different time scales.
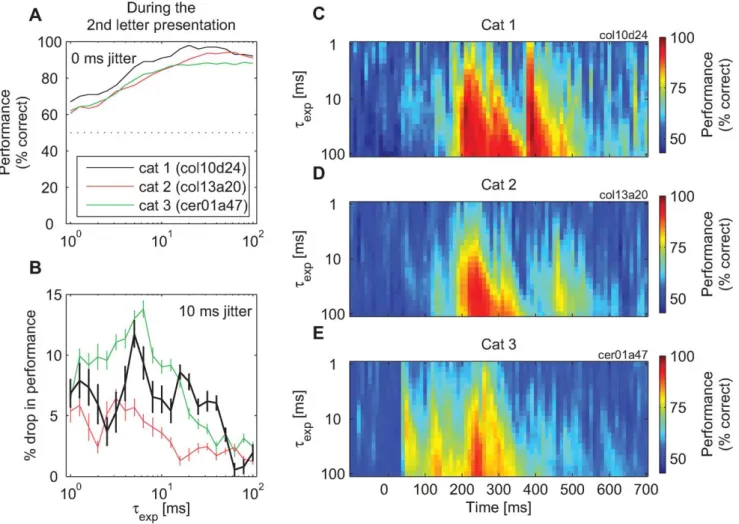
Information carried by spike timing. An analysis of classification performance withtvarying between 1 and 100 ms indicated that, at the points of peak performance, the classification witht= 20 ms was about as good as with any other larger value of t, although longer integration constants always led to equivalent or better performances (Figure 5A). At other time points, larger values oftwere required for maximum performance, but these values increased monotonically with the distance from the points of peak performance (the right-skew–shaped intensity plots in Figure 5C–5E). This suggested that an important role of longt’s was to reach sufficiently far into the past in order to ‘‘carry over’’ the responses from the time when they were most informative about the stimulus.
We next investigated the role of precise spike timing for achieving such high-classification performance witht= 20 ms. To this end, we perturbed the fine temporal structure of the spike trains. The times of action potentials were jittered by moving each spike by a random time drawn from a Gaussian distribution with the mean of zero and a prespecified standard deviation (SD) (x-axis in all plots in Figure 6; both training and test trials were jittered). We then investigated the ability of readouts to learn to classify the first letter in the sequence based on such jittered datasets (see Materials and Methods for details). Jitter had strong detrimental effects on classification performance as it reduced the performance in all analyses. In Figure 6A, changes in classification performance are shown as a function of the amount of jitter. For this purpose, we selected three time points that exhibited the highest classification performances prior to the application of the jitter and were thus most relevant for such analyses (see Figure S6 for analyses of all other time points and other values oft). Jitters with
standard deviations that were too low to affect slow-rate code still resulted in a considerable performance drop (e.g., jitter with SD = 10 ms typically resulted in a 5%–10% drop in the number of correct stimulus classifications). Often, perturbations of spike timing with SD of only a few milliseconds reduced the performance of the classifiers by a statistically significant amount (e.g., Figure 6A, during the presentation of the first and the second letter).
This detrimental effect of the jitter on the ability of the readouts to classify the stimuli was largely independent of the time in the trial at which the tests were made. The performance was reduced irrespectively of whether the classification was based on on- or on off-responses or whether it was made for the most recently presented stimulus or for the stimuli presented earlier (one-back memory). For jitter with a SD = 20 ms, the average peak performance dropped by 10.7% (see Figure 6A and 6B). Thus, the results indicate that the stimuli are classified most accurately on the basis of the original temporal structure of the responses. This suggests that readouts with short time constants rely less on the information contained in slow firing rates and more on the information about firing probabilities defined within short time windows. This, latter form of information coding can be described
as fast changes in firing rates or precise spike timing, and is reflected by narrow and high peaks in the PSTHs, examples of which can be seen in Figure S7 (first row).
The readout was always retrained on jittered data. Consequently, this procedure allows an assessment of the contribution of precise spike timing to classification performance. Hence, the observed drop in performance of,10%–15% is an estimate of the proportion of information available through precise timing only. As shown in Figure 5B (and Figure S6), this drop in performance also depends strongly on the choice of the time constant, and is the strongest with t=,5–10 ms. In Figure S8, we show that this is also the range in which jitter has the strongest detrimental effects on the differences in the means of the convolved spike trains across stimuli, and consequently, on the signal-to-noise ratio of the convolved spiking signals. Moreover, the smallest detrimental effects were found for cat 2, and this was also the cat with the smallest effect of jitter on the classification performance. In Figures S9, S10, and S15B, we show that increase in jitter SD has a limited impact, as jitter deteriorates the stimulus classification witht#,20 ms only in the original spike trains and not if the information about the precise timing of action potentials has been previously destroyed.
Figure 5. The change in classification performance forRtclassifiers as a function of the time constant,t.(A)tis changed systematically between 1 and 100 ms (both for training and testing). The performance reached its plateau at about 20 ms. (B) Detrimental effect of 10-ms jitter on the classification performance achieved with different values oft. As a rule, jitter caused a stronger drop in performance with small than with large values oft. However, this function was not monotonic, as the performance drop was strongest whenthad values of 5–10 ms. Vertical bars: standard error of the mean across jittered datasets. (C–E) A detailed analysis of the relation between the value chosen for the integration constant, t (1…100 ms) and the classification performance of Rt readouts. Changes in performance are shown for three cats. As a rule, classification
performance increases with longer integration constants. doi:10.1371/journal.pbio.1000260.g005
Performance was also analyzed with shuffled trials. Jitter analysis alone did not provide information on whether the fine temporal structure used by the readouts was time locked to the stimulus events (evoked temporal structure) or, alternatively, whether this structure resulted from internal interactions that were not time locked to the stimulus (inducedtemporal structure or
noise correlation). To distinguish between these alternatives, we randomly shuffled the order of training and test trials for each unit and then repeated the jitter analysis. As a result, the spike trains that readouts received simultaneously from the different input units were in fact not recorded simultaneously but in different, randomly selected trails, which made our analysis more similar to that of Hung et al. [23]. This manipulation preserved stimulus-related information because all the trials were recorded in response to the same stimulus, although the responses for each neuron came from a different trial. Such trial-shuffling procedures destroy the precise temporal structure of internally generated activity patterns (induced temporal structure) but preserve the temporal structure of patterns caused by stimulus locking (evoked temporal structure) [43,44]. Thus, shuffling is expected to cause a drop in performance if information is contained in the induced (internally generated) temporal organization of responses, and if jitter is applied in addition to shuffling, a further drop in performance would indicate
that further information is contained in the evoked (stimulus-locked) temporal structure of the responses.
Trial shuffling produced only occasionally a decrease in classifi-cation performance, and these changes were neither consistent across different experiments nor for different time-points along the trial. The time periods showing a significant drop in performance were of very short duration and differed between cat 1 and cat 3 (on average 0.8% and 2.0% drop in performance, respectively; all p-values.0.06, signed-rank test,n= 30) (see Figure S11). Sometimes, shuffling even increased the classification performance, perhaps by balancing the trial-to-trial variability in neuronal rate responses, which occurs in a highly correlated manner across neurons [24]. These results indicate that Rt classifiers relied only to a small degree on the timing
information contained in internally generated temporal patterns (induced temporal structure). Similar results were obtained when, instead of the trial shuffling, we randomly exchanged action potentials among the trials recorded in response to the same stimuli (Figures S12 and S13) while maintaining the same Fano factor for the spike counts as observed in the original data. When jitter was added to the shuffled trials, classification performance dropped consistently and by the same amount as when unshuffled trials were jittered (compare Figure 6B to Figure 6A). These results forRtreadouts indicate that
stimulus-specific information is contained in the precise timing of Figure 6. The performance of the classifiersRt(from Figure 3) as a function of Gaussian jitter applied to spike timing.(A) Change in classification performance as a function of the amount of jitter shown for the three points with the highest classification prior to the application of jitter. The results are shown for three different points in time exhibiting the strongest effects (cat 1: 60,120, and 200 ms; cat 3: 40, 120, and 230 ms). (B) The same analysis as in (A) but for spike trains shuffled across presentation trials (cat 1: 40, 130, and 220 ms; cat 3: 40, 120, and 250 ms). Vertical lines: standard error of the mean across all jittered and trial-shuffled datasets.
individual spikes and that the relevant temporal structure of the spike trains results from stimulus locking and not from internally generated temporal patterning that would be independent of the temporal structure of stimuli.
Generalized information contents across longer stretches of signals. In all the analyses presented so far, the weights of a linear classifier were trained—and the classification performance was tested—on convolved neuronal activity extracted from one specific time point,t. As a result, classifiers trained at different time points had different sets of ‘‘synaptic’’ weights, each set being optimized for stimulus classification at exactly one point in time. An analysis of the weight distributions revealed that these weights were highly dissimilar for different time points. The values of weights changed quickly along the trial and even flipped their signs as often as every 50–100 ms. Thus, the optimal set of weights for good stimulus identification differs substantially across different time points.
We also investigated the degree to which our readout systems could achieve good classification performance when trained on longer time intervals. Hence, readouts were trained on all time points within a time interval of either 100-ms or 300-ms duration, and their performance was tested on each time point,t. For both
training and test, the integration constant remained unchanged, i.e., t= 20 ms. These readouts were denoted asRintclassifiers or
time-invariant classifiers (to distinguish them from time-specialized,Rt,
classifiers). In Figure 7A, classification performance is shown forRint
classifiers trained on 100-ms intervals of responses obtained from cat 1, and their weights are shown in Figure 7B. The performance was overall lower than that ofRtclassifiers (up to 16% decrease; colored
lines in Figure 7A), but nevertheless, at most time points, the classification was above the chance level, the shapes of the performance curves revealing a high degree of similarity to those of the Rt classifiers. Thus, time-invariant classification is also
possible. As expected, the performance of theRint classifiers also
dropped to chance level when tested on time points on which they were not trained. Interestingly, readouts sometimes produced even more classification errors than expected by chance. This ‘‘rebound’’ effect is exemplified by the green line in Figure 7A. Here, the classifier was trained on the 350–450-ms interval and tested on time points within the 150–250-ms interval. An analysis of the weights of theRintclassifiers revealed that they were also highly dissimilar when
trained at different intervals. For the fourRintclassifiers shown in
Figure 7A, the average correlation coefficient ranged between
r=20.03 (cat 1) andr= 0.33 (cat 3). In conclusion, these analyses
Figure 7. Performance of classifiers Rint trained to extract information during an interval lasting 100–300 ms (t= 20 ms). (A) Performance for four linear classifiers, each trained for one of the four consecutive intervals of 100-ms duration (color-coded bars). Thin gray line: classification performance of specializedRtclassifiers. (B) The weight vectors learned by the four classifiers in (A). (C–E) The performance of SVM
classifiers with different kernels trained on 200-ms (D) and 300-ms (C and E) intervals for three different experiments. Shaded stripe and dotted line are as described in Figure 2.
indicate that training and testing have to be performed on exactly the same time intervals to achieve good performance irrespective of whetherRintorRtclassifiers are used.
Less critical was the duration of the interval for which Rint
classifiers were trained. Even with time intervals longer than 100 ms, good classification performance could be achieved. In Figure 7C to 7E (cats 1 to 3), we show results for analyses with 200- or 300-ms-long training intervals. The performance did drop relative to theRtclassifiers (thin gray line in Figure 7A) but stayed
nevertheless high above the chance level. As was the case withRt
classifiers, performance of theRint classifiers was best when Mfrs
had high levels. This suggests that the performance of Rint
classifiers can increase further and perhaps approach the ceiling of 100% accuracy if the total number of spikes can be increased by recording simultaneously from even more neurons.
InRintclassifiers, the decrease in performance, in comparison to
Rt classifiers, was traded off with an increased resistance to jitter.
The performance ofRintclassifiers was not affected by small jitter
(SD = 10 ms). The maximum performance of Rint classifiers
dropped by 1% and 3% for cat 1 and cat 3, respectively, and these changes were not significant. Also, the effect of jitter has decreased with the size of the generalization interval, approaching the region of zero effects at interval lengths of about 100 ms (Figure S14). Apparently, as theRintclassifier must generalize over
the long period of time, unlike theRt classifier, it cannot benefit
from precise stimulus-locked events that occur at unique time points along the trial. Thus, forcing a classifier with short integration constants to use the same set of weights over the entire duration of the trial prevents these classifiers from relying on precise stimulus-locked information (see Figure S8 for an account of this phenomenon based on signal-to-noise ratios).
The notion thatRint classifiers learned to decode information
differently thanRts is suggested also by the finding that shuffling of
trials led to a drop of performance of Rint classifiers. With
int= 300 ms, the drop in classification performance was highly consistent across different experiments and along the trials, and amounted up to 14% (on average, 4.5% and 6.5% for cats 1 and 3, respectively; allp-values,0.0001, signed-rank test,n= 30). In no case did shuffling improve performance as observed with Rt
classifiers in cats 1 and 3 (Figure S15). As the performance ofRint
classifiers did not depend on jitter, this result suggests that these classifiers take advantage of correlations that occur on longer time scales (i.e., covariation in slow-rate responses).
Nonlinear readouts and the important role of second-order correlations. Finally, we investigated whether classification performance could be enhanced when the classifiers performed nonlinear operations on the input signals. To this end, we applied SVMs with quadratic kernels or with kernels such as radial basis functions (RBF) that provide high flexibility in implementing nonlinear transformations. Classification performance of these nonlinear classifiers was investigated separately for Rt and Rint
readouts and compared to that of linear readouts.
We found no evidence that nonlinear classification improved readout performance ofRt classifiers. Performance improvement
never exceeded 2% and never reached the level of statistical significance. Thus, consistent with the report by Hung et al. [23], linear classification was as good as nonlinear classification. This was also true forRintclassifiers if these were tested on responses to
single, isolated stimuli, as those shown in Figure 2 (Figure S1). In contrast, nonlinearRintclassifiers (int= 150–450 ms) achieved
better performance than linear Rint when applied for the
identification of one-back stimuli. Already with quadratic transfor-mations, the ability to identify a previously presented stimulus increased the maximum performance by,6% in cat 1 and by 10%
in cat 3, but not in cat 2, which was an exception to that result (Figure 7C–7E). On average, performance increased by 5.3% and 2% for cats 1 and 3, respectively, and these changes were significant (two samplet-tests,n= 10, allp-values,0.01). Quadratic transfor-mations use information stored in second-order correlations between the variables more efficiently than linear classifiers, as quadratic operations involve multiplicative operations between the weighted contributions of the inputs (as opposed to simple, weighted summation in a linear system). This form of nonlinearity only takes into account pairwise correlations. Classifiers based on RBFs—by contrast—take into account also higher-order correlations. Re-markably, application of RBFs did not improve performance above the level attained with quadratic classifiers (Figure 7C–7E) (for more detailed analysis, see Figure S16). This indicates that most of the stimulus-specific information used by the nonlinear Rint readout
could be extracted already from second-order correlations. Previous studies examining synchronization among neuron populations [45,46] found that second-order correlations can account for almost all the correlation patterns observed in certain natural neuronal networks, and thus, higher-order correlations are unlikely to convey additional information. However, the nonlinear
Rint classifiers, being robust to jitter, could not have evaluated
precise timing relations between spikes. Instead, they could have relied on slow stimulus-locked changes in firing rates, which may carry information at the level of second-order correlations. To investigate this possibility, for the four input units that made the largest contribution to the performance of the quadratic Rint
classifier, we calculated the Mfrs and areas under receiver-operating characteristics (AUC) for all units individually and for the products of the Mfrs for all possible pairs of these units (Figure 8) (see also Figure S17). This revealed that the products differ strongly for different stimuli, leading to high AUC values. Moreover, maximum differentiation between the stimuli occurs often at different time points for products of Mfrs and for individual Mfrs. These results indicate that second-order correla-tions of neuronal firing rates are informative of stimulus properties and, in principle, can be used by classifiers.
There is one more potential source of correlations that may be picked up by nonlinear Rint classifiers. Averbeck et al. [24]
have shown that slow covariations in overall firing rates (responsiveness of neurons) can boost classification performance. In Figure S18, we show that, indeed, firing rates vary along the experiment in a manner that is highly correlated across units. Thus, slow covariations in rate responses may benefit
Rintclassification when second-order correlations are considered.
However, the scope of their contribution is, at best, limited because even if these correlations are removed by shuffling the trials and only stimulus-locked correlations are maintained [43], a polynomialRintis more efficient than a linear one. Under
these conditions, we found a 5.6% and 7.2% increase in the peak performance for cats 1 and 3, respectively. The mean performance along the trial also increased for these two cats by 5.0% and 2.8%, respectively (signed-rank tests, allp-values,0.0001, alln’s = 30).
In conclusion, these results indicate that time-invariant classification is in principle possible and can attain a very high level of performance if the responses of a sufficient number of neurons can be evaluated. This evaluation can be achieved by linear classifiers similar to I&F neurons. As indicated by the shuffling test, unlikeRtclassifiers, the linearRintclassifiers rely to a
substantial extent on information that can only be extracted from temporal patterns in the joint activity of the recorded neurons. In addition, nonlinear Rint classifiers, also in contrast to Rts, can
enhance classification performance by using information about correlations, which may come from different sources.
Discussion
Our results demonstrate that the distributed activity of neurons in cat primary visual cortex (area 17) contains information about previously shown images and that this information is available for a prolonged period of time. The information can be extracted by simple computer-simulated readout neurons and is available for as long as the firing rates stay elevated. These findings are related to the results obtained in macaque IT cortex [23], but there are also a number of differences. First, we show that information required for stimulus classification can be extracted easily from neurons at early processing stages that represent detailed and feature-based information, and under anesthesia. The results are similar to those obtained from neurons in IT that represent categorical informa-tion. Second, stimulus-specific information is readily extractable also from responses evoked by the offset of the stimulus (off-responses). This suggests that off-responses play an important role in cortical functions, and hence, should be studied more thoroughly than is usually the case. Third, by presenting sequences of stimuli, we show that the system has reliable memory for one stimulus back. Fourth, we were able to identify the response variables (neuronal code) that carry the stimulus-related informa-tion. The classifiers relied on information carried both by neuronal
firing rates and by precise timing of neuronal spiking events locked to the stimulus. As the classification was based on an estimate of integration time constants of cortical pyramidal neurons (t= 20 ms), the results suggest that upstream projection neurons in the cortex—those that receive information from early visual areas—should also be able to use this information. In other words, the results suggest that precise timing of action potentials complements the information available in neuronal firing rates and thus that both types of information can in principle be used as a neuronal code.
The finding that most of the timing information used by Rt
readouts was contained in the stimulus-locked timing of action potentials (evoked temporal structure) and that the internally generated timing information (induced temporal structure; noise correlation) supported onlyRintclassification is probably due to the
prominent temporal structure of the rapidly repeating stimuli (5-Hz stimulation rhythm due to 200-ms period between stimulus presentations). Rager and Singer [47] have shown that when a stimulus is flickered with a similar frequency, cortical responses exhibit resonance phenomena to the periodic nature of the stimulus. As a consequence, higher frequencies (.20 Hz) are strongly suppressed. Therefore, for the present stimuli, most of the classification performance based on precise spike timing can be Figure 8. Information contents of neuronal firing rates and their second-order correlations.(A) Lefty-axis: the average firing rates (Mfrs) in response to two different stimuli for the four most informative units in the analysis of time invariant classification withint= 150–450 ms, cat 1. Righty-axis: area under receiver-operating characteristic (AUC), related to the probability of correct classification. (B) Pairwise correlations in rate responses, expressed as a product between Mfrs in (A) and the corresponding AUC values obtained from these products.
accounted for by inhomogeneous Poisson processes with fast fluctuating rates (#,20 ms), whose timing is locked to the stimulus onset. This suggests that neuronal synchrony driven by internally generated rhythms does not play an important role for these stimuli and is in agreement with the finding that if Rt
readouts were endowed with polynomial kernels, optimal for detection of pairwise correlations, classification results did not improve. The present results do not allow us to identify the type of information used by real readout systems in the brain. Some cortical neurons may operate with longer time scales (e.g.,
,100 ms) and may rely predominantly on slow changes in rate responses. As our results suggest, these neurons can also achieve good classification performance.
The present results were surprisingly consistent across the range of classifiers used. We obtained similar classification performance irrespective of the type of kernel applied to SVM, for a wide range of the time constants used for convolution of the spike trains, and across different cats. The robustness of these findings is all the more surprising if one considers the high level of trial-to-trial variability, which is a typical property of neuronal rate responses [40,48–53], and was also found in the present data (see Materials and Methods). Future experiments should investigate the level of robustness achievable for more difficult classification decisions than the binary ones made in the present study.
Because the responses fed to the classifier had been recorded simultaneously, we were also able to examine whether additional information was encoded in non–stimulus-locked correlations between the responses of different neurons. Applying nonlinear readouts revealed that this was indeed the case for Rint
classification that takes advantage only of slow-rate covariation. Performance improved over the linear readouts, but importantly, this improvement was limited to pairwise correlations (quadratic kernels). One possibility is that similar to precise neuronal synchrony, no additional information is contained in correlations of higher order also for slow covariation in rate responses. This would be consistent with the report that pairwise synchronizations account for most or all of the entropy within the system [45,46]. Therefore, the claim that higher-order correlations contain no additional information appears to be generalizable to slower time scales.
AsRtreadouts operate, by design, with less input information
thanRints, we cannot rule out the possibility that the effects of the
second-order correlations (but also those of trial shuffling) would not become significant with a larger dataset—i.e., if more statistical power was available. However, irrespective of this significance, the absolute magnitudes of these effects were always smaller forRtthan forRintclassifiers, whereas on the other hand,
Rts were overall more accurate than Rints. Thus, a principal
difference in the nature of information exploited by the two classification strategies remains and needs to be dealt with. In the present study, we deciphered only partly the characteristics of the two approaches to decoding information. Further efforts, possibly relying heavily on theoretical analyses, will also be needed in order to understand fully the respective implications and (dis-)advantages of the two strategies. Thus, not only the time span of integration (as investigated here), but also the time span (possibly longer) appropriate for generalization, may need to be considered in future studies. These considerations may be relevant for settling the long-standing disputes over the principles by which informa-tion is encoded and extracted in the brain (e.g., [31,54]).
Early visual areas are likely candidates for the implementation of visual persistence and iconic memory [27], because of their retinotopic organization and their noncategorical, feature-based responses [1]. Iconic memory is believed to operate on the basis of
automatic (preattentive) processes and it is possible, therefore, that the respective mechanisms also remain operational under anesthesia. Considering that iconic memory declines with similar time constants as the retrievability of stimulus-specific information in the present experiment and is sensitive to masks [26,27,29,42], it is conceivable that we studied a related mechanism. The discovered one-back memory may be responsible for both the integration process in iconic memory and masking effects. The particular outcome would then depend on whether the two subsequent component images (i.e., the ‘‘icons’’) are meaningful only when isolated (masking) or only when integrated.
Our results suggest that the mechanisms responsible for the temporary storage of stimulus-specific information involve mod-ifications that are often not directly detectable in population rate responses due to the suppression induced by subsequently presented stimuli. Nevertheless, through this suppression process-es, the activity from the past affects also the responses to the most recent stimuli. As a consequence, it is possible to identify accurately the past stimuli from the responses evoked by the present. The suppression of sustained activity is likely to involve active inhibition but possibly also more complex mechanisms. Information about the nature of the first stimulus could be contained in the patterning of inhibitory influences, which could then shape the subsequent excitatory responses, but the process may also involve reentry loops from higher cortical areas. Other possibilities are mechanisms of short-term plasticity such as use-dependent transient changes of transmitter release [55], receptor sensitivity [56], and postsynaptic excitability [57]. Although we did not find evidence that adaptation of neuronal responses [58] is responsible for one-back memory, we cannot completely rule out the possibility that these mechanisms play at least some role. It is currently unclear whether and under which circumstances similar long-lasting responses also occur in the awake state and in other brain areas. In some studies, stimuli presented in IT cortex produced short off-responses [23,59], but in others, the responses are as long as in the present study [60]. One possibility is that the duration of responses depends on the deployment of selective attention, which is necessarily involved in the working memory tasks applied in such studies [61]. Attention may produce suppressive effects similar to those achieved by a second stimulus under anesthesia. Studies on iconic memory suggest this possibility as focusing attention on one subset of items impedes retrieval of the remaining items from that storage [25].
An important factor for temporal integration of information based on fading memory is that the information about a preceding stimulus is not simply superimposed linearly on that of the most recent stimulus. Rather, these effects should be nonlinear, as revealed by the successful XOR classification. Such superposition of information is also a prediction by computer simulations of generic cortical microcircuits [31]. These results indicate that cortical networks are not confined to operating as a serial processing pipeline, where a sequence of precisely structured processing steps is applied sequentially to each input frame but can, in principle, involve kernel-like processors that fuse information from different time slices in such a way that a simple linear classifier (i.e., the readout) can extract information about the stimulus. The important advantage of processes based on fading memory is that novel complex computations can be implemented if only the readout learns by adjusting the weights of its synapses, as emulated in the present study, whereas the remaining part of the system can stay unchanged. The main prerequisite for the implementation of such functions is that nonlinear interactions are combined with fading memory for recent inputs. As suggested by the present study, these are exactly the properties of responses in
early visual areas. Thus, cortical neurons at later processing stages have access to signals that have already been subjected to temporal integration.
In conclusion, our data provide support for the existence of fading memory and nonlinear integration between past and present input already at the level of V1. This suggests that the brain exploits the computational advantages of such processes as predicted by computer simulations of generic cortical microcircuits [31,62], not only for high-level computations, but with all likelihood at all levels of cortical processing. Another, potentially important implication of this finding is that relatively simple readout devices can be used to evaluate complex trajectories of time-varying neuronal activity patterns. This feature can be exploited for the construction of prosthetic devices controlled by neuronal activity.
The present study leaves several questions unanswered. To determine the boundary conditions for the present phenomena, stimulus presentation times need also to be changed systematically. Experiments with larger numbers of electrodes are required in order to examine whether the present findings still hold when the number of simultaneously recorded neurons approaches more closely the number of presynaptic inputs to a typical cortical neuron. Further, psychophysical experiments will be needed to validate our proposal that the present memory effects are closely related to iconic memory. Finally, one would like to obtain direct evidence that cortical neurons actually use the information in the same way as our artificial readouts. However, at present, it is unclear how this could be achieved.
Concluding Remarks
Olshausen and Field [63] have argued recently that fundamen-tal aspects of visual cortex functions are still unknown. The present results support this notion in that they force us to extend classical theories on visual processing. These are based on the notion that the main functions of the visual processing hierarchy consist of the extraction and recombination of elementary visual features in divergent–convergent and hierarchically organized feedforward architectures (e.g., [37]). In this case, scene analysis is essentially based on frame-by-frame computations in which each new input is processed independently of the previous one. Hence, there is no memory for the past, and such memory is even considered disturbing rather than useful. In contrast, we find evidence for fading memory in combination with nonlinear temporal interac-tions, at least in early visual areas. Processes supporting both perception and action may benefit from such memory mechanisms because these offer a much wider spectrum of (time-dependent) computations than feedforward architectures. As our data suggest, precise timing of action potentials plays an important role in these processes, suggesting that, besides firing rates, cortical processing also exploits time and temporal relations as coding space. Materials and Methods
Experimental Procedures
All the experiments were conducted according to the guidelines of the Society for Neuroscience and the German law for the protection of animals, approved by the local government’s ethical committee, and overseen by a veterinarian. In five cats, anesthesia was induced with ketamine and maintained with a mixture of 70% N2O and 30% O2 and with halothane (0.4%–0.6%). The cats were paralyzed with pancuronium bromide applied intravenously (Pancuronium, Organon, 0.15 mg kg21h21). Multiunit activity (MUA) was recorded from area 17 with multiple silicon-based 16-channel probes (organized in a 464 spatial matrix), which were supplied by the Center for Neural Communication Technology at
the University of Michigan (Michigan probes). The intercontact distances were 200mm (0.3–0.5 MV impedance at 1,000 Hz). Signals were amplified 1,0006and, to extract unit activity, were filtered between 500 Hz and 3.5 kHz. Digital sampling was made with 32 kHz frequency, and the waveforms of threshold-detected action potentials were stored for an off-line spike sorting procedure. The probes were inserted approximately perpendicular to the surface of the cortex, allowing us to record simultaneously from neurons at different cortical layers and at different columns. Up to three probes were inserted simultaneously, allowing for recordings from up to 48 electrode contacts (channels) in parallel, each providing a signal with multiunit activity. This arrangement produced a cluster of overlapping receptive fields (RFs), all RFs being covered by the stimuli (Figure 1A in the main text). Results for one cat were obtained from the same preparation as in [9] and for another cat from [4]. These studies also describe further details on recording techniques.
Stimuli were presented binocularly on a CRT monitor (210, HITACHI CM813ET) with 100-Hz refresh rate and by using the software for visual stimulation ActiveSTIM (http://www. ActiveSTIM.com). After mapping the borders of the respective RFs, binocular fusion of the two eyes was achieved by aligning the optical axes with an adjustable prism placed in front of one eye. The stimuli consisted of single white letters that spanned approximately 5u of visual angle and that were composed of elementary features suitable for evoking strong responses in area 17. The stimuli were presented with maximal brightness on a black background (thus, also with the maximal contrast) and were placed such that they stimulated the cluster of RFs near optimally. For presentation of single letters, we used letters A and D, each presented for 100 ms. Stimulus sequences of three letters consisted of letters A, B, C, D, and E and were either presented as sequences ABC, DBC, and ADC (cat 1) or sequences ABE, CBE, ADE, and CDE (cats 2 and 3). Each member of a sequence was presented for 100 ms, and the blank period separating the presentation of letters also lasted, in most cases, 100 ms. For each stimulation condition (single letter or a sequence), 50 (cat 1), 100 (cat 4), or 150 (cats 2, 3, and 5) repetitions were made. In a control experiment, we varied the blank period between two stimuli presented in a sequence, the periods having the values 100, 200, 300, and 500 ms. In this experiment, the first stimulus in the sequence was always a letter (A or C), whereas as the second stimulus, we randomly exchanged a letter (B) with a white blank screen that had the same luminance as the letter stimuli. This control experiment was made on a separate cat, which ensured that we fully avoided repetitive presentations of identical blank periods, which were made in other cats. The block randomization of the presentation order ensured that no more than two blank periods of identical duration occurred in a row. Sinusoidal gratings were presented with full contrast, spanned 18uof visual angle, had spatial frequency of 2.6 cycles/degree, and drifted with the speed of 2.0u/s, thereby being suitable for evoking strong responses in area 17. For an overview of experiments performed on each cat, see Table S1.
Data Analysis
Off-line spike-sorting procedures. To extract single units, extracellularly recorded spike waveforms of each channel were subjected first to principal component analysis and then to clustering procedures whereby the waveforms of similar shapes were assumed to be generated by the same neuron [64]. In some cases, separation of single units was not possible due to undistinguishable shapes of waveforms, usually of small amplitude. In this case, multiple single units were pooled into a larger multiunit. Also, it was not possible to treat clearly distinguishable single units as separate entries if these