NBER WORKING PAPER SERIES
PRIVATE EQUITY AND EMPLOYMENT Steven J. Davis John C. Haltiwanger Ron S. Jarmin Josh Lerner Javier Miranda Working Paper 17399 http://www.nber.org/papers/w17399
NATIONAL BUREAU OF ECONOMIC RESEARCH 1050 Massachusetts Avenue
Cambridge, MA 02138 September 2011
We thank Chris Allen, Ronald Davis, Kyle Handley, and Sarah Woolverton for research assistance with this project and Per Stromberg for data on the classification of private equity transactions. Francesca Cornelli, Per Stromberg, a number of practitioners, and participants at the American Economic Association meetings, the NBER “New World of Private Equity” conference, the AEI Conference on “The History, Impact and Future of Private Equity,” and various university conferences and seminars provided many helpful comments. The World Economic Forum, the Kauffman Foundation, Harvard Business School’s Division of Research, and the Global Markets Initiative at the University of Chicago Booth School of Business provided generous financial support for this research. One of the authors has advised institutional investors in private equity funds, private equity groups, and governments designing policies relevant to private equity. The analysis and results presented herein are attributable to the authors and do not necessarily reflect concurrence by the US Census Bureau. All results have been reviewed to ensure that no confidential information is disclosed. All errors and omissions are our own. The views expressed herein are those of the authors and do not necessarily reflect the views of the National Bureau of Economic Research.
NBER working papers are circulated for discussion and comment purposes. They have not been peer-reviewed or been subject to the review by the NBER Board of Directors that accompanies official NBER publications.
Private Equity and Employment
Steven J. Davis, John C. Haltiwanger, Ron S. Jarmin, Josh Lerner, and Javier Miranda NBER Working Paper No. 17399
September 2011
JEL No. G24,G34,J23,L25
ABSTRACT
Private equity critics claim that leveraged buyouts bring huge job losses. To investigate this claim, we construct and analyze a new dataset that covers U.S. private equity transactions from 1980 to 2005. We track 3,200 target firms and their 150,000 establishments before and after acquisition, comparing outcomes to controls similar in terms of industry, size, age, and prior growth. Relative to controls, employment at target establishments declines 3 percent over two years post buyout and 6 percent over five years. The job losses are concentrated among public-to-private buyouts, and transactions involving firms in the service and retail sectors. But target firms also create more new jobs at new establishments, and they acquire and divest establishments more rapidly. When we consider these additional adjustment margins, net relative job losses at target firms are less than 1 percent of initial employment. In contrast, the sum of gross job creation and destruction at target firms exceeds that of controls by 13 percent of employment over two years. In short, private equity buyouts catalyze the creative destruction process in the labor market, with only a modest net impact on employment. The creative destruction response mainly involves a more rapid reallocation of jobs across establishments within target firms.
Steven J. Davis
Booth School of Business The University of Chicago 5807 South Woodlawn Avenue Chicago, IL 60637 and NBER Steven.Davis@ChicagoBooth.edu John C. Haltiwanger Department of Economics University of Maryland College Park, MD 20742 and NBER haltiwan@econ.umd.edu Ron S. Jarmin
Center for Economic Studies U.S. Census Bureau
4600 Silver Hill Road Washington, DC 20233 ron.s.jarmin@census.gov
Josh Lerner
Harvard Business School Rock Center 214
Boston, MA 02163 and NBER
jlerner@hbs.edu Javier Miranda
U.S. Bureau of the Census Center for Economic Studies 4600 Silver Hill Road Washington, DC 20233 javier.miranda@census.gov
An online appendix is available at:
1. Introduction
The employment impact of leveraged buyouts by private equity firms arouses intense
concern and strongly held views. For instance, former Danish Prime Minister Poul Rasmussen –
architect of the European Commission’s recently enacted Alternative Investment Fund Managers
Directive – contends that “‘leveraged buy-outs’ leave the company saddled with debt and interest
payments, its workers are laid off, and its assets are sold, … benefiting neither workers nor the
real economy.” The Service Employees International Union, prominent critic of private equity on
both sides of the Atlantic, offers this assessment: “Typically it’s easier to decrease costs quickly
by cutting heads, which is why buyouts have typically been accompanied by layoffs.”1
Responding to similar contentions, several industry-sponsored studies claim positive
employment effects of private equity. Examples include European Venture Capital Association
(2005), British Venture Capital Association (2006), A.T. Kearney (2007), Taylor and Bryant
(2007), and Shapiro and Pham (2008).
Efforts to bring data to the issue are highly welcome, but these studies have serious
limitations. First, they rely on surveys with incomplete and perhaps selective responses, raising
doubts as to whether the data accurately reflect the experiences of employers acquired by private
equity groups. Second, the underlying data offer little scope to control for employment changes
at comparable firms. When a firm backed by private equity sheds 5% of employment, the
interpretation depends greatly on whether comparable firms grow by 3% or shrink by 10%.
Third, these studies do not distinguish cleanly between employment changes at firms backed by
venture capital and firms backed by other forms of private equity. Both are interesting, but the
controversy involves buyouts and other later-stage private equity transactions, not venture
capital. Fourth, these studies face major difficulties in measuring organic job growth because the
underlying data sources do not contain establishment-level observations. As a result, it is
difficult to disentangle organic growth from the acquisition and sale of particular facilities and
operating units. Fifth, the lack of establishment-level data also precludes a breakdown of
firm-level employment changes into job creation and job destruction components, i.e., gains and
losses at the establishment level. As we show, private equity transactions have different effects
on these two margins of employment change.2
In this study, we construct and analyse a dataset that overcomes these limitations and, at
the same time, encompasses a much larger set of employers and private equity transactions. We
rely on the Longitudinal Business Database (LBD) at the U.S. Census Bureau to follow
employment in private equity-backed companies in the United States. Using the LBD, we track
employment before and after private equity transactions at the level of firms and establishments
– i.e., specific factories, offices, retail outlets and other distinct physical locations where business
takes place. The LBD covers the entire nonfarm private sector and includes annual data on
employment for about 5 million firms and 6 million establishments. In addition to its other
strengths, the establishment-level information in the LBD enables us to explore important
aspects of within-firm restructuring activity in the wake of private equity events.
We combine the LBD with data from CapitalIQ and other sources to identify and
characterize private equity transactions. The resulting matched sample contains about 3,200 U.S.
firms acquired in private equity transactions from 1980 to 2005 (“target firms”) and 150,000
U.S. establishments operated by these firms as of the transaction (“target establishments”). To
construct firm-level controls, we match each target to other firms in the transaction year that are
2
See Service Employees International Union (2007) and Hall (2007) for other critiques. We discuss the broader academic literature on the economic effects of private equity in Section 2. Few academic studies of private equity focus on employment outcomes, and the main exceptions consider data for France and the United Kingdom.
comparable in terms of industry, age, size, and single/multi-establishment status. We then follow
targets and matched controls over time. We take a similar approach to controls for target
establishments. In our econometric analysis of employment dynamics, we also control for
pre-buyout growth history.
To clarify the scope of our study, we consider later-stage changes in ownership and
control executed and partly financed by private equity firms. In these transactions, the (lead)
private equity firm acquires a controlling stake in the target firm and retains a significant
oversight role until it “exits” by selling its stake. The transaction typically involves a shift toward
greater leverage in the capital structure of the target firm and, sometimes, a change in its
management. We exclude management-led buyouts that do not involve a private equity firm. We
also exclude startup firms backed by venture capitalists.
There are three main elements in our analysis of employment outcomes associated with
private equity transactions. First, we track target establishments for five years before and after
the transaction, irrespective of whether the target firm owns and operates these establishments
throughout the entire time window. We compare the paths of employment, job creation, and job
destruction at target establishments to the paths at control establishments. By following
individual production units over time, this element of our analysis overcomes key shortcomings
in previous studies of private equity buyouts. Those studies are not able to describe what happens
to the particular establishments and workers initially touched by private equity acquisitions.
Second, we undertake a firm-level analysis to encompass job creation at “greenfield”
establishments opened after the private equity transaction. We identify and quantify greenfield
job creation by target firms backed by private equity and compare with greenfield job creation by
quantify the effects of private equity transactions on the reallocation of jobs across
establishments within and between firms. Taken together, the various elements of our analysis
yield a much fuller and richer picture of the relationship between private equity transactions and
employment outcomes.
Our establishment-level analysis yields three main findings: First, employment shrinks
more rapidly, on average, at target establishments than at controls after private equity
transactions. The average cumulative difference in favor of controls is about 3% of initial
employment over two years and 6% over five years. Second, the larger post-transaction
employment declines at target establishments entirely reflect higher rates of job destruction at
shrinking and exiting establishments. In fact, the post-transaction creation of new jobs at
expanding establishments is greater for targets than controls. Third, mean employment growth
rates are similar for target and control establishments in the two years before buyout, and targets
grow more rapidly in the transaction year.
The establishment-level analysis does not fully answer the question of how employment
evolves in the wake of private equity transactions. Most important, it misses job creation at
newly opened establishments, whether by target or control firms. To capture this aspect of job
creation, we move to a firm-level analysis and identify new establishments opened after the
private equity transaction. The combination of firm and establishment data in the LBD is what
enables us to isolate and quantify greenfield job creation. For this part of our analysis, we
shorten the time window to two years post transaction. Lengthening the window involves a
greater incidence and complexity of ownership changes, threatening the integrity of our
firm-level longitudinal linkages or forcing us to rely on a selected sample.
Target firms engage in more greenfield job creation than control firms, with a cumulative
greenfield job creation partly offsets the relative employment drop at target establishments in the
wake of private equity transactions. Our firm-level analysis also yields another interesting result:
Private equity targets engage in more acquisitions and more divestitures than controls. Over the
first two years post buyout, the employment-weighted acquisition rate is almost 6 percentage
points higher at target firms, and the divestiture rate is almost 3 percentage points higher.
Summing over job creation and destruction at continuing establishments, job losses at
establishments that shut down, job gains at greenfield establishments, and the contributions of
acquisitions and divestitures, employment shrinks by less than 1% at target firms relative to
controls in the first two years after private equity buyouts.
We uncover a much larger response in the pace of job reallocation. Specifically, over the
first two years after the transaction, establishment-level job gains and losses at target firms
exceed gains and losses at controls by 13% of initial employment. This extra job creation and
destruction activity amounts to more than 30% of baseline job reallocation rates at control firms.
A more rapid pace of organic job creation and destruction accounts for 43% of the extra
reallocation activity at target firms, and a more rapid pace of acquisitions and divestitures
accounts for the rest. These results indicate that private equity buyouts catalyze the creative
destruction process, at least as measured by job creation and destruction and by the transfer of
production units between firms.
We also document large outcome differences by type of private equity transaction and by
industry. The most visible transactions involve publicly traded firms that come under private
equity control. These public-to-private cases account for a small share of transactions but are
typically larger than other deals, and they attract the lion’s share of media attention. As it turns
in the first two years after private equity buyouts of publicly traded firms. There are also large
differences by industry. In the manufacturing sector, which accounts for about a quarter of U.S.
private equity transactions, post-buyout growth at target establishments is only slightly slower
than at controls. In contrast, Services and especially Retail Trade exhibit much larger
employment declines at target establishments in the wake of private equity buyouts.
The next section briefly reviews related research. Section 3 describes the construction of
the datasets for our analysis, and Section 4 motivates and explains our empirical methods.
Sections 5 and 6 present our main establishment-level and firm-level analyses. Section 7 draws
out the implications for job reallocation and the role of private equity in the creative destruction
process. Section 8 highlights important outcome differences by industry and type of transaction,
and Section 9 offers concluding remarks.
2. Related Work
Economists hold a longstanding interest in how ownership changes affect productivity
and employment. Examples include Lichtenberg and Siegel (1987), Long and Ravenscraft
(1993), McGuckin and Nguyen (2001), and Harris, Siegel and Wright (2005). One ownership
change that attracts particular attention is the acquisition of firms by professional private equity
investors. Jensen (1989) and Shleifer and Summers (1988), among others, discuss the economic
effects of private equity transactions based largely on case study evidence. Kaplan and
Strömberg (2009) provide a useful overview of research on the economic effects of private
equity.
Few previous studies focus on the employment effects of private equity transactions, and
the exceptions typically rely on small samples dictated by data availability. Kaplan (1989)
considers 76 public-to-private leveraged buyouts (LBOs) during the 1980s. He finds that the
year prior to the private equity transaction to the end of the fiscal year after the transaction. After
dropping target firms with asset sales or purchases that exceed 10% of total value, the adjusted
employment decline is 6.2% for the remaining 24 firms. Muscarella and Vetsuypens (1990)
consider 72 firms that completed an initial public offering (IPO) after an LBO between 1983 and
1987. For the 26 firms they can track, employment declines by an average of 0.6% between the
LBO and the IPO. This outcome represents less employment growth than 92% of the publicly
traded firms in Compustat.
In work close in spirit to our study, Lichtenberg and Siegel (1990) use U.S. Census
Bureau data to examine changes in employment at the manufacturing plants of 131 firms
undergoing buyouts between 1981 and 1986. On an industry-adjusted basis, employment falls
by 1.2% per year after buyout, as compared to a 1.9% annual rate of decline beforehand.
Declines are larger for non-production workers than blue-collar workers. Wright, Thompson and
Robbie (1992) and Amess and Wright (2007) similarly find that buyouts in the UK lead to
modest employment declines. These studies follow overall employment at a set of firms, and
contrast it with aggregate employment at matching firms.3 Boucly, Sraer and Thesmar (2009)
find that employment grows much more rapidly at target firms than at controls in the wake of
French private equity transactions. They attribute this result to an important role for private
equity in relaxing financing constraints for target firms in France.
These studies share certain weaknesses. First, they focus on the company-wide
employment of firms backed by private equity. Thus, the sale of a division or other business unit
is typically counted as an employment loss, even if the sold business unit continues with the
same number of employees under new ownership. Likewise, the acquisition of a division or other
business unit is counted as an employment gain, even if there is no employment change at the
business unit itself. Several studies attempt to address this issue by dropping buyouts that
involve substantial asset sales, but this sample restriction may greatly influence the results, given
the extent of “asset shuffling” by firms backed by private equity.
Second, previous U.S. studies consider a modest number of deals in the 1980s. The
private equity industry is now much larger. Using inflation-adjusted dollars, fundraising by U.S.
private equity groups rose 36-fold from 1985 to 1998 and more than 100-fold by 2006.4 The
tremendous growth in private equity activity allows us to examine a much larger set of deals.
Moreover, the nature of private equity activity has also changed over time – competition for
attractive deals has intensified, and many private equity firms now have a strong operational
orientation, as opposed to the financial engineering approach that characterized many groups
during the 1980s.
Third, previous U.S. studies of private equity deals rely on highly selected samples, and
most studies treat the firm as the unit of analysis. The selected nature of the sample is a
potentially important source of bias in the findings. The handful of previous studies that treat
establishments as the unit of observation are typically restricted to the manufacturing sector, and
even then face limitations in their ability to track establishment or firm closings. It is also
desirable to look beyond the public-to-private transactions that dominate earlier samples, but
which account for a minority of transactions.
Our study overcomes these weaknesses, as we have explained. In addition, we exploit the
establishment-level aspect of our data to examine job creation and job destruction outcomes, as
well as net employment changes. In this regard, we are motivated in part by previous work that
documents a rapid pace of establishment-level job creation and destruction. Davis and
4
Haltiwanger (1999) review work in this area. Earlier empirical work also shows that the
reallocation of jobs and workers across establishments plays a major role in medium-term
productivity gains. Many important theoretical models also feature distinct roles for the creation
and destruction margins of employment adjustment. Caballero (2007) provides an insightful,
detailed analysis and extensive references to the relevant literature.
3. Constructing the Analysis Samples
Our analysis requires a comprehensive database of private equity transactions and the
matching of target firms to firm-level and establishment-level records in the LBD. This section
describes the data construction process and the resulting samples.
A. Identifying private equity transactions
CapitalIQ has specialized in tracking private equity deals on a worldwide basis since
1999 and, through extensive research, has backfilled transactions prior to 1999.5 We consider all
recorded transactions in CapitalIQ that closed between January 1980 and December 2005. We
then impose two sample restrictions. First, we restrict attention to transactions that entail some
use of leverage. Many transactions that do not involve leverage are venture capital investments
rather than private equity investments in mature firms. To keep the focus on private equity, we
delete transactions not classified by CapitalIQ as “going private,” “leveraged buyout,”
“management buyout,” “platform,” or a similar term. This approach excludes “growth buyouts”
and “expansion capital” transactions that involve the purchase of a minority stake using little or
no leverage. These transactions do not fit the classic profile of leveraged buyouts, although they
may share other characteristics of private equity transactions. Second, the CapitalIQ database
includes a number of transactions that do not involve a financial sponsor, i.e., a private equity
firm. We delete these deals as well. While transactions in which a management team takes a firm
private using its own resources are interesting, they are not the focus of our study or the recent
controversies surrounding private equity activity.
After restricting the sample in these two ways, the resulting database contains about
11,000 transactions worldwide. Dropping transactions that involve firms with foreign
headquarters leaves about 5,000 U.S. target firms acquired in private equity transactions between
1980 and 2005. (We do not consider U.S. establishments operated by foreign targets.) To fill out
our information about private equity transactions and target firms, we supplement the data drawn
from CapitalIQ with data from Dealogic, Thomson Reuters SDC, VentureXpert databases, and
news stories. Dealogic, in particular, often contains greater detail about transaction
characteristics. Other useful information in the supplementary sources includes alternative names
associated with target firms and their later acquisitions and sales.
B. Matching to LBD Records
The LBD derives from the Census Bureau’s Business Register, which contains annual
data on U.S. businesses with paid employees. The LBD covers the entire nonfarm private sector
from 1976 to 2005. In recent years, it contains over 6 million establishment records and almost 5
million firm records per year. The Business Register and the LBD draw on administrative
records and survey sources for data on firms and their establishments. Core data items include
employment, payroll, four-digit Standard Industrial Classification (SIC) or six-digit North
American Industrial Classification (NAICS), employer identification numbers, business names,
and information about location.6 Identifiers in the LBD files enable us to compute growth rate
measures for establishments and firms and to track their entry and exit and ownership changes.
6
Firms in the LBD are defined based on operational control, and all establishments majority
owned by a parent firm are included in the parent’s activity measures.
To merge data on private equity transactions into the LBD, we match names and
addresses of private equity portfolio firms (i.e., target firms) to LBD name and address records.
To cope with timing differences between datasets, we search over a three-year window in the
LBD centered on the transaction year for each target firm. We adopt a conservative approach to
matching that requires either an exact match on name or address or an approximate match on
both name and address according to probability-based matching algorithms. Our procedures
match about 65% of target firms to the LBD, 70% on a value-weighted basis, yielding about
3200 matched targets firms. Once matched, firm-establishment links in the LBD serve to identify
all establishments owned by target firms as of the private equity transaction. Matched target
firms operate about 150,000 U.S. establishments as of the transaction year. LBD longitudinal
links allows us to follow individual firms and establishments over time. As discussed below,
tracking firms is more challenging than tracking establishments, which influences the design of
our firm-level analysis sample.
Given our interest in employment dynamics, the relationship of the LBD employment
measure to the timing of private equity transactions requires careful treatment. The LBD reports
total employment in the payroll period containing the week of March 12th. Accordingly, for
private equity transactions that close before October 1, LBD employment in March of the same
calendar year serves as our contemporaneous employment measure. We assign transactions that
close on or after October 1 in year t to year t+1 for purposes of our analysis, treating the LBD
employment value in March of t+1as the contemporaneous measure. October is the natural
Figure 1 shows the number of U.S. target firm acquisitions by year and the number
matched to the LBD. It is apparent that the number of private equity transactions grew rapidly
beginning in the mid-1990s. Table 1 shows the enterprise value (debt plus equity, as valued at
the time of the transaction) of all private equity targets and the matched targets by sub-periods
(we group years together in Table 1 to avoid disclosing individual firm data given the skewed
distribution of values). The enterprise value of private equity acquisitions is very large in the
later years, reaching 420 billion in the 2000-2005 period. Figure 2 displays employment data for
our matched target firms. For example, target firms acquired in 2005 and identified in the LBD
account for 0.83% of total nonfarm business employment in 2005. Given the extent of
unmatched targets, the full set of firms that came under private equity control in 2005 accounts
for well over one percent of private sector employment. Based on our data, it is reasonable to
infer that more than 7 percent of private sector employment came under private equity control at
some point in the ten-year period from 1998 to 2007.7
C. Target Firms and Establishments in the Analysis Samples
Our study considers three related samples. For descriptive statistics on the number and
volume of private equity transactions and their distribution by industry and firm characteristics,
we consider all matched targets through 2005. For our establishment-level analysis sample, we
consider private equity transactions from 1980 to 2000. This sample allows us to track target
establishments for five years before and after the buyout year. For our firm-level analysis
sample, we consider transactions from 1980 to 2003, so that we can track firm-level outcomes
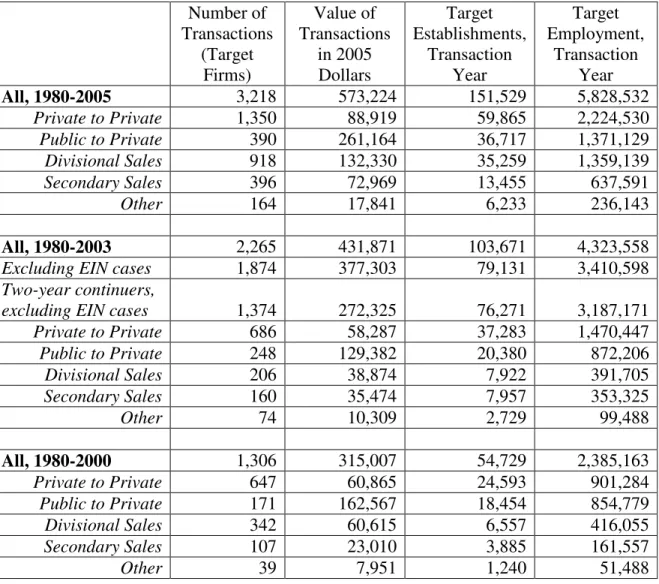
for two years post-transaction. Table 2 reports summary statistics on matched targets for our
three analysis samples.
7
We arrive at this inference by summing the employment percentages of matched targets from 1998 to 2005, dividing the sum by 0.7 to account for unmatched targets, and making the assumption (supported by other data sources) that private equity activity continued at record levels in 2006 and the first half of 2007.
4. Empirical Methods
This section describes key methodological choices in our empirical study. The first
relates to the unit of analysis. Section 5 considers establishments owned by a target firm in the
year of a private equity transaction. We track these units over time, irrespective of their
ownership in earlier or later years. For example, if the target firm goes public or sells an
establishment, we continue to track that establishment and associate it with the transaction event.
Section 6 takes a different approach, treating the firm as the unit of analysis. The firm-level
approach allows us to capture greenfield job creation and the acquisition and sale of
establishments after the private equity transaction.
The second key choice relates to controls. We need suitable controls because the
distribution of private equity transactions across industries and by firm and establishment
characteristics is not random. For example, practitioner accounts often suggest a concentration of
transactions in industries undergoing significant restructurings due to regulatory action, foreign
competition, or technological change. Target firms in our data are disproportionately
concentrated in manufacturing, information services, and accommodation and food services, as
seen in Figures 3A and 3B. Target firms are also larger and older than the average firm, as
shown in Figure 4. The literature on firm dynamics concludes that growth and volatility vary
systematically with firm size and age. See, for example, Caves (1998), Davis et al. (2007), and
Haltiwanger, Jarmin and Miranda (2010). Thus, it is important to control for these
characteristics when evaluating the effect of private equity transactions on growth and
reallocation outcomes.
The huge number of firms and establishments in the LBD allows us to control for a full
target firms into cells defined by the cross product of these characteristics.8 We then identify all
firms in the LBD not backed by private equity that fall into the same cell as a given target firm,
and we treat those firms as controls. Specifically, we control for the interaction of 72 two-digit
industries, 10 firm size categories, 6 firm age categories, a binary indicator for firms with
multiple establishments, and 24 distinct transaction years. The cross product of these categorical
variables yields over 8,000 control cells per year. Of course, many cells are unpopulated, but the
richness of our controls is evident. In our regression analysis, we also control for pre-transaction
employment growth histories. We follow the same approach in the establishment-level analysis.
To obtain controls for a given target establishment, we select all establishments in the same
control cell from among the set of active establishments in the transaction year, excluding
establishments owned by a firm under private equity control.
A related choice involves our statistical approach to estimating the effects of private
equity transactions on employment outcomes. We consider nonparametric comparisons that
control for the cross-product of our categorical variables, semi-parametric regressions that
include additional controls, and propensity score methods. Ideally, we would like to estimate
the average treatment effect on the treated, i.e., the average effect of private equity buyouts on
target firms. As discussed in Woolridge (2002, chapter 18), consistent estimation of average
treatment effects requires conditional mean independence: conditional on the controls and the
treatment indicator, outcomes for the treated and non-treated are independently distributed.
Compared to previous research, our rich set of controls lends greater plausibility to this
identifying assumption.
8
We define industry for multi-unit firms based on the modal industry of their establishments, computed on an employment-weighted basis.
Even if one questions the assumption of conditional mean independence, our study yields
a rich set of new findings about employment outcomes at private equity targets. These findings
throw light on alternative views about the economic role of private equity, as we discuss below.
Our findings also provide useful evidence for formulating and evaluating theoretical models of
private equity behavior and effects.
A fourth choice relates to the time window around private equity transactions. Our
establishment-level analysis considers employment outcomes for five years on either side of a
private equity transaction. Five years is a typical holding period for target firms (Stromberg
2007). For our firm-level analysis, we must confront the reorganization of firms through
mergers, ownership changes, partial divestitures, and acquisitions of establishments from other
firms. Because it tracks both firms and establishments over time and contemporaneously links
establishments to firms, the LBD offers greater scope for identifying these changes than most
other business-level datasets. Nevertheless, some private equity targets undergo complex
post-buyout restructurings that challenge the maintenance of high-integrity longitudinal links. We
deal with this challenge in two ways. First, our firm-level analysis considers a relatively short
window of two years after each buyout transaction, thereby limiting the linkage issues that arise
from complex firm-level reorganizations. Second, we use our establishment-level data to assess
the impact of potential sample selection bias in our firm-level analysis.
Before proceeding, we define our employment and growth rate measures. Let be
employment at establishment or firm i in year t; i.e., the number of workers on the payroll in the
pay period covering March 12. The employment growth rate is , where it E it it it it E E X g =( − −1)/
.9 The employment growth rate at any higher level of aggregation is the
weighted mean of establishment or firm growth rates given by , where
. We consider the respective contributions of expanding and shrinking
establishments, establishment entry and exit, and acquisitions and divestitures to firm-level
employment changes, and compare outcomes between targets and controls on each of these
adjustment margins.
5. Establishment-Level Analysis
A. Nonparametric comparisons
We begin with an “event study” that compares outcomes at target establishments to
outcomes at control establishments. To encompass a five-year window before and after buyout
years, we consider transactions in the 1980-2000 period. As discussed above, we construct
control cells as the cross product of industry, size of parent firm, age of parent firm, multi-unit
status, and transaction year. Our firm size categories are 1-4, 5-9, 10-19, 20-49, 50-99, 100-249,
250-499, 500-999, 1000-2499, 2500-4999, 5000-9999, and 10000 or more employees. Our firm
age categories are 0-5 years, 6-10, 11-15, 16-20, and 21 or more years.10 We use firm size and
age measures to facilitate comparisons to our firm-level analysis below. Replacing firm size and
age measures with establishment measures yields similar results.
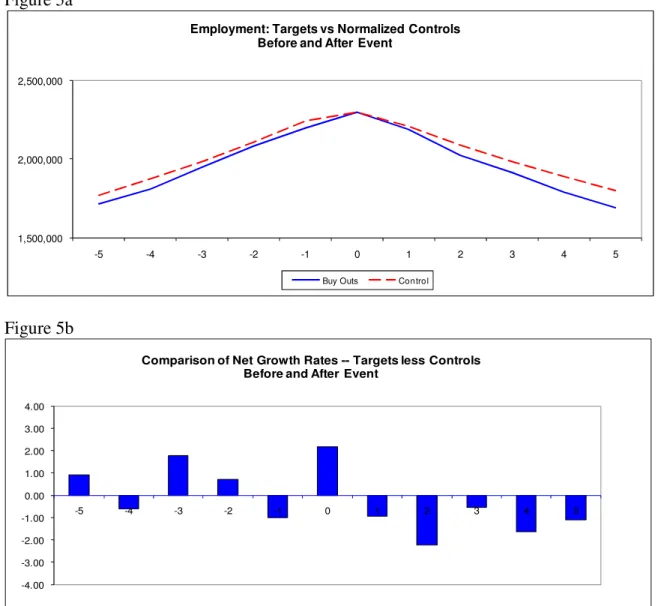
The solid curve in Figure 5a shows the employment path of target establishments around
the transaction year. Establishments that came under private equity ownership between 1980 and
2000 employed 2.3 million workers as of the transaction year. The dashed curve shows the
9
This growth rate measure has become standard in analyses of establishment and firm dynamics, because it shares some useful properties of log differences while also accommodating entry and exit. See Davis et al. (1996) and Tornqvist, Vartia, and Vartia (1985) for discussion.
10
Following Davis et. al. (2009), when a firm first appears in the LBD, we assign it the age of its oldest establishment. We then increment the firm’s age by one year for each year it continues as a legal entity in the LBD. In this way, we avoid arbitrary increases or decreases in firm age due to the sale and purchase of establishments.
) ( * 5 . + −1 = it it it E E X it t i it t X X g g =
∑
( / )∑
= i it t X Xcounterfactual path of employment at targets had they grown at the same rate as controls. To
construct this counterfactual, we first rescale the employment of controls to match that of targets
cell by cell in the transaction year. We then apply the actual growth rates of the controls to
generate the dashed curve.11 Comparing the solid and dashed curves highlights the critical need
to evaluate target outcomes relative to controls. In particular, a simple difference-in-difference
analysis of target outcomes before and after transaction years would produce a highly misleading
impression about the employment effects of private equity buyouts.
Figure 5b tracks mean employment growth rate differences between target and control
establishments from 5 years before to 5 years after the transaction year. Perhaps surprisingly,
Figure 5b shows no systematic pattern of slower job growth at targets in the years leading up to
buyout transactions. In the transaction year itself, employment growth at targets is actually 2
percentage points higher than at controls. However, there is a clear pattern of slower growth at
targets post buyout, with growth differentials ranging from 0.5% to 2% per year. These
differentials cumulate to 3.2% of employment in the first two years post buyout and 6.4% over
five years. These results accommodate heterogeneous treatment effects over the cross product of
industry, firm size, firm age, multi-unit status, and year of transaction. They recover the average
treatment effect on the treated under the assumption of conditional mean independence, as we
discussed above.
Previous research finds very large gross job flows relative to net employment changes
(Davis and Haltiwanger, 1999), raising the question of how employment responds to private
equity transactions on job creation and destruction margins. Figure 6 tells an important story in
this regard: Slower employment growth at private equity targets post buyout entirely reflects a
greater pace of job destruction. Indeed, gross job creation rates are greater at target
establishments in the wake of buyouts. These results are interesting for at least two reasons.
First, they indicate that private equity buyouts accelerate the pace of employment change on
destruction and creation margins, a theme we return to below. Second, Figure 6b confirms that
jobs at target establishments are at greater risk post buyout than jobs at controls. As seen in
Figure 7, about half of this greater risk reflects a higher post-buyout shutdown propensity at
target establishments.
B. Regression Analysis
We turn now to a regression analysis that allows for additional controls and an easy
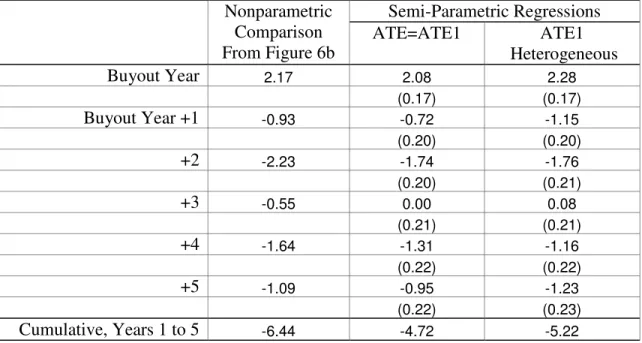
calculation of standard errors in the estimated effects of private equity transactions. Table 3
reports establishment-level regression results for the transaction year and five subsequent years.
Each regression involves the matched target establishments in transactions from 1980 to 2000
and their corresponding control establishments. The dependent variable is the employment
growth rate in the indicated year following the buyout. The first column in Table 3 reports the
mean growth rate differentials from Figure 5b. The second and third columns report results for
semi-parametric regressions that include controls for the pre-buyout growth history of parent and
target firms.
We include two variables to control for pre-buyout history. One variable considers the
set of establishments owned by the target firm as of year 0 (the transaction year). We set the
value of this variable to the employment growth rate of these establishments from year -3 to year
-1. A second variable considers the parent firm that owned these establishments in year -3. If
ownership was split across multiple firms in year -3, we select the firm with the largest share of
growth rate of that firm from year -3 to year -1. Often, but not always, these two control
variables take on the same value.
The Table 3 regressions contain a large battery of additional controls. The column headed
“ATE=ATE1” includes a fully interacted set of controls for two-digit industry, firm size, firm
age, multi-unit status, and year. This specification posits a common treatment effect, given by
the coefficient on an indicator variable for target establishments in private equity transactions.
The column headed “ATE1 Heterogeneous” includes the same set of controls, but relaxes the
assumption of uniform treatment effects by interacting the private equity indicator with the 6
firm age categories, 10 firm size categories, and the two measures of pre-buyout growth history.
This specification is more restrictive than the nonparametric specification in some respects but
less restrictive in the inclusion of controls for pre-buyout growth history and in allowing the
treatment effect to vary with pre-buyout employment growth. To recover the average treatment
effect on the treated in this case, we compute a weighted average of the heterogeneous estimated
treatment effects, using cell-level employment weights of targets in the transaction year. We
calculate standard errors by the Delta method.
As seen in Table 3, the nonparametric and semi-parametric specifications deliver similar
results. The two semi-parametric regressions also yield small standard errors and tightly
estimated effects of private equity transactions. Five-year cumulative employment losses at
targets range from -4.7% to -6.4%, depending on specification, with somewhat smaller losses in
the semi-parametric specifications.12 In short, the evidence says that private equity buyouts lead
to deeper job losses at establishments in operation as of the transaction year.
12
Smaller losses in the semi-parametric specifications point to a modest tendency for private equity to target firms with weaker employment growth prospects, which differs somewhat from the inference suggested by the pre-buyout
6. Firm-Level Analysis
A. Tracking Firms
Section 5 considers outcomes for establishments owned by target firms at the time of the
deal. We now shift to a firm-level analysis to capture new establishments opened after the deal
as well as post-buyout acquisitions and divestitures. By necessity, we restrict attention to target
firms that we can track post buyout. While we can readily track establishments over time in the
LBD, tracking firms is more challenging for two reasons: the disappearance of firm identifiers
(IDs) in some circumstances, and irregularities in Census Bureau tracking of private equity
targets involved in divisional sales.
The disappearance of a firm identifier (ID) in the LBD can occur for various reasons. One
is the death of a firm and closure of its establishments. Firm death in this sense presents no
problem for our analysis, and we capture such events whether they involve target or control
firms. A more difficult situation involves a firm ID in year 0 that disappears in later years, even
though some of the establishments owned by the firm continue to operate. This situation can
arise because of a merger or complex reorganization (e.g. different components of the original
firm are bought by multiple existing firms). It is inherently difficult to define and measure firm
growth when the original legal entity has ceased to exist, and we exclude these observations in
our firm-level analysis. To reduce the number of observations lost for this reason, we limit our
firm-level analysis to years 1 and 2 after the transaction.
In the course of our data development and analysis, we discovered that the Census
Bureau did not accurately track firm IDs in certain private equity transactions. Inaccuracies
sometimes occurred when a private equity group acquired one or more divisions of a corporate
entity, but not the whole firm. In principle, the Census Bureau’s Annual Company Organization
divisional sales. However, we identified divisional sales in which the firm ID of the (new) target
firm remained the same as the ID of the selling firm. This problem did not affect the
establishment-level analysis in Section 5, because we could rely on an alternative identifier – the
Employer Identification Number (EIN) – to accurately identify, as of the transaction year,
establishments involved in divisional sales. Unfortunately, EINs are unsuitable for tracking
firms post buyout because new and acquired establishments may obtain new EINs. In light of
this issue, we exclude divisional cases from our firm-level analysis for those cases when Census
does not provide an accurate ID for the target firm.
We more fully discuss tracking issues related to divisional sales and our use of EINs in
the web appendix. The web appendix also repeats the establishment-level analysis of Section 5
excluding establishments owned by divisional targets with inaccurate IDs. The pattern of results
for this subsample is quite similar to the results in Section 5, although the subsample yields
somewhat smaller employment losses at targets relative to controls. The similarity of the
establishment-based results for the full sample and the subsample suggests that our firm-level
analysis is not seriously distorted by the inability to accurately track firm IDs for some divisional
sales.
For the firm-level analysis, we expand the sample period to run through 2003.13 Table 2
reports summary statistics for various firm-level samples. Our full matched sample contains
2265 target firms from 1980 to 2003. They account for about 4.3 million workers and 104,000
establishments as of the transaction year. Excluding the divisional, EIN cases that lack accurate
firm IDs yields 1874 target firms with about 3.4 million workers and 79,000 establishments.14
13
A firm-level analysis for the period from 1980 to 2000 yields similar results. 14
Further restricting attention to firms that we can track for two years after the buyout year,
including deaths, yields a sample of 1,374 firms and 3.2 million workers. This sample represents
73 percent of the matched sample with accurate firm IDs and 93 percent of their employment.
The latter statistic is more relevant given our focus on employment-weighted outcomes.
B. Firm-level Results
Our firm-level analysis considers the same type of semi-parametric regression
specifications as in Table 3. Now, however, we explore employment responses on several
adjustment margins, including the entry of new establishments post buyout. As before, the
regressions include the pre-buyout growth variables and the cross product of industry, firm size
categories, firm age categories, multi-unit status, and transaction year as controls. We weight
observations by employment, as before. To obtain the effect of interest, we rely on indicator
variables for target firms. Table 4 presents the firm-level regression results for cumulative
responses over the first two years post buyout.
The top row in Table 4 shows results using firm-level employment growth rates as the
dependent variable. Again, we report results for an ATE=ATE1 specification that posits a
uniform treatment effect, and for an ATE1 Heterogeneous specification that allows treatment
effects to vary with pre-buyout history and across firm age and size categories. The top row in
Table 4 says that target firms shrink more rapidly than controls in the two-year period after
buyouts – by 0.88 percentage points in the ATE=ATE1 specification and 0.65 percentage points
in the ATE1 Heterogeneous specification. These estimated effects are much smaller than the
cumulative two-year differences of 2.5 and 2.9 points, respectively, in Table 3. This comparison
suggests that the additional adjustment margins captured by the firm-level analysis alters the
The remaining rows in Table 4 address the issue directly in the firm-level sample. Focus
on the ATE1 Heterogeneous specification, and consider first the results for “Continuers” and
“Deaths”. These are the adjustment margins captured in the establishment-level analysis.15
Summing these two components yields a two-year employment growth rate differential of -5.49
percentage points (-1.36 – 4.13) for targets, a large difference. But target firms create more new
jobs at new establishments in the first two years after buyouts, a difference of 1.87 points in
favor of targets. Combining these three adjustment margins yields a differential of -3.62
percentage points for targets. Finally, bringing in the role of acquisitions and divestitures
reduces this differential to -0.81 points, close to the estimated differential in the top row.16
Thus, the overall impact of private equity transactions on firm-level employment growth is quite
modest.
Another noteworthy aspect of Table 4 involves the intensity of reallocation activity at
target firms. In particular, target firms exhibit substantially greater job destruction in
establishment shutdowns, more job creation at establishment births, more employment losses
through divestitures, and greater employment gains through acquisitions. In other words, target
firms undergo more job reallocation activity post buyout than control firms. These results
support the view that private equity is a catalyst for creative destruction as measured by job
creation and destruction and the purchase and sale of business units. We develop this theme
more fully in the next section.
As a robustness check, we also estimate the average treatment effect of private equity
buyouts on firm-level employment growth using propensity score methods. We construct
propensity scores by fitting logit specifications, one for each transaction year, for the likelihood
15
that a firm becomes a private equity target. The logit specification includes the pre-buyout
growth variables and the cross product of industry, firm size categories, firm age categories, and
multi-unit status. Our second-stage regression includes an indicator for private equity targets, as
before, plus the propensity score measure interacted with year effects. Using this second-stage
regression, we estimate that a private equity buyout raises firm-level employment growth by
0.26 percentage points in the first two years post buyout, with a standard error of 0.18 points.17
Thus, under the propensity score approach, we cannot reject the hypothesis that private equity
transactions have zero net impact on employment growth at target firms.
To conclude this section, it is worth stressing that our firm-level and establishment-level
regression analyses answer different questions. The establishment-level analysis tells us what
happens to employment at establishments owned by target firms as of the transaction year. The
firm-level analysis tells us what happens to employment at target firms, overall and on various
adjustment margins. In practice, the main difference is that the firm-level analysis picks up large
differentials between targets and controls in job creation at newly opened establishments and in
employment changes associated with acquisitions and divestitures. More subtle differences are
also present. Consider, for example, a target establishment sold to another firm one year after
the buyout transaction. Employment changes at this firm from year 1 to year 2 are captured in
the establishment-level analysis but not the firm-level analysis.
7. Private Equity: Agents of Change or Agents of Restructuring?
Table 4 and Figure 6 provide evidence that private equity transactions function as
catalysts for creative destruction. This evidence is consistent with two distinct hypotheses. One
17
The standard errors are not adjusted for the first-stage estimation. As Woolridge (2002) notes, an advantage of including controls directly in the main regression is that it simplifies the computation of standard errors. He also points out that propensity score methods often yield similar results to methods that use controls in the main regression. When estimated with a linear probability model, a propensity score approach is equivalent to a one-stage approach that introduces the controls directly into the main regression.
hypothesis holds that private equity acts as an agent of change – inducing some target firms to
expand relative to controls and others to retrench. According to this hypothesis, our earlier
evidence reflects a combination of (a) upsizing target firms that add establishments and jobs
more rapidly than controls and (b) downsizing target firms that shed jobs and establishments
more rapidly than controls. The positive effects of buyouts on creation, destruction, acquisitions,
and divestitures then result by aggregating over upsizing and downsize cases. An alternative
hypothesis holds that private equity acts as an agent of restructuring within target firms,
accelerating the reallocation of jobs across establishments of target firms and the pace of their
divestitures and acquisitions. According to this hypothesis, the positive effects of buyouts on
gross job flows, acquisitions, and divestitures occur within target firms. These hypotheses are not
exclusive because private equity may accelerate both types of creative destruction.
To investigate these hypotheses, we estimate the impact of private equity transactions on
various firm-level measures of reallocation activity in the wake of buyouts. The overall job
reallocation rate for a firm is the sum of its gross job gains due to new, expanding, and acquired
establishments and its gross job losses due to exiting, shrinking, and divested establishments. A
firm’s excess reallocation rate is the difference between its job reallocation rate and the absolute
value of its net growth rate.18 If a given firm changes employment in the same direction at all of
its establishments, then its excess reallocation is zero. To the extent that a firm expands
employment at some units and contracts employment at others, it has positive excess
reallocation. If the firm adds jobs at some of its establishments and cuts an equal number of jobs
at other establishments, then excess reallocation equals job reallocation.
18
By estimating the impact of private equity transactions on excess and job reallocation
rates at target firms (relative to controls), we can quantify the extent to which private equity acts
as an agent of change or an agent of restructuring. For example, if private equity acts exclusively
as an agent of change, then the entire creative destruction response of target firms involves
higher job reallocation but no impact on firm-level excess reallocation. At the other extreme, if
private equity acts exclusively as agents of restructuring within target firms, then firm-level job
reallocation and excess reallocation rates respond by the same amount to private equity
transactions.
Table 5 reports regression results for firm-level job reallocation and excess reallocation
rates using the same specifications and two-year horizon as in Table 4. In the ATE1
Heterogeneous specification, the reallocation rate is 5.0 percentage points higher at targets for
organic employment changes and 13.3 points higher when including acquisitions and
divestitures. These results confirm our previous inference that private equity transactions
substantially accelerate the pace of creative destruction activity at target firms. The excess
reallocation rate is 5.6 points higher at target firms for organic changes, 8.8 points higher with
acquisitions and divestitures. The implication is that the increase in job reallocation induced by
buyout transactions mainly involves an accelerated pace of restructuring within target firms. For
organic changes, the impact of buyouts on excess reallocation is actually greater than the impact
on job reallocation.19 Thus, especially for organic employment changes, our evidence implies
that private equity acts predominantly as an agent of restructuring within target firms.
A limitation of the regression estimates in Tables 3, 4, and 5 is that they identify only the
differences between targets and controls. To recover information about the levels of creation and
19
By definition, overall job reallocation equals or exceeds job reallocation for a given firm or group of firms. Our comparison here, however, involves the difference between job reallocation and excess reallocation responses for two distinct sets of firms, targets and controls.
destruction activity, we return to the nonparametric approach of section 5 and consider a
counterfactual exercise along the lines of Figure 5. Specifically, we sort target and control
observations in our 1980-2003 firm-level analysis sample into cells defined by the same cross
product of industry, size, age, multi-unit status, and transaction year as before. For each cell, we
calculate cumulative two-year changes post buyout for each employment adjustment margin.
We do this separately for targets and controls. We then generate the weighted average outcomes
for targets and controls using the same approach to weighting as in Figure 5. These calculations
reveal the extent of creation and destruction activity on each adjustment margin at target firms,
and they tell us how target firm activity would differ if they exhibited the same behavior as
controls.
We report the results of these calculations in Table 6. They show high rates of creation
and destruction at target firms in the wake of private equity transactions. The two-year
cumulative job reallocation at target firms is 39 percent of employment for organic changes
(Panel A) and 57 percent with acquisitions and divestitures (Panel B). The large role of
establishment entry and exit at targets is especially striking. Greenfield entry accounts for 72
percent of organic job creation at target firms, and establishment closures account for 66 percent
of organic job destruction. The pace of job creation and destruction due to establishment births
and deaths is considerably slower at control firms.
According to the “Difference” column in Panel A of Table 6, buyouts raise job creation,
destruction and reallocation rates by, respectively, 1.8, 3.9 and 5.8 percent of transaction-year
employment, which amount to 11, 20 and 17 percent of the base rates at control firms. Panel B
shows that the increases in creation, destruction, and reallocation associated with buyouts are
restructuring on every adjustment margin we measure. To check the consistency of these results
with the semi-parametric regressions in Tables 4 and 5, the two rightmost columns in Panels A
and B report the regression estimates of target-control differences. The two approaches yield
very similar differences, and the differences are precisely estimated.
Panel C summarizes the information in a different way by decomposing job reallocation
separately for targets and controls. The two-year job reallocation rate is 57 percent at targets and
43 percent at controls. Organic components account for about 70 percent of job reallocation at
targets and a larger percent at controls. Moreover, the organic component of within-firm excess
reallocation accounts for a large share (about 35 percent) at both sets of firms. Acquisitions and
divestitures account for a larger share of job reallocation at targets.
8. Differential Responses by Period, Industry and Target Type
Thus far, we have characterized responses to private equity transactions for the private
sector as a whole, and obtained similar results whether we posit uniform or heterogeneous
treatment effects. Nevertheless, our earlier analysis may obscure important differences in
responses to private equity buyouts by time period, industry, or type of transaction. We now
investigate these differences, drawing on previous accounts and research for inspiration as to
where there might be important differences.
Descriptive accounts suggest that private equity groups shifted to a more operational
orientation over time, which could lead to time-varying responses at targets. The scale of private
equity buyout activity also increased enormously over time, which could alter the character of
the marginal target and its post-buyout performance. Motivated by these observations, in the
web appendix we analyze the mean growth rate differences between private equity targets and
control establishments for three periods. The findings (see Figure B.2 of the web appendix)
1990-94 period, and the 1995-2000 period. In each period, employment contracts more rapidly at
targets than at controls in the years following buyout transactions.
Some accounts of private equity buyouts paint a picture of aggressive cost cutting
through layoffs. This characterization suggests the potential for bigger job destruction responses
to private equity buyouts in labor-intensive industries, reflecting the view that aggressive cost
cutters focus on the biggest cost sources. More generally, there are major differences in factor
input shares, market structure, demand conditions, and labor relations across industries that
might lead to important differences in the responses to private equity buyouts. Motivated by
these ideas, Figure 9 displays results for three broad industry sectors that cover most private
equity transactions. Employment falls modestly at target establishments relative to controls post
buyout in manufacturing. Accounting for transaction-year outcomes as well, there is no material
cumulative jobs effect of buyout transactions in the manufacturing sector. Retail Trade exhibits
a markedly different response pattern. In the years leading up to buyout transactions, controls
and targets in the Retail Trade sector exhibit similar employment growth rates. Post buyout,
however, employment at target establishments falls by nearly 12 percent relative to controls over
five years. The Service sector exhibits yet a different pattern. Targets grow much rapidly than
controls prior to the transaction year but somewhat more slowly afterwards. Figure 9 serves as a
caution against painting with an overly broad brush when characterizing employment outcomes
in the wake of private equity buyouts.
There are also good reasons to think that employment responses vary by type of
transaction. For example, a desire to ease capital constraints and improve funding access may be
more prevalent among independent firms that are privately held before the buyout.
poor execution in to-private deals. Kaplan and Stromberg (2009) stress that large
public-to-private deals are concentrated at market peaks, where high valuations and extreme leverage
levels are commonplace, and these transactions seem to encounter a disproportionate share of
difficulties. For instance, Andrade and Kaplan (1998) find that 23% of larger public-to-private
transactions in the 1980s defaulted at some point. Guo et al. (2011) find weak operating
performance in a sample of public-to-private transactions undertaken in the first half of the
2000s.
Motivated by these arguments, Table 7 reports the estimated effects of buyouts by type of
private equity transaction based on our ATE1 Heterogeneous regression specification. We report
results for the response of the firm-level employment growth rate and the response on each
adjustment margin. Each coefficient in Table 7 corresponds to the estimated average treatment
effect on the treated in the indicated regression. As in the earlier firm-level results, we focus on
changes over a two-year horizon post buyout.
Inspecting the top row in Table 7, employment growth rate responses differ greatly by
type of private equity transaction. In public-to-private transactions, target employment contracts
by more than 10 percent relative to controls over two years. Target firms in public-to-private
transactions experience substantially greater job losses due to establishment deaths and
divestitures. They also experience less job creation through establishment births. Along with the
high visibility of public-to-private deals, these results help to understand concerns about job loss
related to private equity buyouts.
In striking contrast, employment at independent targets (also known as private-to-private
deals) grows 10 percent relative to controls in the first two years post buyout. More rapid
employment growth at independent targets reflects a higher pace of acquisition, consistent with