MapWindow GIS ActiveX Control
Sample Project: Data Visualization Tool
A step-by-step guide to creating a custom GIS-aware applicationwith the MapWindow GIS ActiveX Control by Christopher Michaelis
Introduction
Often, a full geographic information system is not needed for a given application or task. In these cases, it is immensely useful to build a custom application from the ground up. Adding GIS capabilities to a custom application is typically slow and difficult; in this guide you will use the MapWinGIS ActiveX Control to vastly simplify this goal, easily and quickly adding GIS functionality to a custom program.
The tool developed here is a simple data visualization tool, allowing the user to view ESRI Shapefiles and most raster data formats including ECW, Mr. SID, GeoTIFF, ASCII, ArcGrid and many other raster files.
A more advanced demonstration application, the Hike Difficulty Analysis Tool, continues the concepts demonstrated here. This project is written using Microsoft Visual Basic 2005 Express edition, and may be downloaded here:
http://www.mapwindow.org/download.php?show_details=24
Please follow the steps below to create the basic data viewer application.
Step 1:
Create a new VB.Net project using Microsoft Visual Studio.
Step 2:
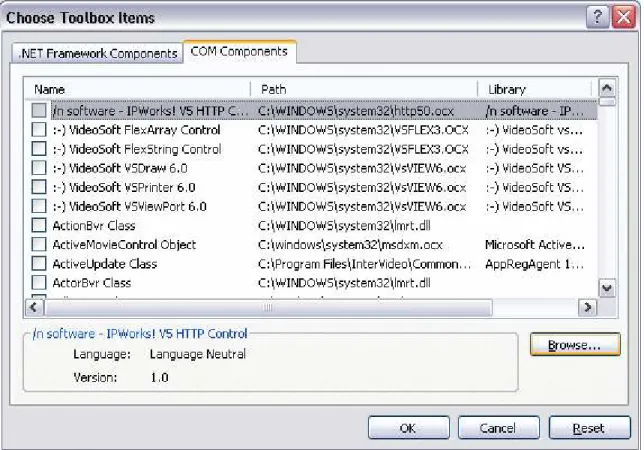
Right-click in the Toolbox window and select Choose Items… (Visual Studio 2005) or Add Control (Visual Studio 2002-2003). Select the “COM Components” tab. Browse to the location of the MapWindow GIS ActiveX control, typically:
C:\Program Files\MapWindow\MapWinGIS.ocx This window is shown in figure 1:
Figure 1: Adding the Map Control to the toolbox.
Step 3:
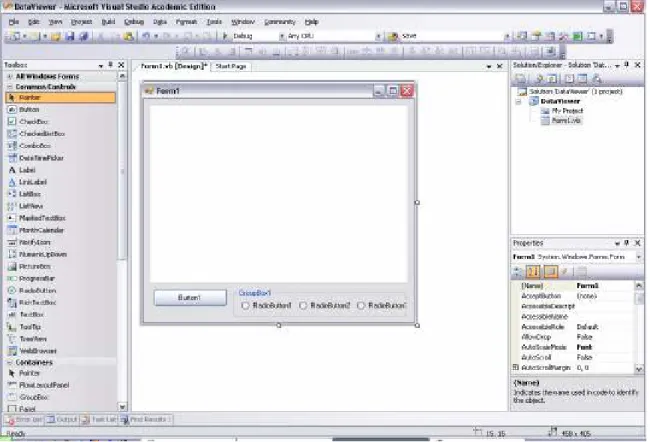
Notice that Map Control has now been added to the list of tools that you may use. Select this tool, and click in the default form that was created when your project was created. Use the mouse to drag the corner, resizing it as desired.
Also add a button and a groupbox, and three radio buttons inside of the groupbox, as shown in figure 2:
Figure 2: Form with button and radio button controls.
Step 4:
Change the names of the map, buttons and radio button. Change the text of the button and radio buttons.
Map (Defaults to AxMap1):
Change name to “Map” or any name you prefer. Button1:
Change text to “Add Data…”.
Change name to “btnAddData” or any name you prefer. RadioButton1:
Change text to “Zoom In”.
Change name to “rdZoomIn” or any name you prefer. RadioButton2:
Change text to “Zoom Out”.
Change name to “rdZoomOut” or any name you prefer. RadioButton3:
Change name to “rdPan” or any name you prefer.
Step 5:
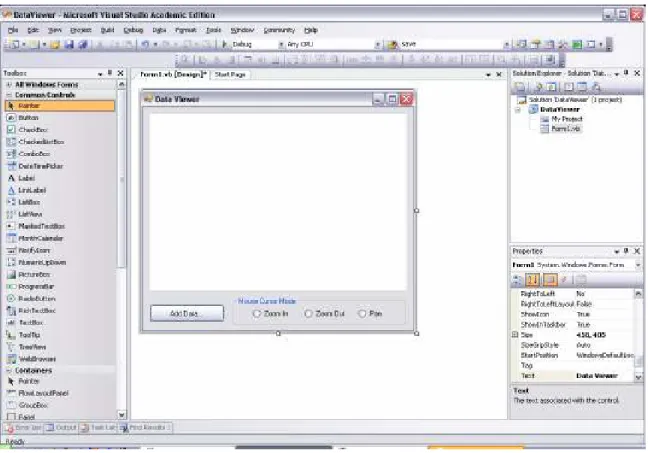
Change the text of the group box to “Mouse Cursor Mode” or any text you prefer. Change the text of the form to “Data Viewer” or any preferred text.
Set the anchor for the groupbox and the button to “Left” and “Bottom”. Set the anchor for the main map to “Left”, “Right”, “Top” and “Bottom”. This will make it so that the map size will expand when the window is resized.
Figure 3: Properly named form controls.
Step 6:
Set the Checked property of the Zoom In radio button to true. This is because the default cursor mode for the map is to zoom in.
Double-click the Add Data button. This will take you into the source code view. Add the code beginning on the next page to the “btnAddData_Click” subroutine.
The code listing looks daunting at first; however, this code provides access to every file format that the MapWinGIS ActiveX control supports. Supporting only a shapefile or only a grid would be a substantially shorter code listing.
'Create instances of the possible data objects,
'to retrieve the dialog filters of supported formats.
Dim sf As New MapWinGIS.Shapefile Dim grd As New MapWinGIS.Grid Dim img As New MapWinGIS.Image
'We want users to be able to open any file type.
'Merge the dialog filters by placing a pipe character
'in between each:
Dim dlg As New OpenFileDialog
dlg.Filter = "All Files (*.*)|*.*|" & sf.CdlgFilter & _ "|" & grd.CdlgFilter & "|" & img.CdlgFilter If dlg.ShowDialog() = Windows.Forms.DialogResult.OK Then
'If the user didn't cancel the dialog, try to open the file.
'First, determine what kind it was:
Dim extension As String = _
IO.Path.GetExtension(dlg.FileName).ToLower() If sf.CdlgFilter.ToLower().Contains(extension) Then
'It's a shapefile
sf.Open(dlg.FileName) Map.AddLayer(sf, True) 'Zoom to all visible layers
Map.ZoomToMaxExtents() Return 'Done
ElseIf grd.CdlgFilter.ToLower().Contains(extension) Then
'NOTE: a .tif can be a GeoTIFF (a grid)
'or an image. Check this, if the file
'is a tif:
If dlg.FileName.ToLower().EndsWith("tif") Then
If Not Map.IsTIFFGrid(dlg.FileName) Then
'It's an image, not a grid.
'Open it as an image.
img.Open(dlg.FileName) Map.AddLayer(img, True) 'Zoom to all visible layers
Map.ZoomToMaxExtents() Return 'Done
End If
End If
'Open the grid:
grd.Open(dlg.FileName)
'Define a coloring scheme to color this grid:
Dim sch As New MapWinGIS.GridColorScheme
'Use a predefined coloring scheme "Fall Leaves"
sch.UsePredefined(grd.Minimum, grd.Maximum, _
MapWinGIS.PredefinedColorScheme.FallLeaves) 'Convert it to an image that can be displayed:
Dim gridimage As MapWinGIS.Image gridimage = u.GridToImage(grd, sch) 'Add the generated image to the map:
Map.AddLayer(gridimage, True) 'Zoom to all visible layers
Map.ZoomToMaxExtents() Return 'Done
ElseIf img.CdlgFilter.ToLower().Contains(extension) Then
'It's a plain image
img.Open(dlg.FileName) Map.AddLayer(img, True) 'Zoom to all visible layers
Map.ZoomToMaxExtents() Return 'Done
End If
End If
Step 7:
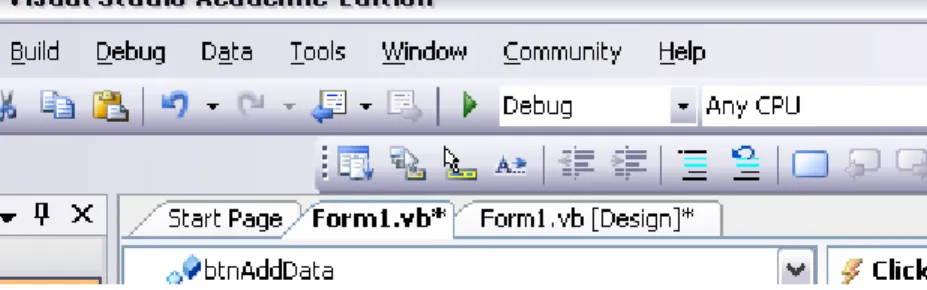
Press the “Play” button on the toolbar (figure 4) to start the program.
Figure 4: The green "Play" button to begin running the application.
Click on your “Add Data” button, and select any common GIS data format file. You may also click the “Files of Type” drop down to see what formats are supported (figure 5):
Figure 5: The Add Data... button.
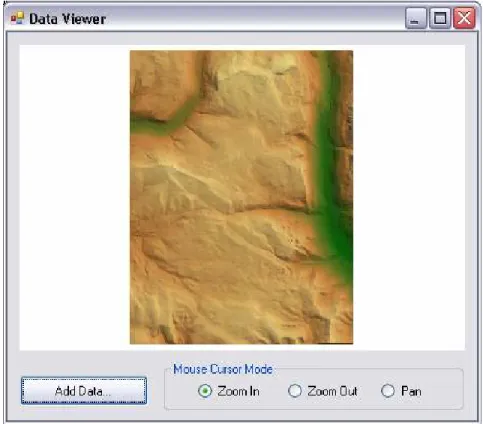
You will now see your data in the map (figure 6):
Step 8:
Double-click on the Zoom In radio button. Add the following code:
Map.CursorMode = MapWinGIS.tkCursorMode.cmZoomIn
Double-click on the Zoom Out radio button. Add the following code:
Map.CursorMode = MapWinGIS.tkCursorMode.cmZoomOut
Double-click on the Pan radio button. Add the following code:
Map.CursorMode = MapWinGIS.tkCursorMode.cmPan
Step 9:
Click the Play button once again to run the program. Your viewer can now zoom in, zoom out, and pan – as well as support a large number of data formats.
Additional Information:
For a much more detailed demonstration, please visit: