Scholarship Archive
Scholarship Archive
Faculty Scholarship Faculty Publications
2009
Creditor Control and Conflict in Chapter 11
Creditor Control and Conflict in Chapter 11
Kenneth M. Ayotte Edward R. Morrison
Columbia Law School, emorri@law.columbia.edu
Follow this and additional works at: https://scholarship.law.columbia.edu/faculty_scholarship Part of the Banking and Finance Law Commons, Bankruptcy Law Commons, and the Business Organizations Law Commons
Recommended Citation Recommended Citation
Kenneth M. Ayotte & Edward R. Morrison, Creditor Control and Conflict in Chapter 11, 1 J. LEGAL ANALYSIS 511 (2009).
Available at: https://scholarship.law.columbia.edu/faculty_scholarship/509
This Article is brought to you for free and open access by the Faculty Publications at Scholarship Archive. It has been accepted for inclusion in Faculty Scholarship by an authorized administrator of Scholarship Archive. For more information, please contact cls2184@columbia.edu.
CREDITOR CONTROL AND CONFLICT IN
CHAPTER 11
Kenneth M. Ayotte and Edward R. Morrison'
ABSTRACT
We analyze a sample of large privately and publicly held businesses that filed Chapter 11 bankruptcy petitions during 2001. We find pervasive creditor control. In contrast to traditional views of Chapter 11, equity holders and managers exer-cise little or no leverage during the reorganization process. 70 percent of CEOs are replaced in the two years before a bankruptcy filing, and few reorganization plans (at most 12 percent) deviate from the absolute priority rule to distribute value to equity holders. Senior lenders exercise significant control through stringent cov-enants, such as line-item budgets, in loans extended to firms in bankruptcy. Un-secured creditors gain leverage through objections and other court motions. We also find that bargaining between secured and unsecured creditors can distort the reorganization process. A Chapter 11 case is significantly more likely to result in a sale if secured lenders are oversecured, consistent with a secured creditor-driven fire-sale bias. A sale is much less likely when these lenders are undersecured or when the firm has no secured debt at all. Our results suggest that the advent of creditor control has not eliminated the fundamental inefficiency of the bankruptcy process: resource allocation questions (whether to sell or reorganize a firm) are ultimately confounded with distributional questions (how much each creditor will receive) due to conflict among creditor classes.
Two themes dominate traditional accounts of Chapter 11 reorganization. First, managers or equity holders, or both, control the process (Bradley and
Northwestern University School of Law and Columbia Law School, respectively. We received helpful comments from Barry Adler, John Armour, Albert Choi, Jesse Fried, Scott Hemphill, Richard Hynes, Juliet Kostritsky, Robert Rasmussen, James Spindler, and Oren Sussman; from workshop participants at Bonn, Case Western, Chicago, Columbia, DePaul, Northwestern, Oxford, University of Pennsylvania, University of Southern California, University of Virginia, Unversity of Utah, and Yale; and from participants at the following conferences: Conference on Commercial Law Realities (University of Texas), Conference on Empirical Legal Studies (New York University), Triangle Law and Economics Conference (Duke/University of North Carolina), Workshop on Private and Public Resolution of Financial Distress (Vienna Graduate School of Finance), European Summer Symposium in Financial Markets, and Conference on the Changing Nature of Credit Markets (SIFR). We thank Charles Alivosetti, Ariana Cooper, James Judah, Zeev Kirsh, Christopher Mellem, Nathan Rehn, Christina Schutz, Jeong Song, Robert Tennenbaum, and David Zylberberg for superb research assistance.
Rosenzweig 1992; Bebchuk and Chang 1992; Adler 1993; Schwartz 1997). This is made possible by debtor-friendly features of the U.S. Bankruptcy Code and judges who are passive or biased in favor of keeping an existing business intact. Exploiting the court's protection, managers can entrench themselves and equity holders can extract concessions from creditors. As a result, courts may permit reorganizations of firms that should be liquidated. The second theme, usually implicit in the literature, is that creditors act as a unified constituency, usually agitating for quick liquidation. Together, these traditional themes continue to influence the academic literature in many areas related to financial distress.2
A recent wave of literature by academics and practitioners suggests that these themes-at least in large corporate bankruptcies-are outdated (Baird and Rasmussen 2002; Skeel 2003; Warren and Westbrook 2003; Miller and Waisman 2004; Adler, Capkun, and Weiss 2008). During the past decade, creditors with senior, secured claims have come to dominate the Chapter 11 process. Much of this creditor control is exercised through secured lines of credit, which are extended to the firm both before and af-ter it files a bankruptcy petition. As Skeel (2004) and Baird and Rasmussen (2006) have shown, these lines of credit limit the debtor's access to cash and impose strict requirements on business activity. Baird and Rasmussen (2003) argue that, due to this control, we have seen a dramatic increase in the proportion of Chapter 11 cases that result in piece-meal liquidation or a going-concern sale. As LoPucki (2003, 648) has shown, going-concern sales accounted for less than 20 percent of Chapter 11 cases filed by large, publicly traded firms during the 1980s. In 2002, they accounted for about 75 percent of the cases.
In addition to shifting the focus away from equity and managerial control in Chapter 11 bankruptcies, the recent literature also directs attention away from the unified, single-creditor framework. The onset of senior, secured creditor control raises issues of potential creditor conflict between senior and junior classes of debt. As senior lenders have obtained control through pre- and post-petition financing, junior lenders have used claims trad-ing, committees, and other tactics to gain leverage over the reorganization
2 For example, Acharya, John, and Sundaram (2005) compare the "equity-friendly" U.S. system and the "creditor-friendly" U.K. system. Structural models used in bond pricing typically as-sume a single class of debt, with shareholders extracting surplus from the creditor in workouts or in bankruptcy. Examples include Francois and Morellec (2004) and Broadie, Chernov, and Sundaresan (2007).
Summer, 2009: Volume 1, Number 2 - Journal of Legal Analysis - 513
process (Fortgang and Mayer 1990; Tung 1996; Partnoy and Skeel 2007). Junior lender activism has increased as hedge funds and other investors have purchased the claims of bondholders and similarly dispersed credi-tors who, in the past, did not participate actively in the bankruptcy process
(Goldschmid 2005; Fisher and Buck 2007).
Our paper has two objectives. The first is to provide systematic evi-dence on the validity of these new themes-creditor control and creditor conflict-in large, corporate Chapter 11 cases. Existing evidence is largely anecdotal, raising doubts whether a new perspective on the bankruptcy process is necessary. Our second objective is to identify the effects of credi-tor control and conflict on bankruptcy outcomes, such as the decision to reorganize or sell the firm. Prior theoretical literature shows that manager-creditor and equity-manager-creditor conflict can lead to asset misallocation during the reorganization process. We use our database to investigate whether a different kind of conflict-senior creditors versus junior creditors-distorts outcomes in bankruptcy cases. As with most scholarship in this area, how-ever, we focus exclusively on dynamics during the bankruptcy process. We do not analyze creditor and debtor behavior during the months preceding a bankruptcy filing. Because of this, we cannot fully evaluate the efficiency consequences of control and conflict in bankruptcy. Greater creditor con-trol, for example, could affect the behavior of equity holders and managers prior to bankruptcy. Managers might invest in wasteful strategies to delay a filing, as Adler, Capkun, and Weiss (2008) argue.
We investigate creditor control and conflict using a unique database of Chapter 11 filings by large publicly traded and privately held corporations. These data provide strong evidence that the traditional view of Chapter 11 bankruptcy is outdated. We find that 70 percent of CEOs are replaced with-in the two years precedwith-ing the bankruptcy filwith-ing. This represents a sharp increase over comparable figures reported in previous studies and suggests strongly that Chapter 11 does not provide a safe harbor for entrenched managers. Additionally, we find that few reorganization plans (at most 12 percent) deviate from the absolute priority rule by distributing value to equity holders even though creditors have not been paid in full. In at least 82 percent of the cases, equity holders received nothing.
We also find strong evidence that senior creditors obtain substantial control through their loan agreements with distressed debtors. 75 percent of the bankrupt corporations obtained senior secured financing prior to entering bankruptcy. In 97 percent of these cases, the loans were secured by
a lien on all of the corporation's assets. After entering bankruptcy, debtors obtained post-petition financing in 76 percent of the cases, and in 92 per-cent of these cases the loans were secured by liens on all of the firms' assets. More importantly, the vast majority of the loans contained covenants im-posing line-item budgets, profitability targets, or deadlines for submitting a plan of reorganization. The lender was generally free to seize collateral unilaterally-without first seeking court approval-if the corporation vio-lated any of these covenants.
Although senior secured lenders appear to exert significant control through loan documents, we also find evidence of frequent creditor conflict. Junior creditors, acting through a creditors' committee, filed objections in more than 50 percent of the cases. Senior creditors often filed objections as well. In 46 percent of the cases, pre- or post-petition senior creditors ob-jected to actions proposed or taken by the corporations' managers.
Finally, our analysis shows that creditor conflict has an important effect on bankruptcy outcomes. We find a statistically significant, non-monotonic relationship between the ratio of secured debt-to-assets and the resolution of the case. When secured creditors are undersecured (their claims exceed the value of the firms' assets, making them the approximate residual claimants) and when there is no secured debt at all (making the unsecured creditors the approximate residual claimants), the cases are relatively long and more like-ly to result in a traditional reorganization.3 But when secured creditors are oversecured (their claims are worth less than the value of the firms' assets), we expect to see-and do see-a different pattern. In these cases, theory predicts that creditor conflict is likely to be most pronounced. Oversecured creditors will prefer an immediate resolution. Their claims may be paid in full during a quick sale, even if the firm is sold for less than its fundamental value; any delay-especially a lengthy reorganization process-could hurt them if firm value deteriorates over time. Unsecured creditors, on the other hand, will prefer a reorganization if it lengthens the case. If firm value im-proves over time, these creditors keep most of the upside; if value declines, they share any losses with senior creditors. Consistent with this theory, we find that cases are more likely to result in a sale when secured creditors are oversecured than when the firm has no secured debt or has an approximate
3This is consistent with the idea that, in the absence of conflict, creditors value the reorganiza-tion process as a means of alleviating liquidity problems. See Shleifer and Vishny (1992) and
Summer, 2009: Volume 1, Number 2 - Journal of Legal Analysis - 515
residual claimant, such as an undersecured creditor. These results support the hypothesis that senior creditors have substantial power to control bank-ruptcy outcomes and that they exercise this power more vigilantly when de-lay poses a greater risk to the value of their claims.4
Our findings show that creditor conflict distorts economic outcomes in bankruptcy. We cannot, however, evaluate the efficiency loss associated with this conflict. Creditor conflict might yield inefficiently quick sales in some cases and inefficiently slow sales or reorganizations in others.
Our paper is organized as follows. Section 1 reviews the prior literature, Section 2 describes our database, Section 3 presents summary statistics, and Section 4 sets out simple measures of creditor control and conflict. In Section 5, we test the effects of control and conflict on the reorganization process. Section 6 concludes.
1. PRIOR LITERATURE
The general phenomenon of creditor control has been the topic of numerous studies, some of them empirical, such as Gilson and Vetsuypens (1994). The dynamics of creditor conflict have received comparatively less attention.
With respect to creditor control, several papers have documented the fre-quency of in-bankruptcy lines of credit (DIP financing) during the 1990s. In a study of publicly traded firms that entered Chapter 11 proceedings between 1988 and 1997, Dahiya et al. (2003) found DIP financing in 31 per-cent of the cases, rising to 48 perper-cent in the mid- 1990s. In a similar study, Carapeto (2003) observed DIP financing in 41 percent of cases, with a high of 67 percent in 1996.' Both studies found DIP financing more common in cases involving larger firms and in prepackaged cases. A prepackaged case is one in which the debtor secured approval for its reorganization plan from a super-majority of creditors before the firm actually filed its Chapter 11 petition. Dahiya et al. (2003) and Carapeto (2003) also report that, relative to debtors without DIP financing, those with financing had faster cases and were more likely to reorganize or merge with another firm than undergo piecemeal liquidation. Carapeto, however, also found that the probability 4 Previous work in a different institutional setting (Swedish bankruptcy auctions) found a similar non-monotonic pattern, relating the senior debt-to-assets ratio and the probability of liquidation versus a sale-back to management. See Stromberg (2000).
5Other studies include Dhillon, Noe, and Ramirez (1996), Elayan and Meyer (2001), and Chat-terjee, Dhillon, and Ramirez (2004).
of liquidation was higher when the DIP financing gave the lender a security interest that was senior to existing secured debts (a "priming lien").
These papers are important but tell us little about the terms of DIP fi-nancing and why it is an effective tool of creditor control. Carapeto (2003) addresses this issue in part, showing that one characteristic of DIP financ-ing-whether the lender receives a priming lien-has an important effect on outcomes. We do not know, however, whether other characteristics of DIP financing matter as well.6
The closest papers to ours in this respect are contemporaneous work-ing papers by Bharath, Panchapegasan, and Werner (2007) and McGlaun (2007). Bharath, Panchapegasan, and Werner investigate the determinants of absolute priority rule (APR) violations. An APR violation occurs when a reorganization plan distributes value to junior interests even though senior interests have not been paid in full. An APR violation in favor of equity hold-ers can be viewed as evidence of manager or equity holder control. Similar to our study, Bharath, Panchapegasan, and Werner (2007) find that APR violations were less common during the early 2000s than they were during the 1980s. They hypothesize-and present supporting evidence-that APR violations declined during the 1990s and 2000s because creditors exercised greater control, via DIP financing and other tools, during the same period.
McGlaun (2007) uses bankruptcy court data from PACER to document covenants in senior loan agreements and investigate the influence of senior lenders on bankruptcy outcomes. He finds, as do we, a relationship between the senior debt-to-assets ratio and case disposition. The relationship is con-sistent with a desire among senior creditors to resolve cases more quickly when their claims are more at risk. But McGlaun does not find the statistical-ly significant, non-monotonic relationship we document in section 5 below. CEO turnover during bankruptcy has also received attention as a mea-sure of creditor control. Carapeto (2003) finds that turnover is higher among firms that receive DIP financing, consistent with the notion of creditor control. Bharath, Panchapegasan, and Werner (2007, 22) find that turnover rates in bankruptcy increased 65 percent between 1990 and the early 2000s. Among entrenched managers-those with significant equity holdings-the turnover rate rose more than 200 percent, a change they at-tribute to increased creditor control during the same period.
6Chatterjee, Dhillon, and Ramirez (2004) catalogue the covenants in DIP loans to publicly traded corporations that filed Chapter 11 petitions between 1988 and 1997. Although they compare these covenants to those in other credit agreements, the authors do not assess the effect of these covenants on bankruptcy outcomes.
Summer, 2009: Volume 1, Number 2 - Journal of Legal Analysis - 517
Several scholars have examined CEO turnover preceding a bankruptcy filing. Bernstein (2006) finds high levels of turnover during 2001. Among publicly traded firms in bankruptcy, about 43 percent of the CEOs were re-placed within the two years preceding the filing. Oddly, this turnover rate is lower than rates estimated by other scholars using data on cases filed during the early 1980s, the heyday of management control. Gilson (1989), for ex-ample, studied 69 publicly traded firms that entered Chapter 11 proceedings between 1979 and 1984 and estimated a turnover rate equal to 55 percent during the two years preceding the bankruptcy filing. A similar rate, equal to 53 percent, can be derived from the work of LoPucki and Whitford (1994, 723-36), who studied the 43 largest publicly held corporations that filed Chapter 11 petitions between 1979 and 1988 and successfully reorganized.7
2. DATA
We collected data on all corporate bankruptcies listed in the Bankruptcy Datasource "Public and Major Company Database" during the latter half of 2001.8 This datasource is commonly used in corporate finance and is attractive because it includes filings by both publicly traded and privately held firms. We chose the latter half of 2001 because data for earlier periods are highly incomplete, and at the beginning of this project we worried that we might encounter a censoring problem if we studied post-2001 years be-cause many cases would still be ongoing.9
Our initial sample included 153 cases, listed inAppendixB'0
o. For each case, we gathered information about the parent company and its subsidiaries in 7 We calculated this rate using the data reported in Table 4 of LoPucki and Whitford (1994). The time window used by LoPucki and Whitford begins 18 months prior to the Chapter 11 filing, which is slightly shorter than that used by Gilson (1989). Turnover rates rise dramatically, of course, when the window is extended to include post-petition events. LoPucki and Whitford, for example, estimate a turnover rate equal to 91% based on a window beginning 18 months prior to filing and ending 6 months after plan confirmation. Id, at 723. Using a similar window-beginning 2 years prior to filing and ending at plan confirmation-Brian Betker (1995) observed a turnover rate equal to 75 percent in a sample of 75 firms listed in the Bankruptcy Data Source. See Betker (1995) for additional studies of CEO turnover in financially distressed firms. 8 The list of firms is available at http://www.bankruptcydata.com/findabrtop.asp. This database
includes bankruptcy filings by (a) all publicly traded corporations and (b) privately held cor-porations that issued public debt or were "deemed significant and newsworthy."
9 One of the most popular courts, the Bankruptcy Court for the District of Delaware, began posting images in July 2001.
bankruptcy. Our data sources were PACER, SEC filings, and the Bankruptcy Datasource. PACER is our primary resource. Every bankruptcy court main-tains a PACER website, which conmain-tains the docket sheet for and, often, im-ages of all documents filed in a bankruptcy case. Document imim-ages were unavailable or incomplete in many cases, so the number of observations varies in the following statistical analysis. For some measures of interest, we have complete data for all 153 cases; for others, we have complete data for only a subset. We did not try to supplement the incomplete PACER mate-rials by, for example, collecting physical documents from the bankruptcy courts. That would have been prohibitively costly in light of the time re-quired to hand-collect and code the materials available on PACER.
In most of the analysis that follows, we rely on information contained in court schedules because they offer up-to-date information about the firm's capital structure when it files, including data on secured debt. Comparable information is often unavailable in SEC filings.
3. SUMMARY STATISTICS
Tables 1 and 2 present summary information about the businesses and their experiences in bankruptcy. We see a dramatic change in capital structures as firms approach bankruptcy. Table 1 presents statistics on asset and debt hold-ings before and after the bankruptcy filhold-ings. The pre-bankruptcy statistics for publicly-held firms are based on the most recent Compustat data during the two year period preceding the bankruptcy filing. Before filing for bankruptcy, the median public firm reported assets worth $151 million, debt of about $112 million, and secured debt equal to $6 million. The bankruptcy schedules present a different capital structure: the median public firm reported assets worth $98 million and secured debt of $67 million. Thus, we see a 35 percent drop in asset value and an eleven-fold increase in secured debt among public companies during the one to two years preceding the bankruptcy filing.
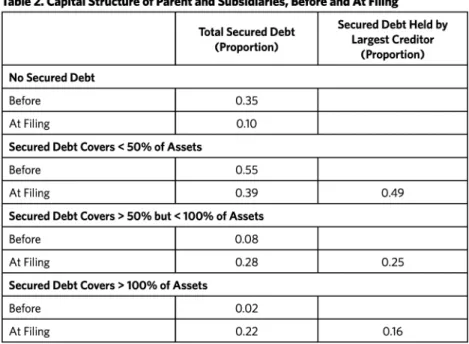
Ninety percent of the firms entered bankruptcy with secured debt. Table 2 presents important variation in the value of secured debt relative to assets. In 39 percent of the cases, the total value of secured claims was equal to less than 50 percent of asset value; in 28 percent of the cases, it ranged between 50 and 100 percent of asset value; and in 22 percent of the cases, secured claims exceeded the value of the company. In other words, secured creditors were undersecured in over a fifth of the cases. A similar pattern emerges when we compare, as the
Summer, 2009: Volume 1, Number 2 - Journal of Legal Analysis - 519 Table 1. Capital Structure of Public and Private Companies
Obs. Mean SD Median Min Max Assets (millions) Before, public 99 662.8 1,447.8 151.2 0.9 10,255.0 At filing, public 71 621.5 1,981.8 98.1 0.2 15,859.9 At filing, private 18 66.7 98.3 35.3 1.6 381.4 Debt (millions) Before, public 99 574.1 1,256.8 111.6 0.6 8,704.8
Secured Debt (millions)
Before, public 96 147.0 477.7 6.0 0.0 4,228.9
At filing, public 71 233.3 528.6 67.3 0.0 3,986.8
At filing, private 18 22.2 38.1 4.2 0.0 126.4
Note: Data for parents and subsidiaries are reported on a consolidated basis. If subsidiaries did not enter bankruptcy with the parent company, their financial information is not reflected in the at-filing statistics reported here. Pre-bankruptcy data are taken from SEC filings by publicly-traded corporations. At-filing data are taken from bankruptcy schedules. Because these sched-ules are incomplete, the number of observations for public firms is smaller at filing (71) than before bankruptcy (99).
Table 2. Capital Structure of Parent and Subsidiaries, Before and At Filing
Secured Debt Held by
Total Secured Debt LretCeio (Proportion) Largest Creditor
(Proportion) No Secured Debt
Before 0.35
At Filing 0.10
Secured Debt Covers < 50% of Assets
Before 0.55
At Filing 0.39 0.49
Secured Debt Covers > 50% but < 100% of Assets
Before 0.08
At Filing 0.28 0.25
Secured Debt Covers > 100% of Assets
Before 0.02
At Filing 0.22 0.16
Note on sample sizes: Before: n=97; At Filing: n=89 for Total Secured Debt, n=88 for Secured Debt Held by Largest Creditor
second column of Table 2 does, the claim held by the largest (or dominant) secured creditor to the value of the firm's assets.
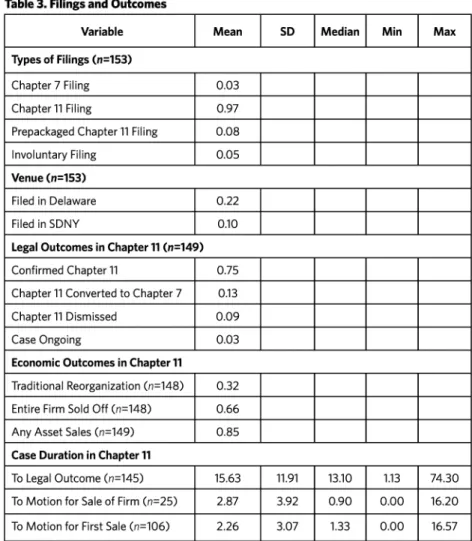
Table 3 presents information about the bankruptcy process. Ninety-five percent of the cases were filed voluntarily by the debtors' owners. All but 3 percent of the cases were filed under Chapter 11.11 Among these cases, nearly 75 percent resulted in a confirmed plan of reorganization; most of the remaining cases resulted in dismissal or conversion to Chapter 7. We do not have direct indicators of whether a plan was prepackaged, so we assume that a case was prepackaged if confirmation occurred within four months.12
Eight percent of the Chapter 11 cases satisfied this criterion.
The fourth panel of Table 3 illustrates the frequency with which Chapter 11 cas-es rcas-esulted in the sale or liquidation of the busincas-ess. A traditional reorganization -in which the distressed firm's creditors retain stakes in the firm and, often, become its new owners-occurred in only 32 percent of the cases.
The final panel of Table 3 summarizes case duration.Across all Chapter 11 cases, the median duration to confirmation, dismissal, or conversion to Chapter 7 swas about 13 months. This figure is somewhat misleading, however, because many plans are liquidating plans that distribute the proceeds from a going-concern sale that occurred months before. In these cases, the fate of the firm (whether it would be reorganized or sold off) was decided long before a plan was con-firmed. The final panel of Table 3 illustrates this phenomenon. Although we do not have the dates on which sales occurred, we do have the dates when mo-tions to conduct a sale were filed. Among firms that were sold off, a motion to sell the firm was typically filed within the first two to three months of the case.
4. SIMPLE MEASURES OF CREDITOR CONTROL AND CONFLICT
Creditor Control
We can measure creditor control directly and indirectly. Direct measures in-clude deviations from APR that favor equity holders and the terms of post-petition DIP financing. An indirect measure is the frequency of management turnover immediately before and after the bankruptcy filing. When a firm is
11 Bernstein (2006,2 n.3) reports the same percentage of involuntary filings in a study of Chapter 11 filings during 2001 by publicly traded corporations.
12 This cut-off captures all but two of the cases identified as "prenegotiated" in LoPucki's WebBRD database. The two exceptions were cases with durations of 6.9 and 8.7 months, respectively.
Summer, 2009: Volume 1, Number 2 - Journal of Legal Analysis - 521 Table 3. Filings and Outcomes
Variable Mean SD Median Min Max Types of Filings (n=153)
Chapter 7 Filing 0.03
Chapter 11 Filing 0.97
Prepackaged Chapter 11 Filing 0.08
Involuntary Filing 0.05
Venue (n=153)
Filed in Delaware 0.22
Filed in SDNY 0.10
Legal Outcomes in Chapter 11 (n=149)
Confirmed Chapter 11 0.75
Chapter 11 Converted to Chapter 7 0.13
Chapter 11 Dismissed 0.09
Case Ongoing 0.03
Economic Outcomes in Chapter 11
Traditional Reorganization (n=148) 0.32 Entire Firm Sold Off (n=148) 0.66
Any Asset Sales (n=149) 0.85
Case Duration in Chapter 11
To Legal Outcome (n=145) 15.63 11.91 13.10 1.13 74.30
To Motion for Sale of Firm (n=25) 2.87 3.92 0.90 0.00 16.20 To Motion for First Sale (n=106) 2.26 3.07 1.33 0.00 16.57
distressed, its creditors influence the choice of management. DIP loan cov-enants, for example, routinely include provisions forbidding the debtor from replacing a newly appointed CEO.3 To be sure, management turnover might be caused by dynamics wholly separate from creditor control. Shareholders of a troubled firm might replace the CEO because they hope new leadership will help the firm recover (or because they hope to avoid creditor control, which might result if the firm becomes further distressed). We view management turnover as an important, but not decisive, indicator of creditor control. We
13 Chatterjee, Dhillon, and Ramirez (2004, 3107) report that 95 percent of DIP loans contain covenants forbidding changes in management, control, and ownership.
expect creditor control to be positively correlated with CEO turnover, but we cannot rule out other causes of high turnover.
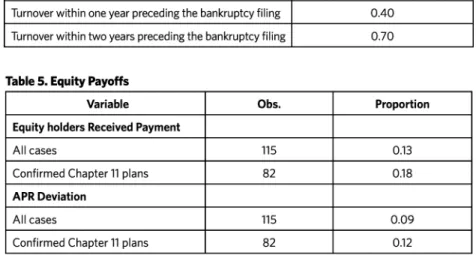
Statistics on CEO turnover appear in Table 4. We computed turnover rates by comparing the name of the CEO on the date of the bankruptcy fil-ing (as reported in PALER documents) to the name of the CEO reported in Compustat data for the two year period preceding the bankruptcy filing. Table 4 shows that 70 percent of CEOs were replaced within the two years preceding the bankruptcy filing. This turnover rate is markedly higher than the 45 percent rate observed by Kaplan and Minton (2006) among Fortune 500 firms during a comparable two-year period (1999-2000)." It is also sig-1 nificantly higher than the 55 percent rate observed by Gilson (1989) among firms that entered bankruptcy during the 1980s. The frequency of turnover in our data rises further, to about 80 percent, when we include CEO replacements that occurred during the two years after the case commenced (as reported in PACER documents). This is undoubtedly an underestimate, however, because we did not look systematically for post-petition turnover. If CEO turnover is a good proxy for creditor control, these data point to pervasive control. At a minimum, it strongly suggests that managers are not able to use Chapter 11 as a safe harbor when their firms encounter financial distress.
Direct measures of creditor control appear in Tables 5 and 6. Table 5 shows that deviations from APR-payments to shareholders when creditors have not been paid in full-were rare, occurring in only 9 percent of all Chapter 11 cases (reorganizations, dismissals, and conversions to Chapter 7) and in 12 percent of confirmed plans of reorganization. This is a dramatic shift from the frequency of APR violations during the 1980s. In a study of publicly traded corporations that entered Chapter 11 between 1979 and 1986, for example, Weiss (1990) found APR violations in 78 percent of the cases. He also found that equity holders received some payment in 80 percent of the cases. That was true in only 18 percent of confirmed plans of reorganization in our sample. If APR deviations measure the degree of control exercised by managers and eq-uity holders, as is commonly thought, the patterns in Table 5 show that these groups exercise little influence over the modern Chapter 11 process. The pat-terns point instead to pervasive creditor control.
Table 6 documents the frequency and terms of pre- and post-petition financing. Prior to entering bankruptcy, 75 percent of the businesses 14 The 45 percent figure was computed based on Table 2 of Kaplan and Minton (2006). The aver-age number of firms during 1999 and 2000 was 733; the total number of CEO turnovers was 328, which is about 45 percent of 733.
Summer, 2009: Volume 1, Number 2 - Journal of Legal Analysis - 523
Table 4. CEO Turnover
Variable (n=136) Proportion
Turnover within one year preceding the bankruptcy filing 0.40
Turnover within two years preceding the bankruptcy filing 0.70
Table 5. Equity Payoffs
Variable Obs. Proportion Equity holders Received Payment
All cases 115 0.13
Confirmed Chapter 11 plans 82 0.18
APR Deviation
All cases 115 0.09
Confirmed Chapter 11 plans 82 0.12
obtained financing through a revolving pre-petition credit facility (PCF). In 97 percent of these cases, the facilities were secured by all or nearly all of the firm's assets. Recall that we observe remarkably low levels of secured debt among the firms in our sample when we study documents filed one or two years before their bankruptcy filings. It seems likely, then, that most PCFs originated during the year before the bankruptcies. This is a strong measure of senior creditor control. If all of a firm's assets are encumbered by liens, it cannot obtain additional secured financing in bankruptcy with-out obtaining permission from or offering adequate protection to the pre-petition secured lender (11 U.S.C. §§ 364(c), (d)).
Upon entering bankruptcy, 50 percent of the firms obtained post-petition DIP financing. Another 26 percent obtained liquidity by filing motions to use cash collateral (that is, cash in which a creditor has a security interest). These motions differ little from those for DIP financing; in either case, the debtor hopes to finance its operations using funds over which a lender has control. Indeed, cash collateral motions frequently contain the same terms found in motions for DIP financing. In 76 percent of the cases, the firm obtained financing through a DIP loan or an order permitting it to use cash collateral. This, in turn, suggests that the providers of the firms' credit lines have substantial control over, at a minimum, the timing of the bankruptcy filings. These results are important because they provide confirmation that a primary justification for the bankruptcy filing is the debtor's need to access cash that is unavailable outside bankruptcy.
Table 6. Terms of Financing
Obs. Mean SD Median Min Max Pre-petition Financing
All Firms
Had Pre-petition Credit Facility (PCF) 107 0.75 Firms with PCF
PCF is secured 77 0.97
PCF is Secured By All Assets 77 0.78 Post-petition DIP Financing
All Firms
Had DIP Loan 153 0.50
Used Cash Collateral 153 0.26 Used DIP Loan or Cash Collateral 153 0.76 Firms with DIP Loan
DIP Lender is also PCF Lender 63 0.54
Size of DIP Loan
Maximum DIP Loan, $ millions 66 93.42 249.82 20.00 0.20 1,743.00 DIP Loan-. Assets 51 0.89 3.70 0.15 0.01 26.28 DIP Loan + Unencumbered Assets 51 -0.72 12.14 0.15 -82.55 17.23 Priority of DIP Loan
Firms with DIP Loan
DIP Secured by All Assets? 62 0.92 DIP with Priming Security Interest? 62 0.65 DIP with Admin. Expense Superpriority? 63 0.95 Firms with Priming Security Interest
DIP Lender is also PCF Lender 40 0.80 Financial covenants in DIP Loan
Budget Limits 60 0.72
Capital Expenditure Limits 60 0.50
EBITDA Targets 60 0.42
Any Financial Covenants 60 0.90 Other Covenants in DIP Loan
Automatic Stay Terminates in Event of Default 60 0.85 Power of Attorney 60 0.20 Deadlines for Disclosure Statement or Plan 60 0.18 Sale Requirements 63 0.17
Summer, 2009: Volume 1, Number 2 - Journal of Legal Analysis - 525
The final three panels of Table 6 dissect the terms of DIP loans. 95 percent of the loans give the lender administrative expense superpriority. This is a potent form of control because it gives the lender the right to demand repayment in cash before any plan of reorganization can be confirmed. Ninety-two per-cent of the loans give the lender a security interest in all of the firm's assets. This too is an important mechanism of control when combined with cov-enants permitting the lender to seize collateral-without petitioning for court authorization-in the event of default. These covenants are present in 85 percent of DIP loans, as shown in the final panel of Table 6.
Other covenants enhance creditor control. Perhaps our most surprising result, and the strongest evidence of senior creditor control, is the large per-centage of loans that impose specific line-item budgets on the firm (72 per-cent of loans). These budgets obligate the firm to submit detailed evidence of cash receipts and expenditures. A default occurs if the firm deviates from any given line-item by a significant margin (usually 5 to 15 percent). Other covenants are of the more standard variety and restrict capital expenditures (50 percent) or require the firm to achieve certain profitability or EBITDA targets (42 percent). Ninety percent of the loans contained at least one of these provisions, as shown in the fifth panel of Table 6.
The fourth panel of Table 6 also shows that 65 percent of DIP loans con-tain provisions giving the lender a priming lien, that is, a security interest with priority over pre-existing security interests. This phenomenon could be seen as a means by which DIP lenders divert value from pre-existing se-cured lenders. Most DIP lenders, however, are the same banks that extended PCFs to the debtor. A priming lien typically primes only the DIP lender's own pre-existing security interest. There is no diversion of value. As Table 6 illustrates, 80 percent of priming liens involve the DIP lender priming itself; in the remaining 20 percent, the DIP lender obtained a priming lien at the expense of another secured lender. In these calculations, we look only at the names of the lead lenders. If the loans were syndicated, we do not know the degree of overlap in syndicate membership between the PCF and DIP loans. We also cannot say whether a DIP lender adequately compensated a pre-existing secured lender for a priming lien.
Senior creditor control, then, appears to be pervasive in a large number of corporate bankruptcies. The majority of firms see their CEOs replaced, and they sign loan agreements that give lenders significant control over the
course of the Chapter 11 process. Evidence from PCFs indicates that, for most firms, the senior lender has effective control over the debtor's access to
cash and thus determines the timing of the bankruptcy filing. Our analysis of DIP covenants suggests that this control extends beyond the filing and continues throughout the bankruptcy case in the form of line-item budget-ary control over the debtor's operations.
Creditor Conflict
Tables 7 and 8 offer direct and indirect measures of creditor conflict. Table 7 focuses on an indirect measure-creditor concentration. When most secured debt is held by one party and most unsecured debt by another, creditor con-flict is likely to be significant. Although not reported in Table 7, secured debt is highly concentrated.'5 In the median firm, the top three secured creditors hold 100 percent of secured debt (if the debt was syndicated, we count the group as a single creditor). Table 7 shows that unsecured claims are some-what more dispersed, but still significantly concentrated. In the median firm,
over 50 percent of the unsecured debt is held by three creditors.
Direct measures of creditor conflict are presented in Table 8, which cata-logues the frequency with which the unsecured creditors' committee (UCC) and the senior lender (the PCF lender or DIP lender) objected to actions proposed by the debtor corporation. With respect to the UCC, the most common objection (in 46 percent of cases in which a UCC was organized) was to the appointment or compensation of professionals, whose fees re-duce returns to unsecured creditors. Objections to the DIP loan (40 percent) and to asset sales (37 percent) were the next most common. These UCC ob-jections suggest strongly that, in a large number of cases, the managers of the corporation are not acting to maximize the returns of unsecured creditors, who are often the firms' residual claimants.
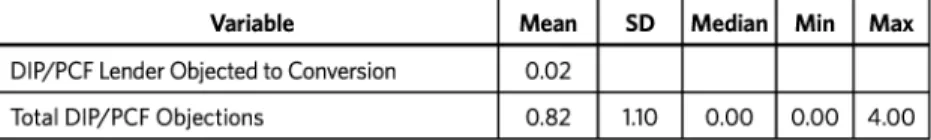
Although senior creditors obtain substantial control through their loan agreements, they too might object to actions proposed by the debtor corpo-ration. The most common objections are to the appointment or compensa-tion of professionals (25 percent), asset sales (13 percent), and the use of cash collateral (11 percent). The frequency of objections raises doubts again about the conduct of management. In a significant number of cases, manag-ers appear not to be acting to further the interests of either senior or junior lenders. We see, then, creditor conflict as well as manager-creditor conflict.
15 We measure creditor concentration using data from the parent company only. It was pro-hibitively complex to assess creditor concentration at both the parent and subsidiaries due to inter-company claims.
Summer, 2009: Volume 1, Number 2 - Journal of Legal Analysis - 527
Table 7. Unsecured Creditor and Equity Concentration
~Proportion
Unsecured Debt Concentration (n=88)Largest Creditor, Share of Unsecured Parent Debt 0.39
Top 3 Creditors, Share of Unsecured Parent Debt 0.54 Equity Concentration (n=102)
Largest Shareholder, Share of Equity 0.36 Top 2 Shareholders, Share of Equity 0.48 Equity Committee Appointed (n=153) 0.05
Table 8. Objections and Motions
Variable Mean SD MedianlMin Max
Unsecured Creditors Committee (n=112)
Any Objections 0.71
Objected to Professionals 0.46
Objected to DIP Loan 0.40
Objected to Sale 0.37
Objected to Exclusivity Extension 0.21
Objected to Plan 0.20
Objected to Lifting Stay 0.07
Moved for Exclusivity Extension 0.04
Objected to Conversion 0.04
Moved for Conversion 0.04
Moved for Sale 0.01
Total Objections 1.83 1.51 2.00 0.00 5.00
DIP Lender or PCF Lender (n=107)
Any Objections 0.46
DIP/PCF Lender Objected to Professionals 0.25
DIP/PCF Lender Objected to Sale 0.13
DIP/PCF Lender Objected to Cash Collateral Use 0.11
DIP/PCF Moved for Lifting Stay 0.09
DIP/PCF Lender Objected to Exclusivity Extension 0.07
DIP/PCF Lender Objected to Plan 0.07
DIP/PCF Lender Objected to Lifting Stay 0.05 DIP/PCF Lender Moved for Conversion 0.03
Table 8. Continued
Variable Mean SD Median Min Max
DIP/PCF Lender Objected to Conversion 0.02
Total DIP/PCF Objections 0.82 1.10 0.00 0.00 4.00
Note: Statistics for the first panel are based on the subsample of cases in which an unsecured creditors' committee (UCC) was formed; statistics for second panel are based on the subsam-ple in which there was a DIP or PCF lender.
5. HYPOTHESIS TESTS
In this section, we outline-and then test-a simple theory of creditor con-flict and its effects on a particular bankruptcy outcome: the decision to reorganize or sell a firm.
Theory
Our primary question is whether (and to what extent) creditor conflict af-fects the ultimate allocation of the bankrupt firm's assets. This question is important because creditor control and conflict can lead to suboptimal sales or reorganizations.16 We provide a formal model of creditor conflict
and its effect on bankruptcy outcomes in Appendix A. An intuitive sketch of the model is provided below.'7
First consider the incentives of a secured lender whose claim is overse-cured, meaning that the firm's assets, if sold immediately, would yield more than the lender's claim. This implies that the lender is paid in full, even if the sale occurs at a "fire sale" price that could be avoided by waiting and perhaps reorganizing. Relative to a strategy that maximizes the value of the bankruptcy estate, the oversecured lender is always biased toward an immediate resolution of the case. If asset value is volatile, the delay caused by the reorganization process only harms the lender. Any increase in value offers no benefit because the lender's payoff is capped by its claim. Decrease in value can be costly, possibly reducing the lender's payoff.
Although the oversecured creditor always prefers an immediate sale, its ability to realize its preferred outcome should depend on the extent to 16 LoPucki and Doherty (2007), for example, argue that bankruptcy sales generate significantly
less value for creditors than traditional reorganizations.
17 Franks and Sussman (2005) develop a similar theory and test it using data on relatively small, distressed companies in the United Kingdom, where senior creditors have much stronger con-trol over the bankruptcy process than in the United States. Their empirical analysis yields results that are consistent with the theory but are not statistically significant.
Summer, 2009: Volume1, Number 2 - Journal of Legal Analysis - 529
which it is oversecured. When a creditor is substantially oversecured, the bankruptcy judge is unlikely to grant requests for an immediate sale. When the value of the firm greatly exceeds the secured creditor's claim, it is prob-able that the creditor will be paid in full, even in a reorganization. As the se-cured creditor becomes only slightly oversese-cured, we expect that the judge is more likely to approve attempts by the secured creditor to move for a quick sale, because its claim is at greater risk.
Now consider a secured lender whose claim is undersecured, that is, its claim exceeds the sale value of the firm's assets. In this case, the secured lender is not paid in full in a sale. If the creditor is slightly undersecured, its incentives are similar to those of the slightly oversecured creditor. Reorganization can increase its payoff only slightly, but a decline in firm value can hurt its payoff significantly. As the secured creditor becomes sub-stantially undersecured, its interests are better aligned with maximizing the value of the estate because it captures nearly all the upside from a success-ful reorganization. The substantially undersecured creditor is the firm's ap-proximate residual claimant and entitled to the entire value of the firm.'8 Thus, if an illiquidity problem makes reorganization socially optimal, the lender prefers to reorganize the firm to improve its payoff.
Finally, consider unsecured creditors. They generally exhibit a bias toward lengthy cases, especially reorganizations, when the firm enters bankruptcy with senior secured debt. Longer delay adds to the risk of their eventual payoff, and junior claimants typically exhibit a preference toward greater risk.'9 When the firm has no secured debt, however, unsecured creditors prefer to make the reorganization-versus-sale decision in a way that is con-sistent with the maximization of firm value.
This simple analysis of creditor conflict predicts that a bankrupt firm's creditors will make the value-maximizing decision when secured creditors are substantially undersecured or when there is no secured debt.2" If the 18 The undersecured creditors' incentives are not exactly consistent with social efficiency. The creditors still have a slight bias toward a quick sale, all else equal, because unsecured creditors might capture some of the upside risk to a high-value reorganization.
19 Here, we are employing standard logic that is normally used to describe equity-versus-debt conflicts. Unsecured creditors expect to share most of the gains from a successful (high value) reorganization, but they expect to avoid most of the losses from a low-value reorganization or liquidation. These losses are borne primarily by senior secured creditors. Due to this asym-metry in payoffs, unsecured creditors prefer risk, all else equal (Jensen and Meckling 1976). 20 A few important assumptions are implicit in this argument. For instance, it assumes that
se-cured creditors have full control when they are oversese-cured. It also assumes that equity will be extinguished with certainty (which is approximately true in our data).
capital structure is a mix of oversecured and unsecured debt, a bias toward sale will result. The intensity of the bias depends on which party exerts more control over the outcome. We expect that senior creditors will have greater influence over the outcome when their claims are large relative to the value of the firm. Thus, a capital structure with slightly oversecured senior creditors will produce relatively quick cases and yield sales more of-ten than traditional reorganizations. As the power of unsecured creditors increases relative to secured creditors, the reverse should be true.
These observations point to the following hypothesis: Because time to resolution is generally longer when a firm is reorganized than when it is sold off, a traditional reorganization is more likely among (a) firms with no secured debt and those with undersecured lenders than among (b) firms with oversecured lenders.
This hypothesis would be easy to test if capital structures were randomly assigned to firms before they entered bankruptcy. With random assignment, we could assume that any correlation between the probability of reorgani-zation and secured debt levels is due to dynamics during the bankruptcy case, such as conflict between secured lenders and other participants in the bankruptcy process. In reality, firms select their capital structures. It is possible that the reasons for choosing different secured debt ratios are the same reasons driving firms' preferences over traditional reorganizations and going-concern sales. This is an important issue because most secured debt is incurred within the year or two preceding the bankruptcy filing. There could be a close relationship between a firm's expectations in bankruptcy and its decisions to take on secured debt.
Asset liquidity is one factor that could drive both a firm's decision to take on secured debt before bankruptcy and its preference for traditional reor-ganization in bankruptcy. The more liquid a firm's assets-due to tangibil-ity or industry conditions (Almeida and Campello 2007)-the more likely it is to take on secured debt.2' At the same time, a firm with liquid assets is less likely to suffer the kinds of problems (such as asymmetric informa-tion) that make a traditional reorganization attractive, as Pulvino (1998) has shown. Asset liquidity, then, explains both capital structure and bank-ruptcy outcomes. Firms with relatively liquid assets are predicted to have both high secured debt ratios and low probabilities of reorganization. The
21 Sibilkov (2007) offers recent evidence showing a positive correlation between asset liquidity and secured indebtedness.
Summer, 2009: Volume 1, Number 2 - Journal of Legal Analysis - 531
opposite is expected among firms with relatively illiquid assets: These firms will have low secured debt ratios and high probabilities of reorganization.
Thus, a theory based on asset liquidity predicts a monotonic relation-ship between secured indebtedness and the probability of traditional reor-ganization. Our theory-based on the divergent preferences of unsecured, undersecured, and oversecured creditors-implies a non-monotonic rela-tionship. The probability should be higher when the ratio of secured debt to assets is near zero and when it is much larger than one; the probability should be lower when the ratio is in between. This non-monotonic pattern distinguishes our theory from the pattern predicted by an asset liquidity theory.
Simple Statistics
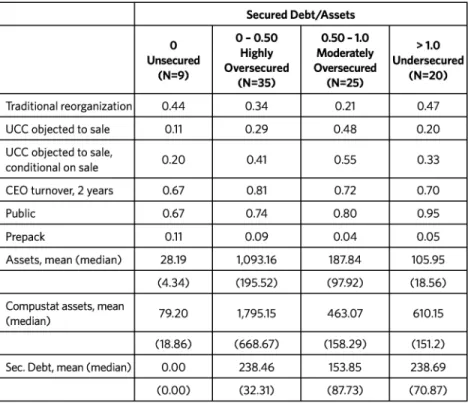
Table 9 presents data on capital structure and bankruptcy outcomes at dif-ferent levels of the secured debt-to-assets ratio: unsecured firms (0), highly oversecured firms (0-0.50), moderately oversecured firms (0.50-1.0), and undersecured firms (>1.0).
Table 9. Firm Characteristics by Secured Debt Level
Secured Debt/Assets
0 0-0.50 0.50-1.0 >1.0 Unsecured Highly Moderately Undersecured
(N=9) Oversecured Oversecured (N=20) (N=35) (N=25)
Traditional reorganization 0.44 0.34 0.21 0.47
UCC objected to sale 0.11 0.29 0.48 0.20
UCC objected to sale, 0.20 0.41 0.55 0.33
conditional on sale
CEO turnover, 2 years 0.67 0.81 0.72 0.70
Public 0.67 0.74 0.80 0.95
Prepack 0.11 0.09 0.04 0.05
Assets, mean (median) 28.19 1,093.16 187.84 105.95
(4.34) (195.52) (97.92) (18.56)
Compustat assets, mean 79.20 1,795.15 463.07 610.15
(median)
(18.86) (668.67) (158.29) (151.2) Sec. Debt, mean (median) 0.00 238.46 153.85 238.69 (0.00) (32.31) (87.73) (70.87)
Several distinctive patterns emerge. First, unsecured and undersecured firms are much smaller than oversecured firms. For example, the median unsecured and undersecured firms had assets worth $4.34 million and $18.56 million, respectively. By contrast, the median oversecured firm had assets ranging from $97.92 million (moderely oversecured) to $195.52 mil-lion (highly oversecured). The small size of undersecured firms is some-what deceiving, however. Prior to entering bankruptcy, these firms were comparable in size to slightly oversecured firms (for whom secured debt exceeded 50 percent of asset value). During the months prior to filing, un-dersecured firms suffered a larger decrease in value than any other type of firm. We are unsure why the decline was so steep for these firms.
We see a different relationship between secured debt levels and secured debt ratios. Focusing on medians, undersecured firms had about as much secured debt ($70.87 million) as moderately oversecured firms ($87.29 million), even though the undersecured firm had much smaller asset value. Thus, variation in secured debt ratios appears to be due more to variation in asset value than in the level of secured debt. This highlights the importance of controlling for asset value in the multivariate analysis below.
The most important pattern in Table 9, for our purposes, is the rela-tionship between the probability of reorganization and the ratio of secured debt to assets. We see the hypothesized non-monotonic relationship. The likelihood of traditional reorganization is higher among unsecured (44 percent) and undersecured firms (47 percent) than it is among moderately oversecured (21 percent) and highly oversecured firms (34 percent).22 Also consistent with our theory, the probability of reorganization among over-secured firms is declining in the ratio of over-secured debt to assets, but the dif-ference is not statistically significant.
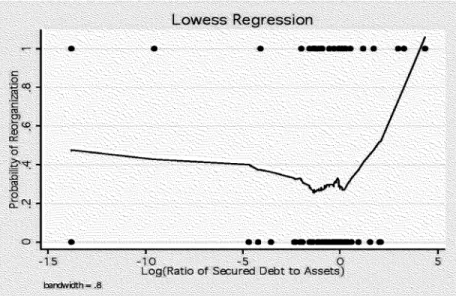
Figure 1 illustrates this non-monotonic relationship using locally weighted scatterplot smoothing.23 Here, a lowess curve displays the re-lationship between (a) the probability of reorganization, displayed on the y-axis, and (b) the ratio of secured debt to assets, expressed in logs,
22 The difference between undersecured and moderately oversecured firms (50-100%) is statisti-cally significant at the 5 percent level using a one-tail test. The difference between unsecured and highly oversecured firms (0-50%) is not significant, probably due to small sample size. 23 The curve in Figure 1 is implemented using Stata's default settings, including a bandwidth
equal to 0.8. An intuitive description of the lowess procedure is available in Imbs and Wacziarg (2003, 67-68).
Summer, 2009: Volume 1, Number 2 - Journal of Legal Analysis - 533
Figure 1. Lowess curve relating the probability of reorganization (y-axis) to the ratio of secured debt to assets, in logs (x-axis).
Lowess Regression S 0 * *inme 0 N U) 0 0 -15 -10 -5 05
Log(Ratio of Secured Debt to Assets)
displayed on the x-axis. The lowess curve is a standard procedure for drawing smooth curves through scatter plots. For each observation of the secured debt-to-assets ratio (x,), the probability of reorganization (y) is regressed on a small number of observations surrounding x. The fitted values from these local regressions are connected to form the lowess curve depicted in Figure 1. This procedure is attractive because it allows the re-lationship between the probability of reorganization (y) and the secured debt-to-assets ratio (x) to vary across different values of the ratio. The lowess curve in Figure 1 displays a distinct non-monotonic relationship. Among oversecured firms, the probability of reorganization is gradually decreasing in the secured debt-to-assets ratio; among undersecured firms, it is sharply increasing in the ratio.
These patterns are consistent with the hypothesis that secured lender preferences distort real economic outcomes. But if secured lenders can distort economic outcomes, we should see a response from the
UCC
when lenders propose outcomes that will reduce payoffs to unsecured creditors. Objections to sales, for example, should be more common in cases in-volving oversecured firms than in those inin-volving unsecured orbecause unsecured creditors should have significant influence over the bankruptcy process when no secured creditors exist. Objections should be less common among undersecured firms for two reasons. First, un-dersecured lenders are less likely to agitate for a quick sale. Second, when these lenders do agitate for a sale, a court is unlikely to grant a UCC's objection (relative to a case where the lenders are oversecured). This is because undersecured lenders are effectively the firm's residual claimants and will tend to advocate the socially efficient bankruptcy outcome. Because it is not costless to file an objection (a lawyer must be hired and documents drafted) and because any objection is likely to be denied, we expect UCC objections to be less common in undersecured firms than in oversecured firms.
These predictions are borne out in the data, as Table 9 shows. Objections to sale occurred in 29 to 48 percent of cases involving overse-cured firms (the difference between highly and moderately overseoverse-cured firms is statistically significant at the 6 percent level, using a one-tail test).The percentages are much lower in cases involving unsecured and undersecured firms (11 percent and 20 percent, respectively). The differ-ence between undersecured and moderately oversecured firms is signifi-cant at the 3 percent level, using a one-tail test; the difference between unsecured and highly oversecured firms is not significant, likely due to small sample size.
Multivariate Analysis
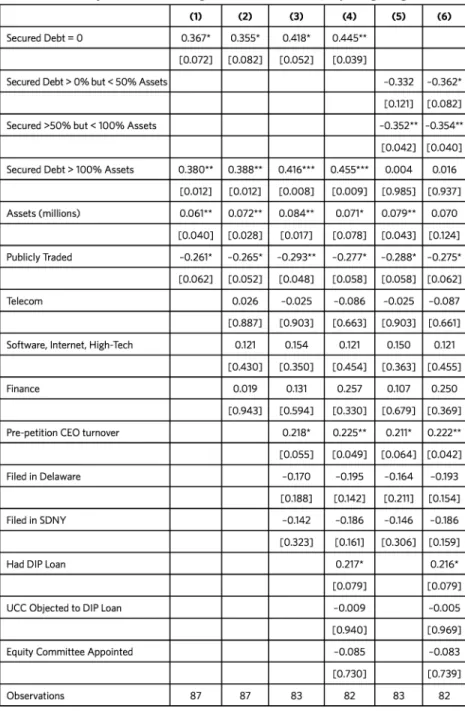
Tables 10 and 11 analyze the probability of traditional reorganization using a probit model. The dependent variable equals 1 when a Chapter 11 case concluded with a traditional reorganization and equals 0 when the case concluded in sale of the entire firm. The latter category includes liquidat-ing plans of reorganization, section 363 sales, conversions to Chapter 7, and dismissals. The coefficients in Tables 10 and 11 are elasticities, that is, they report the change in the probability of reorganization associated with either a 1 percent change in the dependent variable (if it is continuous) or a discrete change in that variable (if it is a dummy).
Table 10 presents models in which the probability of traditional reorga-nization is a function of the pervasiveness of secured debt, firm size, and other variables. In Columns (1) through (4), the variable Secured Debt-0 is a dummy equal to one for unsecured firms and zero for all others. Similarly, the variable Secured Debt > 100% Assets is a dummy equal to one among
Summer, 2009: Volume 1, Number 2 - Journal of Legal Analysis - 535
Table 10. Probability of Traditional Reorganization Probit Model, Reporting Marginal Effects (1) (2) (3) (4) (5) (6) Secured Debt = 0 0.367* 0.355* 0.418* 0.445**
[0.072] [0.082] [0.052] [0.039]
Secured Debt > 0% but < 50% Assets -0.332 -0.362* [0.121] [0.082] Secured >50% but < 100% Assets -0.352** -0.354**
[0.042] [0.040] Secured Debt > 100% Assets 0.380** 0.388** 0.416*** 0.455*** 0.004 0.016
[0.012] [0.012] [0.008] [0.009] [0.985] [0.937] Assets (millions) 0.061** 0.072** 0.084** 0.071* 0.079** 0.070 [0.040] [0.028] [0.017] [0.078] [0.043] [0.124] Publicly Traded -0.261* -0.265* -0.293** -0.277* -0.288* -0.275* [0.062] [0.052] [0.048] [0.058] [0.058] [0.062] Telecom 0.026 -0.025 -0.086 -0.025 -0.087 [0.887] [0.903] [0.663] [0.903] [0.661] Software, Internet, High-Tech 0.121 0.154 0.121 0.150 0.121
[0.430] [0.350] [0.454] [0.363] [0.455] Finance 0.019 0.131 0.257 0.107 0.250
[0.943] [0.594] [0.330] [0.679] [0.369] Pre-petition CEO turnover 0.218* 0.225** 0.211* 0.222** [0.055] [0.049] [0.064] [0.042] Filed in Delaware -0.170 -0.195 -0.164 -0.193
[0.188] [0.142] [0.211] [0.154] Filed in SDNY -0.142 -0.186 -0.146 -0.186 [0.323] [0.161] [0.306] [0.159]
Had DIP Loan 0.217* 0.216*
[0.079] [0.079] UCC Objected to DIP Loan -0.009 -0.005 [0.940] [0.969] Equity Committee Appointed -0.085 -0.083
[0.730] [0.739]
Observations 87 87 83 82 83 82
Dependent variable equals I if the case resulted in a traditional reorganization and 0 if it resulted in a sale. Robust p-values appear in brackets. * indicates significance at the 10 percent level, ** at the 5 percent level, and *** at the I percent level.
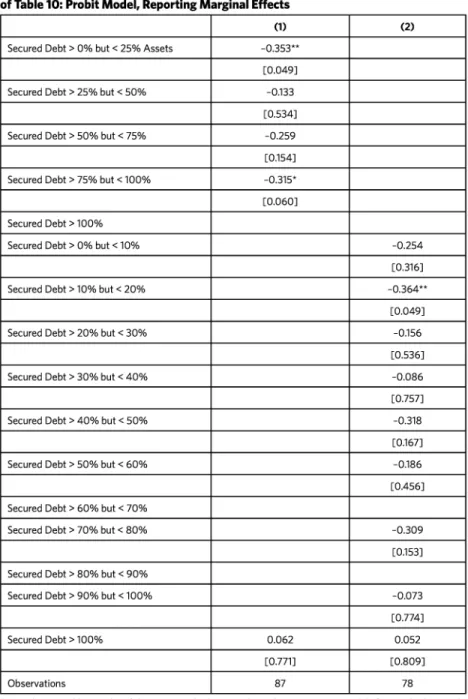
Table 11. Probability of Traditional Reorganization, Using Controls in Specification (2) of Table 10: Probit Model, Reporting Marginal Effects
(1) (2)
Secured Debt > 0% but < 25% Assets -0.353** [0.049]
Secured Debt > 25% but < 50% -0.133 [0.534]
Secured Debt > 50% but < 75% -0.259 [0.154] Secured Debt > 75% but < 100% -0.315* [0.060] Secured Debt > 100%
Secured Debt > 0% but < 10% -0.254 [0.316] Secured Debt > 10% but < 20% -0.364**
[0.049] Secured Debt > 20% but < 30% -0.156
[0.536] Secured Debt > 30% but < 40% -0.086 [0.757] Secured Debt > 40% but < 50% -0.318
[0.167] Secured Debt > 50% but < 60% -0.186
[0.456] Secured Debt > 60% but < 70%
Secured Debt > 70% but < 80% -0.309 [0.153]
Secured Debt > 80% but < 90%
Secured Debt > 90% but < 100% -0.073 [0.774] Secured Debt > 100% 0.062 0.052 [0.771] [0.809]
Observations 87 78
Dependent variable equals I if the case resulted in a traditional reorganization and 0 if it resulted in a sale. Robust p-values appear in brackets. * indicates significance at the 10 percent level, ** at the 5 percent level, and *** at the I percent level.
Summer, 2009: Volume 1, Number 2 - Journal of Legal Analysis - 537
undersecured firms and zero among all others. The coefficients for these variables tell us whether unsecured and undersecured firms are more (or less) likely to undergo a traditional reorganization than oversecured firms
(the excluded category).
Column (1) displays a simple model in which reorganization is a func-tion of only the pervasiveness of secured debt and the size of the firm, as measured by the log of total assets. Columns (2) through (4) expand this model to include covariates that are largely fixed at the moment a firm enters distress (Column (2)) and covariates that are endogenously deter-mined as the firm becomes distressed and enters bankruptcy (Columns (3) and (4)). Regardless of the specification, the primary result is the same: The probability of a traditional reorganization is significantly higher (by 35 to 46 percentage points) among unsecured and undersecured firms.24 This is consistent with our theory linking secured creditor preferences and bankruptcy outcomes.
Columns (5) and (6) explore this theory further by distinguishing firms with no secured debt (the excluded category) from those with highly cured creditors (Secured Debt > 0% but < 50% Assets), moderately overse-cured creditors (Seoverse-cured Debt > 50% but < 100% Assets), and underseoverse-cured creditors (Secured Debt > 100% Assets). We do not distinguish between moderately and highly undersecured creditors because our data include too few undersecured firms. Our theory predicts that the probability of traditional reorganization will not differ between unsecured and undersecured firms. Among oversecured firms, the probability should be lower among firms with
24 Estimates in Table 10 are largely robust to sensitivity tests. The same or similar patterns are observed in models that exclude firms with asset values in the top and bottom 5 (or 10) percentile of the sample; winsorize the asset values of firms in the top and bottom 5 (or 10) percent of the sample; exclude firms with above-median assets; exclude firms with below-median assets; exclude prepackaged cases; and exclude financial firms. The results are less compelling when the sample is limited to publicly-traded firms. Although the probability of reorganization is significantly higher for undersecured than oversecured firms, there is no statistically significant difference between unsecured and oversecured firms. This may reflect the small sample size: there were only 6 publicly-traded, unsecured firms.
Another notable feature of Table 10 (and the robustness checks) is the overall significance of the models. The Wald test for these probits generally shows that the models are marginally significant overall. Although the model in column (1) of Table 10 is significant at the 6 percent level, the remaining models are significant at the 9, 13, 16, 13, and 16 percent levels, respec-tively. The marginal significance of these models is an artifact of the small sample size and the negative correlation between Assets and the Secured Debt dummies (in column (1), for example, the correlation between Assets and Secured Debt=0 and Secured Debt> 100% Assets is -0.28 and -0.38, respectively).