Integrated Risk Management for
Improving Internal Traffic Control,
Work-Zone Safety, and Mobility
during Major Construction
Final Report
October 2012
About CMAT
The mission of the Construction Management and Technology (CMAT) Program is to improve the efficiency and cost-effectiveness of planning, designing, constructing, and operating transportation facilities through innovative construction processes and technologies.
About SWZDI
Iowa, Kansas, Missouri, and Nebraska created the Midwest States Smart Work Zone Deployment Initiative (SWZDI) in 1999 and Wisconsin joined in 2001. Through this pooled-fund study, researchers investigate better ways of controlling traffic through work zones. Their goal is to improve the safety and efficiency of traffic operations and highway work.
Disclaimer Notice
The contents of this report reflect the views of the authors, who are responsible for the facts and the accuracy of the information presented herein. The opinions, findings, and conclusions expressed in this publication are those of the authors and not necessarily those of the sponsors.
The sponsors assume no liability for the contents or use of the information contained in this document. This report does not constitute a standard, specification, or regulation.
The sponsors do not endorse products or manufacturers. Trademarks or manufacturers’ names appear in this report only because they are considered essential to the objectives of the document.
Non-Discrimination Statement
Iowa State University does not discriminate on the basis of race, color, age, religion, national origin, sexual orientation, gender identity, genetic information, sex, marital status, disability, or status as a U.S. veteran. Inquiries can be directed to the Director of Equal Opportunity and Compliance, 3280 Beardshear Hall, (515) 294-7612.
Iowa Department of Transportation Statements
Federal and state laws prohibit employment and/or public accommodation discrimination on the basis of age, color, creed, disability, gender identity, national origin, pregnancy, race, religion, sex, sexual orientation or veteran’s status. If you believe you have been discriminated against, please contact the Iowa Civil Rights Commission at 800-457-4416 or the Iowa Department of Transportation affirmative action officer. If you need accommodations because of a disability to access the Iowa Department of Transportation’s services, contact the agency’s affirmative action officer at 800-262-0003.
The preparation of this report was financed in part through funds provided by the Iowa Department of Transportation through its “Second Revised Agreement for the Management of Research Conducted by Iowa State University for the Iowa Department of Transportation” and its amendments.
The opinions, findings, and conclusions expressed in this publication are those of the authors and not necessarily those of the Iowa Department of Transportation or the U.S. Department of Transportation Federal Highway Administration.
Technical Report Documentation Page
1. Report No. 2. Government Accession No. 3. Recipient’s Catalog No.
InTrans Project 11-400
4. Title and Subtitle
Integrated Risk Management for Improving Internal Traffic Control, Work-Zone Safety, and Mobility during Major Construction
5. Report Date
October 2012
6. Performing Organization Code
7. Author(s) 8. Performing Organization Report No.
Jennifer S. Shane, Kelly C. Strong, and Jay Mathes InTrans Project 11-400
9. Performing Organization Name and Address 10. Work Unit No. (TRAIS)
Institute for Transportation Iowa State University
2711 South Loop Drive, Suite 4700 Ames, IA 50010-8664
11. Contract or Grant No.
12. Sponsoring Organization Name and Address 13. Type of Report and Period Covered
Midwest Smart Work Zone Deployment Initiative and Iowa Department of Transportation, 800 Lincoln Way, Ames, IA 50010
Midwest Transportation Consortium, Institute for Transportation, 2711 South Loop Drive, Suite 4700, Ames, IA 50010-8664
Federal Highway Administration, U.S. Department of Transportation, 1200 New Jersey Avenue SE, Washington, DC 20590
Final Report
14. Sponsoring Agency Code
TPF-5(081)
15. Supplementary Notes
Visit www.intrans.iastate.edu for color pdfs of this and other research reports.
16. Abstract
Highway construction is among the most dangerous industries in the US. Internal traffic control design, along with how construction equipment and vehicles interact with the traveling public, have a significant effect on how safe a highway construction work zone can be.
An integrated approach was taken to research work-zone safety issues and mobility, including input from many personnel, ranging from roadway designers to construction laborers and equipment operators. The research team analyzed crash data from Iowa work-zone incident reports and Occupational Safety and Health Administration data for the industry in conjunction with the results of personal interviews, a targeted work-zone ingress and egress survey, and a work-zone pilot project.
17. Key Words 18. Distribution Statement
highway construction risk—Iowa road work—job-site communications—job-site traffic control—multi-method analysis—road construction risk—roadwork risk modeling—traffic control planning—work-zone crash analysis—work-zone incidents
No restrictions.
19. Security Classification (of this report)
20. Security Classification (of this page)
21. No. of Pages 22. Price
I
NTEGRATED
R
ISK
M
ANAGEMENT FOR
I
MPROVING
I
NTERNAL
T
RAFFIC
C
ONTROL
,
W
ORK
-Z
ONE
S
AFETY
,
AND
M
OBILITY DURING
M
AJOR
C
ONSTRUCTION
Final Report October 2012 Principal Investigator
Jennifer S. Shane, Associate Professor, Civil, Construction, and Environmental Engineering Director of Construction Management and Technology (CMAT)
Iowa State University Co-Principal Investigator
Kelly C. Strong, Associate Professor, Construction Management Director of Construction Management Applied Research Center (CMARC)
Colorado State University Research Assistant
Jay Mathes Authors
Jennifer S. Shane, Kelly C. Strong, and Jay Mathes Sponsored by
Midwest Smart Work Zone Deployment Initiative, Iowa Department of Transportation, Midwest Transportation Consortium, Federal Highway Administration (FHWA) Pooled Fund Study
TPF-5(081): Iowa (lead state), Iowa, Kansas, Missouri, Nebraska, Wisconsin Preparation of this report was financed in part
through funds provided by the Iowa Department of Transportation through its Research Management Agreement with the
Institute for Transportation (InTrans Project 11-400)
A report from
Institute for Transportation Iowa State University 2711 South Loop Drive, Suite 4700
TABLE OF CONTENTS ACKNOWLEDGMENTS ... ix EXECUTIVE SUMMARY ... xi 1. INTRODUCTION ...1 1.1. Overview ...1 1.2. Research Objectives ...2 1.3. Research Background ...2 2. LITERATURE REVIEW ...3
2.1. Internal Traffic Control and Worker Safety ...3
2.2. Developing the Internal Traffic Control Plan ...4
2.3. Iowa DOT Work-Zone Safety and Mobility Process Review ...7
3. METHODOLOGY ...8
3.1. Qualitative Assessments ...8
3.2. Quantitative Assessments ...8
3.3. Pilot Project ...9
3.4. Justification for Mixed-Methods Research Approach ...9
4. DATA COLLECTION AND ANALYSIS ...12
4.1. Overview ...12
4.2. OSHA and Iowa OSHA Incident Rates ...12
4.3. Analysis of OSHA and Iowa OSHA Data Analysis ...16
4.4. Summary of OSHA and Iowa OSHA Data...20
4.5. Comparing National and Iowa Statistics ...21
4.6. Iowa DOT Crash Database Query ...22
4.7. Crash Narratives...25
4.8. Personal Interviews ...28
4.9. Ingress and Egress Survey ...32
4.10. Pilot Project ...33
5. CONCLUSIONS...35
5.1. OSHA and Iowa OSHA ...35
5.2. Iowa DOT Crash Database ...35
5.3. Incident Reports ...36
5.4. Ingress and Egress Survey ...37
5.5. Developing the Job-Site Communication Model ...38
5.6. Implementation Readiness and Recommendations ...41
5.7. Research Limitations ...42
5.8. Possible Future Research ...44
vi
APPENDIX C. EXAMPLES OF INNOVATIVE TECHNOLOGIES FOR FUTURE
IMPLEMENTATION ...53 APPENDIX D. SAMPLE INCIDENT REPORT ...55
LIST OF FIGURES
Figure 3.1. Research method diagram ...11
Figure 4.1. Iowa annual employment for highway, street, and bridge construction...13
Figure 4.2. Total recordable cases for highway, street, and bridge construction ...14
Figure 4.3. Cases with days away from work, job restriction, or job transfer for highway, street, and bridge construction ...15
Figure 4.4. Cases with days away from work, job restriction, or job transfer for highway, street, and bridge construction ...16
Figure 4.5. Linear fit for total recordable cases rate (national and Iowa) ...18
Figure 4.6. Linear fit for total recordable cases with days away from work, job restriction, or job transfer (national and Iowa) ...19
Figure 4.7. Linear fit for other recordable cases (national and Iowa)...20
Figure 4.8. Construction “zones” as defined by the Iowa DOT ...23
Figure 5.1. Sample job-site communication model ...38
Figure 5.2. Differing conditions communication model ...40
Figure 5.3. Communication model for major equipment delivery ...40
Figure C.1. Temporary rumble strips ...53
Figure C.2. Temporary signal lighting ...53
Figure C.3. Water-filled barrier system for interim term use ...54
LIST OF TABLES Table 4.1. Incidents by vehicle type and work zone location 2008 through 2011 ...25
Table 4.2. Summary of categorization of heavy equipment crash narratives ...26
Table 4.3. Description of categories for heavy equipment crash narratives ...27
Table 4.4. Summary of Ingress and Egress Survey results for “closed” and “open” work zones ...33
ACKNOWLEDGMENTS
This research was conducted under the Midwest Smart Work Zone Deployment Initiative (SWZDI) and the associated Federal Highway Administration (FHWA) Pooled Fund Study TPF-5(081), involving the following state departments of transportation:
Iowa (lead state)
Kansas
Missouri
Nebraska
Wisconsin
The authors would like to express their gratitude to the FHWA, the Iowa Department of
Transportation (DOT), the Midwest Transportation Consortium (MTC), and the SWZDI pooled fund state partners for their financial support and technical assistance.
EXECUTIVE SUMMARY Problem Statement
Construction work zones are among the most dangerous places to work in any industry in the world. This is because many factors in construction, such as constant change in working environments and driver errors, contribute to a workplace with a higher number of accidents, injuries, property damage, and other losses when compared to other industries. Construction safety practices are essential to preventing loss on a job site and should be monitored during every project stage.
Background
Regulatory agencies such as the federal Occupational Safety and Health Administration (OSHA) have efforts to prevent unsafe work conditions, but regulatory agencies can only inspect a small percentage of job sites due to lack of resources. Therefore, safety agencies have expanded to the state level within the last 20 years. Local departments of transportation (DOTs) are also tasked with keeping statistical data to communicate safety trends within their own states and districts. In addition to construction safety, work-zone mobility has a major effect on the safety of any highway construction job site and continues to be a topic of conversation for Iowa, Iowa DOT officials, utility companies, and contractors.
Highway construction sites differ from other construction sites in exposure to the traveling public, construction traffic, and heavy equipment. The safety of workers and project work zones are affected by nearly every person who is involved in the project. Managers and officials are tasked with developing site layouts and laborers and operators are held responsible for executing those plans. Without efforts from every individual level in the construction process, safety may be compromised.
To increase safety efforts, many perspectives must be considered to describe what is actually happening on job sites. A single set of data, in this case, will not suffice because of the nature of a highway construction site. It is very difficult to normalize data, make inferences on small sample sizes, and base policy on any one set of findings.
Several types of quantitative as well as qualitative assessments were performed in this study. Common conclusions that were discovered between multiple assessments allows for stronger conclusions, especially when a quantitative analysis is able to support a qualitative claim by experts.
xii Research Objectives
The objective of this research was to investigate the application of integrated risk modeling to internal traffic control and contractor operations in construction work zones. The ultimate goal is to reduce frequency and intensity of loss events related to equipment movement and contractor operations in and around construction work zones.
Research Methodology
Prior research funded by the Midwest Transportation Consortium (MTC) determined that using an integrated risk model could identify and mitigate potential hazards in construction work zones. Specifically, the integrated risk model could be adapted and expanded for use as a tool in managing internal traffic control, equipment movement and processes, and contractor operations more effectively.
To achieve the overall objective, the research team first did the following:
Identified potential risk factors
Evaluated loss severity
Identified risk mitigation strategies that can be used to reduce losses Justification for Mixed-Methods Research Approach
A mixed-methods approach was chosen given there are many difficulties that were encountered when setting up avenues to gather information that would help produce an outline of how activities on highway construction affect safety.
Qualitative and quantitative analyses were performed simultaneously with the intention of using each type to confirm or deny claims from the other method of research.
The quantitative research methods in this study included OSHA and Iowa OSHA statistics and analysis along with Iowa DOT crash database queries and analysis.
Qualitative research methods included the analysis of crash narratives, personal interviews with a range of construction personnel, an ingress and egress in construction work zones survey, and a work zone pilot project.
Literature Review
The literature review revealed many different ways to mitigate risk on highway construction projects. On a project level, workers and operators can train to be more aware of potentially-dangerous situations. On a city planner level, construction zones can be mapped and tracked to help mitigate effects of conflicting work zones.
The focus of this research project is to help mitigate risk on a project and managerial level. Policies and planning to help reduce risk and safety-related problems on these levels are of primary concern and are detailed in the final report.
Qualitative Assessments
To form a platform to conduct research on internal traffic control, work-zone safety, and
mobility, a technical advisory committee (TAC) was formed. The TAC members are considered experts in highway construction and maintenance operations, represent various levels of
management, and include local district managers and engineers. Quantitative Assessments
Human factors, in certain instances, can be measured and looked at quantitatively. The Iowa DOT maintains a crash database in which reporting officers from each jurisdiction submit incident forms for crashes. Each incident form that is filed has a multitude of variables that are considered when describing the incident.
Database variables that were considered relevant to this study include vehicle configuration, whether the incident was work-zone related, and the location of the incident within the work zone.
Statistics were broken down into a spreadsheet of each variable according to its “Case Number” and a random sample of the cases was further investigated by reviewing the narratives of the sample cases to look for any trends that were not identified in the crash database statistics. The narratives for each case provide a detailed description of the incident. Items that cannot be conveyed in the numerical data were included. Some examples of items that are included in these narratives are relative locations of vehicles, locations of exit and entrance ramps, and any other descriptive information that the reporting officer felt was important to the incident. This
information could only be used as a qualitative or descriptive statistic and, like information provided by the TAC, would be used only to guide further investigations.
Data that were published by OSHA and Iowa OSHA were also carefully considered in this study. Two sets of data are published by OSHA and Iowa OHSA each year. The first dataset includes recordable case counts for each type of industry and the second dataset includes incident rates for each type of industry. The incident rates are used in this study because they display a relative statistic that can be compared to national rates and rates that are achieved by other states. All of the statistical data considered in this study were obtained by means of empirical research. The most recent available data for OSHA and Iowa OSHA was 2010 and, for the Iowa DOT crash database, 2011. No means of theoretical research was considered in this study.
xiv Pilot Project
A pilot project was used in this study. The goal of the pilot project was to gain more insight as to how changes are performed within traffic control, how work-zone mobility concerns are
addressed, and how these items fit the “best practices” that are identified throughout this study. The pilot project that was identified for this study was the Interstate 29 Expansion and
Improvement project located in Sioux City, Iowa. Overall, the project includes widening the current interstate roadway, replacing several entry and exit ramps, and replacing several bridges. The focus of our study covers the Segment 1 portion that includes the widening of the current interstate system from four lanes to six lanes.
Key Findings
OSHA and Iowa OSHA
Based on the data provided by OSHA and Iowa OSHA, incident rates were compared using a linear regression model and an analysis of variance was performed for both sets of data. Given the category of highway, street, and bridge construction has a relatively small sample size for the total annual employment for Iowa, statistical variation was high in the Iowa data. Given a much larger population size is used for national incident rates, Iowa statistics can be compared to the linear model developed in this study.
In more than half the years included in the study, Iowa has had a higher incident rate in every major statistical category. These findings indicate that, due to many factors, Iowa is often a statistically more dangerous state to work in highway construction than the national average. This finding could be due to many factors, such as extreme weather conditions in both summer and winter, types of construction projects performed, or types of safety programs that are implemented. The exact factors causing the higher rate are not able to be identified in this study alone and are likely a source for future research.
One positive that can be identified is that models for both Iowa and national incident rates are downward sloping. The model for total recordable cases offers the best evidence that overall incident rates for Iowa are improving from year to year. The linear models also display similar slopes in the downward trends for each analysis that was performed.
Iowa DOT Crash Database
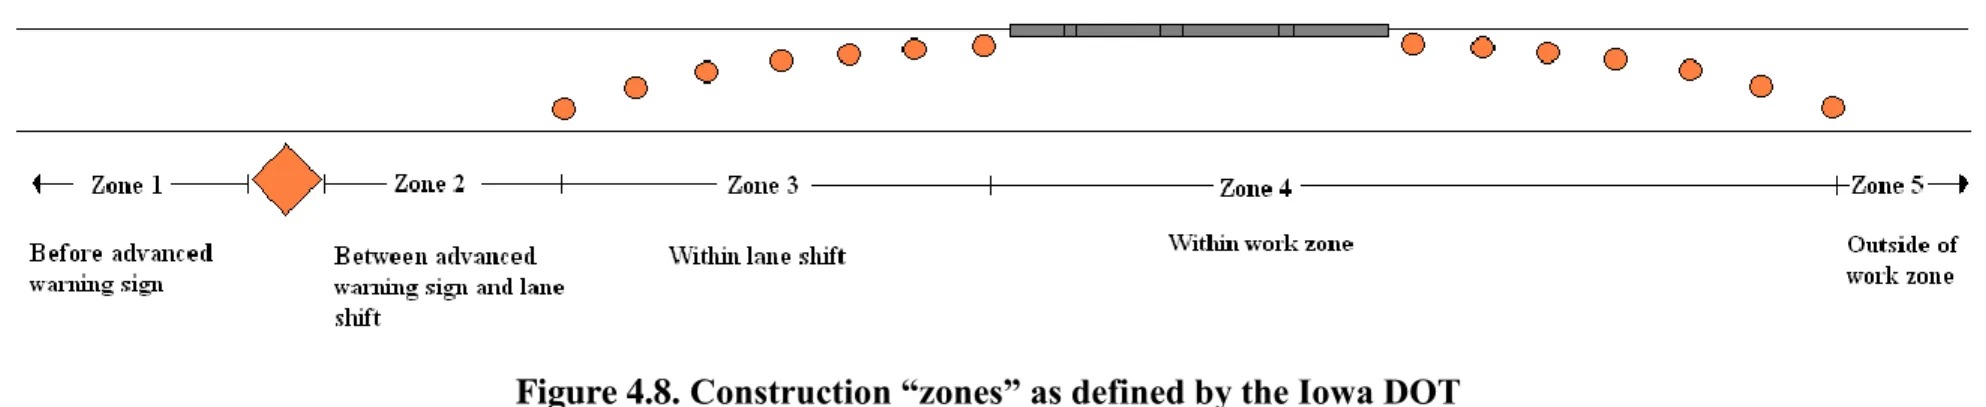
The Iowa DOT crash database provided a way to categorize incidents that are considered by a reporting officer to be work-zone-related:
Zone 1 – Before advanced warning sign
Zone 2 – Between advanced warning sign and lane shift Zone 3 – Within lane shift
Zone 4 – Within work zone Zone 5 – Outside of work zone
The TAC anticipated that the Zone 3 lane shift category was the cause for the most incidents and the most problematic area for heavy equipment. However, with the database query, the research team found not much difference between the number of incidents associated with Zones 2 and 3. Zone 2 had 42 incidents and Zone 3 had 37 incidents.
The significant majority of incidents occurring for heavy equipment are in Zone 4, accounting for 139 of the 229 total incidents. Zones 1 and 5 accounted for the fewest incidents for heavy equipment, but still account for 19 of the 229 total incidents.
The discrepancy between the experiences of the expert panel and the data provided by the Iowa DOT crash database serve as conflicting information in this study. In this case, further
examination must be considered when analyzing these data.
The discrepancy could be a due to many different factors. One possible contributing factor to the conflicting evidence is that reporting officers may not be identifying the Iowa DOT-defined zones in which a work-zone-related incident is occurring consistently or correctly. Training procedures on filling this section of the incident form may not be consistent between jurisdictions.
Another source of variance from the reporting officer may be that, given each highway construction project is unique, it would be difficult to identify comparable zones for each highway project.
Another likely factor for the significant majority of the incidents that occur in Zone 4 is the amount of exposure that the traveling public has in this zone. In a particularly long work zone, the relative sizes of Zones 3 and 4 may be drastically different. Zone 4 may not be any more dangerous than Zone 3 but, simply because Zone 4 accounts for a higher percentage of the overall job site length, it will have more incidents associated with it. This factor was identified as the most likely source of the discrepancy between expert panel experience and statistical data. Incident Reports
Due to the conflicting evidence presented by the TAC and the Iowa DOT crash database, individual incident narratives were analyzed to supplement previous evidence. These individual reports included detailed information about each incident.
Within these narratives, it became clear that the Iowa DOT zone in which each incident occurred was not the only cause that leads to each incident. From the narratives, it became clear that the types of incidents that were occurring may be just as critical as the location in which they are happening.
xvi
accounted for in the classification of the location of the incident in the crash database. The data pointed toward many of the incidents being caused by a typical Zone 3 activity.
The most relevant information that would need to appear in future incident reports is the location of the cause of the incident. This would allow for the analysis for the types of incidents to
coincide directly with the location of the cause of the incident rather than the location of the incident itself.
Ingress and Egress Survey
Through the assessment of the Ingress and Egress Survey, several conclusions can be made about addressing concerns on ingress and egress points on highway construction sites. Given all except one respondent was a DOT respondent from either Iowa or a surrounding state, inferences can only be made about the owner’s view of ingress and egress safety.
For the “closed” work zone, combining the counts for upgrade/additional equipment, markings and using correct, clean, and undamaged traffic control devices, nearly half of the responses address use of some type of equipment. Owners, and particularly inspectors, reported that improper use of traffic control equipment can be a major contributor that causes confusion for truck drivers, equipment operators, and the traveling public alike. Additional equipment and upgrading equipment often comes in the form of signage, arrow boards, message boards, and any other additional equipment that a contractor can provide to either protect the job site or
communicate with the traveling public.
This assessment is supported by the insights provided by the traffic control contractor in the personal interviews. In their previous experience, the more devices that are provided to grab the attention of drivers in either a divided highway or interstate highway construction project, the more aware that drivers will be and, in turn, the safer the project will be.
The second major category of responses for the survey addressed problems with ingress and egress by means of either extending distances for ingress and egress, so that drivers and operators are able to accelerate or decelerate, or providing an alternate route that is less
congested by the traveling public. If either of these techniques can be implemented on a project, they would certainly improve the interactions that truck drivers have with the traveling public. Not only can the safety of ingress and egress be improved by using alternate routes, items such as alternative delivery methods can be assessed on a project-specific basis to help minimize interactions and incidents involving the traveling public.
Many of the individual responses were very similar for addressing ingress and egress safety improvement from the survey with one exception. Many of the respondents provided many more unique answers for the “open” work zone. Individual answers did not agree as strongly on the “open” work zone improvements when compared to the “closed” work zone improvements. Typical “closed” work zones are often set up in a very similar manner from project to project. The same types of channeling devices, barriers, and other traffic control devices are used in most
“closed” work zones and standard traffic control plans are easier to implement. With an “open” work zone, many more unique situations that require an adapted traffic control plan are required. Developing the Job-Site Communication Model
Through the solicitation of personal interviews and the insight provided by the TAC, a Lines of Communication Model was developed.
More specifically, job-site communication models are a concept derived in this study from the combination of the interview with the ready mix plant operator and the common theme of effective communication that was found in the qualitative data collection interaction.
Included in the model are the roles of DOT officials, project managers, project forepersons, plant operators, equipment dispatchers, and equipment operators. Solid lines represent primary lines of communication and dashed lines represent secondary lines of communication.
In all highway construction projects, it is essential that lines of communication are thoroughly established and open. Conflicts often arise from parties not knowing whom to contact, or parties not forwarding relevant information to the proper people. Because of the volatility and ever-changing conditions of a job site, it must be noted that each model that is developed for a project must be flexible and adaptable to changes.
It is the responsibility of project managers and project forepeople to receive input from all relevant parties included in the operation. Ideally, models would be developed with specific names of personnel, their contact information, and a secondary contact in case the primary contact is not available.
Implementation Readiness and Recommendations
Implementation of recommended risk mitigation processes and strategies will be the
responsibility of the Iowa DOT and/or other transportation agencies. The possible mitigation techniques were developed as a part of the pilot project by using field observations and interviews with pilot project personnel.
OSHA and Iowa OSHA data should be used as a basis to compare safety on a statewide and national level. Metrics are difficult to provide within individual states; however, individual states should compare incident rates to national averages and push to keep the trend of decreasing incident rates. Iowa, in the past 15 years, has not proven to have lower incident rates than the national average and more often than not have reported statistically higher incident rates than the national average.
The Iowa DOT crash database has been an effective tool in analyzing incidents that are work-zone-related. At this time, incidents in the Iowa DOT Zone 4 within the work zone
xviii how contractors interact with the traveling public.
The methods in which reporting officers identify the location of an incident within the Iowa DOT’s defined Zones 1 through 5 in a work zone should be reviewed to ensure not only consistency in reporting, but also reporting of the Zone in which the cause of the incident occurred. In addition, the manner in which crash narratives are filled out for each incident is essential to identifying the major causes of each incident. Consistency is of the upmost importance when trying to normalize this data.
Ingress and egress areas on construction job sites, as expressed by the TAC and during personal interviews, represent the most challenging areas to address work-zone safety and mobility. Although these areas do not represent the highest frequency of incidents, they were cited consistently by contractors, truck drivers, and Iowa DOT personnel throughout this study as the most difficult areas to control. Additional measures in preconstruction planning could provide additional work-zone safety and serve as a time to discuss alternate methods of ingress and egress. This planning can be done not only for vehicles, but for material
deliveries as well.
Personal interviews with experts of various technical backgrounds are essential to formulate the basis of highway construction research. Given highway construction is such a dynamic industry subjected to so many unique project-level difficulties, it is difficult to normalize data. A mixed-methods approach, where qualitative assessments are used, is valuable to confirm conclusions that are found. These same methods should also be used to identify and address discrepancies between common conceptions of highway construction safety and conclusions that statistical data provide.
Effective job-site communication was a theme that was encountered in almost every stage of this research project. More specifically, the individual interactions between plant operators, dispatch, forepersons, and drivers are the most crucial interactions that pertain to on-the-job work-zone safety and internal traffic control. To support these interactions, effective training programs and project-specific communication models should be developed so that roles and responsibilities of each party are clear.
Per the pilot project, contractors have the ability to make major changes to internal traffic control plans as well as address how work-zone vehicles interact with the traveling public. Alternative plans, although not always implemented, should always be considered if a potential for improvement in safety, productivity, or cost-effectiveness can be realized. Construction means and methods should be analyzed comparatively with the ability of contractors as well as DOT officials to be flexible in implementing traffic control plans. Research Limitations
The Conclusions chapter details limitations of this research project. Possible Future Research
Future research is often identified by the limitations or findings of previous research. Work-zone safety, mobility, and internal traffic control comprises a vast spectrum of topics that involve wide varieties of personnel, all of whom have an effect on project success. This project was framed
around personal interviews with expert panel members and the analysis of general statistical data.
Normalizing Iowa DOT crash data with relation to mileage would be an important statistical backing feature that would help eliminate some of the ambiguities presented by the findings in this study.
Data for Zones 1 through 5 of the work zone are difficult to compare given relative lengths are extremely different within each zone and are unique to each job site. Normalizing this data would include collecting data that indicates the length of each zone for either every highway construction project or a representative sample of every highway construction project performed in a given year. Having this data would help to confirm or deny specific claims about which Iowa DOT Zone is the most dangerous and problematic for highway contractors.
An investigation in how reporting officers classify work-zone-related incidents would be
valuable to perform, as well, given the discrepancies discovered in this study. Inconsistencies in how each Iowa DOT Zone is identified in individual incident reports may be a cause of some of the conflicting evidence in how work-zone-related incidents are reported.
A second source of inconsistencies lies in the way reporting officers fill out incident narratives. In certain cases, a very thorough narrative was discovered and the cause of the incident was very easy to identify and assign a classification. However, on the other end of the spectrum, a
narrative was not provided for certain incidents at all, which led to the inability to classify the incident. Without consistent reporting from all jurisdictions, it is difficult to normalize data and therefore is difficult to analyze data statistically because of these limitations.
An extensive program-level safety implementation project would likely be of interest to build on the findings of this project. For example, a project related solely to ingress and egress on
construction sites could provide research topics for future studies. From program-level
implementation, a standardized mentoring program for drivers, operators, and laborers could also be explored.
1. INTRODUCTION 1.1. Overview
Construction work zones are among the most dangerous places to work in any industry in the world. This is because many factors in construction, such as constant change in working environments and driver errors, contribute to a workplace with a higher number of accidents, injuries, property damage, and other losses when compared to other industries. Construction safety practices are essential to preventing loss on a job site and should be monitored during every project stage.
Regulatory agencies such as the federal Occupational Safety and Health Administration (OSHA) have efforts to prevent unsafe work conditions, but regulatory agencies can only inspect a small percentage of job sites due to lack of resources. Therefore, safety agencies have expanded to the state level within the last 20 years. Local departments of transportation (DOTs) are also tasked with keeping statistical data to communicate safety trends within their own states and districts. In addition to construction safety, work-zone mobility has a major effect on the safety of any highway construction job site and continues to be a topic of conversation for Iowa, Iowa DOT officials, utility companies, and contractors.
Highway construction sites differ from other construction sites in exposure to the traveling public, construction traffic, and heavy equipment. The safety of workers and project work zones are affected by nearly every person who is involved in the project. Managers and officials are tasked with developing site layouts and laborers and operators are held responsible for executing those plans. Without efforts from every individual level in the construction process, safety may be compromised.
To increase safety efforts, many perspectives must be considered to describe what is actually happening on job sites. A single set of data, in this case, will not suffice because of the nature of a highway construction site. It is very difficult to normalize data, make inferences on small sample sizes, and base policy on any one set of findings.
Several types of quantitative as well as qualitative assessments were performed. Common conclusions that were discovered between multiple assessments allows for stronger conclusions, especially when a quantitative analysis is able to support a qualitative claim by experts.
Work-zone safety, mobility, and internal traffic control are addressed by nearly every state DOT and many policies are available for review in the Federal Highway Administration (FHWA) databases. Even with this accumulation of significant information, highway construction is still one of the most dangerous industries in the US.
2 1.2. Research Objectives
The objective of this research was to investigate the application of integrated risk modeling to internal traffic control and contractor operations in construction work zones. The ultimate goal is to reduce frequency and intensity of loss events related to equipment movement and contractor operations in and around construction work zones. To achieve the overall objective, the research team first did the following:
Identified potential risk factors
Evaluated loss severity
Identified risk mitigation strategies that can be used to reduce losses
Implementation of recommended risk mitigation processes and strategies will be the
responsibility of the Iowa DOT and/or other transportation agencies. The possible mitigation techniques were developed as a part of the pilot project by using field observations and interviews with pilot project personnel.
1.3. Research Background
Prior research funded by the Midwest Transportation Consortium (MTC) determined that using an integrated risk model could identify and mitigate potential hazards in construction work zones. Specifically, the integrated risk model could be adapted and expanded for use as a tool in managing internal traffic control, equipment movement and processes, and contractor operations more effectively.
This research examines how an integrated risk model approach could be used as a tool for
reducing exposure to hazards associated with internal traffic control and contractor operations on major projects in Iowa.
2. LITERATURE REVIEW
The literature review revealed many different ways to mitigate risk on highway construction projects. On a project level, workers and operators can train to be more aware of potentially-dangerous situations. On a city planner level, construction zones can be mapped and tracked to help mitigate effects of conflicting work zones.
The focus of this research project is to help mitigate risk on a project and managerial level. Policies and planning to help reduce risk and safety-related problems on these levels are of primary concern.
2.1. Internal Traffic Control and Worker Safety
The Roadway Safety Alliance (RSA) cited that the number one cause of worker fatality in the work zone is the backing of vehicles (The Roadway Safety Alliance 2008). There are several reasons why this is occurring. The RSA cites that the included safety measures such as back-up alarms are not always able to prevent incidents with pedestrian workers. This can be caused by alarms that are not working or a noisy job site that has alarms on several pieces of equipment so that workers cannot identify where vehicles are within their vicinity because of the multiple sound sources.
The Laborers’ Health and Safety Fund of North America (LHSFNA) reported that highway construction had high rates of fatal injuries in highway construction compared to other construction activities and to all other industries zones (Laborers Health and Safety Fund of North America 2004). This same report also found that backing equipment, particularly dump trucks, accounted for half of the fatalities of pedestrian workers in work zones.
In Iowa, there are an average of 6.5 deaths per year, 136 injury crashes, and 224 property damage only (PDO) crashes, totaling an average of 366 work-zone crashes per year. Ninety percent of Iowa work-zone fatalities are motorists (Shane et al. 2009).
Effective internal traffic control plans (ITCPs) may help prevent deaths and injuries inside the work zone. The LHSFNA explored the dangers of internal hazards in work zones. They found that just as many workers were being injured or killed by incidents within the work zone as by the traveling public (Laborers Health and Safety Fund of North America 2004). When
developing an ITCP, the following should be considered:
Reduce the need for vehicles to back up
Limit the access points to the job site or work zone
Establish work-zone layouts according to the type of equipment involved
4
The Roadway Safety Alliance also in their 2008 publication helped to develop a simple template for developing traffic control plans. Included in it are sample ITCPs for using spotters
effectively, types of signage that should be used within the work zone, and also plans that specify exact No Pedestrian Zones to help prevent incidents between workers that are on the ground and mobile equipment. Not only are there No Pedestrian Zones included in these plans, several plans are shown with No Motor Vehicle signs as well to help designate safe areas for pedestrian workers.
2.2. Developing the Internal Traffic Control Plan
The responsibility of developing the ITCP lies with the contracting agency on the project. Guidelines for developing an ITCP include the following:
The ITCP is developed by one or more members of the contracting staff and should be part of the overall project safety plan
The ITCP should be prepared after the contract is awarded but prior to the start of construction
The safety officer, if qualified, should be in charge of the development of the ITCP
This officer should meet the OSHA requirements of a “competent person” (Graham et al. 2005)
Establishing personnel and their responsibilities, along with identifying common strategies that can be used on projects, is very important and can lead to consistent internal traffic control planning. However, on significant multi-year projects, a much larger framework must be developed to ensure safe and consistent practices.
Significant repair and replacement projects in Oregon have led Oregon DOT (ODOT) officials to re-think the process of developing traffic management plans (TMPs) for their highway and bridge construction projects. Given there was a large overhaul of highway systems that would affect major travel routes, freight travel became a significant priority in ODOT TMPs.
In the past, ODOT first designed projects and then addressed traffic control and mobility. In their new approach, ODOT considers mobility conflicts in the same way that it addresses
environmental issues, by addressing problems throughout the design process (Oregon Department of Transportation 2011).
ODOT has developed TMPs on three different levels to address mobility problems:
Program-Level: Address traffic management at higher levels and provide a framework for the corridor-level TMPs
Corridor-Level: Traffic plans that are developed for specific key freight and major travel routes and if delay thresholds are exceeded, major reviews of staging, scheduling, and traffic management strategies are conducted
Project-Level: Used to address problems on single projects, developed based on individual project details, and also used to coordinate multiple projects in a localized area
When evaluating internal traffic control and work-zone mobility it is important to identify practices and research within policies and procedures of governing bodies. Items such as processes in internal traffic control changes, addressing concerns and updating the Manual on Uniform Traffic Control Devices (MUTCD), and work-zone safety and mobility reviews are the key to addressing an ever-evolving highway construction zone.
Several provisions were made to the MUTCD (2003 Edition) to address mobility concerns. Included in the provisions were “E. Activity Area – Planning the internal work activity area to minimize backing-up maneuvers of construction vehicles should be considered to minimize exposure to risk.” and “F. Worker Safety Planning – A competent person designated by the employer should conduct a basic hazard assessment for the work site… (to) determine whether engineering, administrative, or personal protection measures should be implemented.” These provisions were made to address risks that were not identified specifically with regards to internal traffic control and worker mobility already (Graham et al. 2005).
A competent person is defined by ODOT and OSHA alike in that they should be “one who is capable of identifying existing and predictable hazards in the surroundings or working conditions which are unsanitary, hazardous, or dangerous to employees, and who has authorization to take prompt corrective measures to eliminate them” (OSHA 2012).
The Midwest Research Institute published a six-step ITCP development guide to address concerns in asphalt paving that can also be applied to other highway work-zone operations: 1. Review contract documents and model plans
2. Determine construction sequence and choose phases having site-specific ITCPs 3. Draw the basic work area layout
4. Plot pedestrian and vehicle paths
5. Locate utilities, storage, and staging areas 6. Prepare internal traffic control plan notes
Also conducted in this 2005 study were observations of paving operations. Conclusions derived from these operations include the following:
The ITCP is a graphical method to inform vehicle operators and pedestrian workers of hazards inside the work area. The provision of an ITCP would have reduced hazards and observed conflicts at all four paving sites observed.
A competent person was not available during all paving operations. The safety officer either was absent or visited the site for a very short time.
Safety plans were generic and not specific to any of the sites.
Truck drivers were often confused about how to access the site and most could not communicate with spotters, forepersons, or plant operators.
6
As developments occur and concerns are addressed on a national scale, individual state DOTs are always implementing new technologies to help improve work-zone interactions. A few of the most-innovative technologies that have been very effective are ones that help contractors and utility workers coordinate work.
The City of Baltimore, Maryland has implemented a software-based system to help reduce impacts on construction projects that affect the traveling public’s right-of-way. The system they used was implemented over a two-year period and provides real-time information on
infrastructure projects around the city (City of Baltimore 2011).
Included in the software are maps that show key details such as scope, location, schedule, costs, and major points of contact for individual projects. Three major stakeholders were included when addressing the needs of the system: Mayor’s Office, City of Baltimore staff, and utility companies.
Benefits that were found in implementation included the following:
Stakeholder engagement was improved: Awareness of each of the parties involved in all of the projects was vastly increased and with information provided proactively, there is less time wasted in trying to make individuals aware of project information
Awareness of project impacts and enhancement of TMPs: The city is able to better predict impacts of construction because of the early identification of project details
Increased data quality: Stakeholders are willing to contribute data from their own systems to better manage Baltimore’s infrastructure network
Longer pavement life: Reduction of the number of pavement cuts has led to an increase in pavement quality and significant cost savings have been realized in the form of better coordinated work, which allows for more seamless production
As of October 2011, the New York City DOT (NYCDOT) began using an online construction mapping system, guidance manuals, and incentive programs to help improve coordination of construction (New York City Department of Transportation 2011).
Agreements were established on the monthly sharing of data between contractors, utilities, and the city. These data include all active NYCDOT street excavation permits, NYC’s list of
“protected streets,” and the NYCDOT roadway resurfacing schedule, which includes short-term utility needs and long-term utility project schedules.
The information is shared on the city’s public online map called NYCityMap, which allows utility companies and contractors alike to identify current construction projects to coordinate work better.
The Pennsylvania DOT (PennDOT) is implementing technologies similar to those being used in Baltimore and New York City. Allegheny County was the first in the state to use mapping of construction projects to help coordinate efforts in both construction and utility work (Envista
2009). This system has helped warn DOT officials of potential conflicts of concurrent
construction projects and has helped prevent many instances of re-work. This software is called Envista and is currently used in Baltimore, Colorado Springs, Sacramento, and Providence (Rhode Island).
2.3. Iowa DOT Work-Zone Safety and Mobility Process Review
A process review was conducted to address potential concerns with Iowa DOT Work Zone Policy with regards to 630 Subpart J (Work-Zone Safety and Mobility), 630 Subpart K (Temporary Traffic Control Devices), and 634 (Worker Visibility). In a 2011 survey, of 52 states/divisions, 85 percent had conducted a similar work-zone process review since 2009. The final report was completed on September 7, 2010. Following are the findings of the review and the proposed solutions:
1. After reviewing existing TMPs, it appears some district and central office staff need assistance in developing effective TMPs for significant projects.
Solution: The Division Office requested assistance from the Office of Transportation Operations and training workshops were conducted May 18-19, 2010 in eastern Iowa and May 20-21, 2010 in central Iowa.
2. After receiving TMPs from district offices, it appears that there is no format for Iowa DOT staff to aid in the development of comprehensive TMPs for significant projects.
Solution: A draft TMP template will be piloted on projects in December 2010 with a final template in place by April 2011.
3. Some TMPs were created but the electronic copies were not able to be located when requested. The Iowa DOT does not have a standardized electronic storage location for significant project files, including TMPs and supporting documentation.
Solution: The Information Technology Division will add folders under the project directory folders on the local area network (W: drive) for significant project files, including TMPs and supporting documentation by January 2011.
4. While exceptional training is provided to those who install, maintain, and inspect temporary traffic control in the field, training for those who design temporary traffic control plans is not available.
Solution: ATSSA’s Traffic Control Supervisor course will be brought in for Iowa DOT employees and others who instruct the work-zone safety workshops by January 2011. ATSSA’s Traffic Control Design Specialist course will be brought in from Iowa DOT staff and consultants involved in the design of temporary traffic control plans by May 2011.
8 3. METHODOLOGY
3.1. Qualitative Assessments
To form a platform to conduct research on internal traffic control, work-zone safety, and mobility, a technical advisory committee (TAC) was formed. The following Iowa DOT staff members were included: Mark Bortle, Doug Clark, Dean Herbst, Mark Jackson, Dwight Jenkins, Roxanne Seward, John Smythe, and Dan Sprengler. These individuals are considered experts in highway construction and maintenance operations, represent various levels of management, and include local district managers and engineers.
Also included in the TAC were three representatives from contracting agencies: Steve Jackson, president of Cedar Valley Corp.; Craig Hughes, vice president of Field Operation for Cedar Valley Corp.; and Robert Cramer, president of Cramer and Associates, Inc.
The TAC supported the research team in initial research direction, provided further insight into highway construction, reviewed initial findings, and provided feedback. The committee was gathered on two separate occasions and was consulted throughout the project on incremental findings of this study.
Personal interviews were conducted with construction personnel ranging from Iowa DOT staff to heavy equipment operators. The people who were interviewed included Jason Hankins, project manager for Cedar Valley Corp.; Jeff Koudelka, vice president of Iowa Plains Signing Inc.; Roxanne Seward, traffic technician for District 3 of the Iowa DOT; and Dave Webb, plant operator for Central Iowa Ready Mix. These individuals were identified by the TAC as relevant sources to provide insight to job site conditions and how they relate to work-zone safety and mobility.
The types of interviews conducted were Informal Conversation Interview and General Interview Guide. These two interview types were best suited due to the range of construction experience of those interviewed and the differing topics that were covered in each interview. (Standardized, Open-Ended Interview and Closed, Fixed-Response Interview types were not used, given it was not intended to compare results to a standardized set of questions. These two styles of interview are also not conducive to follow up questions, which were essential in the interview process.) 3.2. Quantitative Assessments
Human factors, in certain instances, can be measured and looked at quantitatively. The Iowa DOT maintains a crash database in which reporting officers from each jurisdiction submit incident forms for crashes. Each incident form that is filed has a multitude of variables that are considered when describing the incident.
Database variables that were considered relevant to this study include vehicle configuration, whether the incident was work-zone related, and the location of the incident within the work zone. These variables and their descriptions are included in Appendix A.
Statistics were broken down into a spreadsheet of each variable according to its “Case Number” and a random sample of the cases was further investigated by reviewing the narratives of the sample cases to look for any trends that were not identified in the crash database statistics. The narratives for each case provide a detailed description of the incident. Items that cannot be conveyed in the numerical data are included. Some examples of items that are included in these narratives are relative locations of vehicles, locations of exit and entrance ramps, and any other descriptive information that the reporting officer feels is important to the incident. This
information then can only be used as a qualitative or descriptive statistic and, like information provided by the TAC, would be used only to guide further investigations.
Data that were published by OSHA and Iowa OSHA were also carefully considered in this study. Two sets of data are published by OSHA and Iowa OHSA each year. The first dataset includes recordable case counts for each type of industry and the second dataset includes incident rates for each type of industry. The incident rates are used in this study because they display a relative statistic that can be compared to national rates and rates that are achieved by other states. All of the statistical data considered in this study were obtained by means of empirical research. The most recent available data for OSHA and Iowa OSHA was 2010 and, for the Iowa DOT crash database, 2011. No means of theoretical research was considered in this study.
3.3. Pilot Project
A pilot project was used in this study. The goal of the pilot project was to gain more insight as to how changes are performed within traffic control, how work-zone mobility concerns are
addressed, and how these items fit the “best practices” that are identified throughout this study. The pilot project that was identified for this study was the Interstate 29 Expansion and
Improvement project located in Sioux City, Iowa. Overall, the project includes widening the current interstate roadway, replacing several entry and exit ramps, and replacing several bridges. The focus of our study covers the Segment 1 portion that includes the widening of the current interstate system from four lanes to six lanes.
3.4. Justification for Mixed-Methods Research Approach
A mixed-methods approach was chosen given there are many difficulties that were encountered when setting up avenues to gather information that would help produce an outline of how
10
One method of collection for a single research topic is to gather information reported by highway construction contractors on incidents to insurance providers to determine the interactions within the construction site. However, this is not a practical solution for this research provided that construction companies and insurance companies are often hesitant to report this type of information because of its sensitive nature.
Therefore, for this project, broader statistics, such as gathering OSHA information, must be relied upon in conjunction with qualitative data, such as personal interviews or analysis of specific incident reports.
Data from within the work zone on the construction site is provided by OSHA and Iowa OSHA statistics. This information provides the quantitative data and supports the other statistical analysis. The OSHA and Iowa OSHA data provides information on all accidents that happen within a job site. These reported accidents include those that involve construction equipment and vehicles as well as falls, electrocution, and other job site accidents.
With the Iowa DOT crash database, information about the traveling public can be compiled by the task of a database query with selected variables. A major gap, however, surfaces in how the traveling public interacts directly with construction vehicles. As it is detailed later for this study, a survey was designed to address concerns with ingress and egress areas in work zones. These areas were to be the final piece of the puzzle to show how internal traffic control, safety, and mobility could be addressed.
Due to limitations of the quantitative data, the research also relies on qualitative assessments, a questionnaire, and TAC meetings to support the quantitative assessments. The mixed-methods research approach was best suited to address the concerns that were associated with the
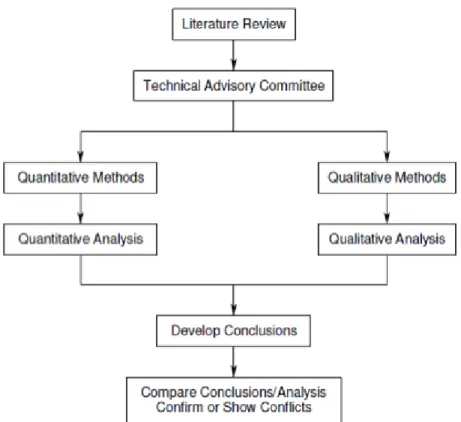
quantitative data and were implemented as such in this study. The overall research methodology is summarized in Figure 3.1.
Figure 3.1. Research method diagram
This figure is a method diagram that illustrates which tasks were performed and in what order. Qualitative and quantitative analyses were performed simultaneously with the intention of using each type to confirm or deny claims from the other method of research.
The quantitative research methods in this study include OSHA and Iowa OSHA statistics and analysis along with Iowa DOT crash database queries and analysis.
Qualitative research methods include the analysis of crash narratives, personal interviews with a range of construction personnel, an ingress and egress in construction work zones survey, and the pilot project.
12 4. DATA COLLECTION AND ANALYSIS 4.1. Overview
Data collection or compilation is essential to a research project and data must be analyzed carefully. Data can be presented in many different ways as explained in the previous methodology chapter.
The quantitative data in this study includes descriptive statistics from the Iowa DOT crash database, statistics released by OSHA, and statistics released by Iowa OSHA. Qualitative data included TAC reviews, personal interviews, ingress and egress survey results, and crash incident narrative summaries.
Also within any study, a thorough data analysis must be performed to ensure that conclusions can be provided and that inferences about data can be either confirmed or rejected. Some of the data that is included in this study can be analyzed statistically using typical analysis of variance testing and others by observational comparison. Items that were addressed in both the TAC meetings and personal interviews can only be used to confirm or show difference between perception in work-zone safety and mobility and statistical findings.
Statistical results that coincide with claims by either the expert panel or claims made during personal interviews offer strong evidence of patterns in highway construction safety and
mobility. The claims identified, when backed by both statistics and expert knowledge, are said to be triangular in nature. However, when encountering statistical evidence that is contrary to expert panel or interview claims, an anomaly occurs.
4.2. OSHA and Iowa OSHA Incident Rates
OSHA produces annual safety reports on nearly every type of industry in the US and uses incident rates to serve as a baseline for states to compare to national averages. These national averages incorporate all hours worked by all states.
Incidence rates represent the number of injuries and illnesses per 100 full-time workers and were calculated as follows:
(N/EH) x 200,000 where:
N = number of injuries and illnesses
EH = total hours worked by all employees during the calendar year
200,000 = base for 100 equivalent full-time workers (working 40 hours per week, 50 weeks per year).
Figure 4.1 shows the Iowa OSHA annual highway, street, and bridge construction employment data (in thousands of hours) for 1996 through 2010 (accessible from
http://www.bls.gov/iif/state_archive.htm#IA).
Figure 4.1. Iowa annual employment for highway, street, and bridge construction The data are reported in thousands of hours. Annual employment is an aggregation of all construction operations within the state of Iowa that are not considered building or other civil construction (Bureau 2011).
Figure 4.2 compares incident rates (calculated as shown on the first page of this chapter) for total recordable cases in each given year.
0 1 2 3 4 5 6 1996 1997 1998 1999 2000 2001 2002 2003 2004 2005 2006 2007 2008 2009 2010 A n n u al E m p lo ym e n t (Th o u san d s o f h o u rs) Year
Iowa Annual Employment
14
Figure 4.2. Total recordable cases for highway, street, and bridge construction Items that are considered recordable by OSHA and Iowa OSHA standards include incidents involving death, loss of consciousness, days away from work, restricted activity or job transfer, and any incident that requires medical treatment beyond first aid. Cases that involve an incident of death are not included in Figure 4.2.
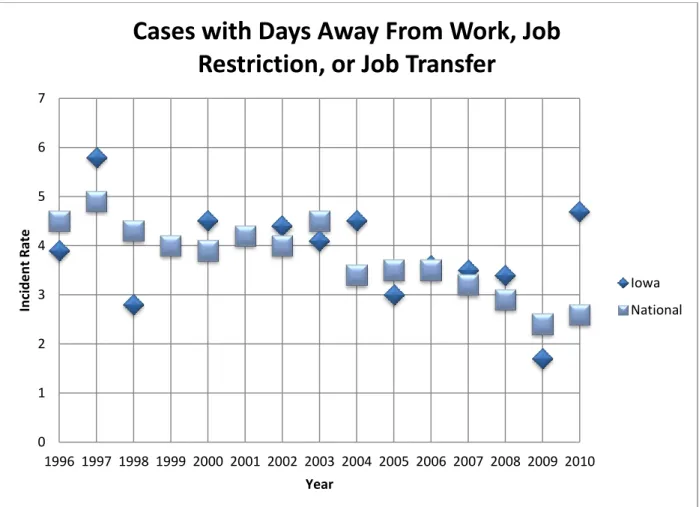
Figure 4.3 compares incident rates (calculated as shown on the first page of this chapter) for cases with days away from work, job restriction, or job transfer in each given year.
0 2 4 6 8 10 12 14 1996 1997 1998 1999 2000 2001 2002 2003 2004 2005 2006 2007 2008 2009 2010 In ci d e n t R ate Year
Total Recordable Cases
Iowa National
Figure 4.3. Cases with days away from work, job restriction, or job transfer for highway, street, and bridge construction
Cases that involve an incident where a death occurred are not included in Figure 4.3.
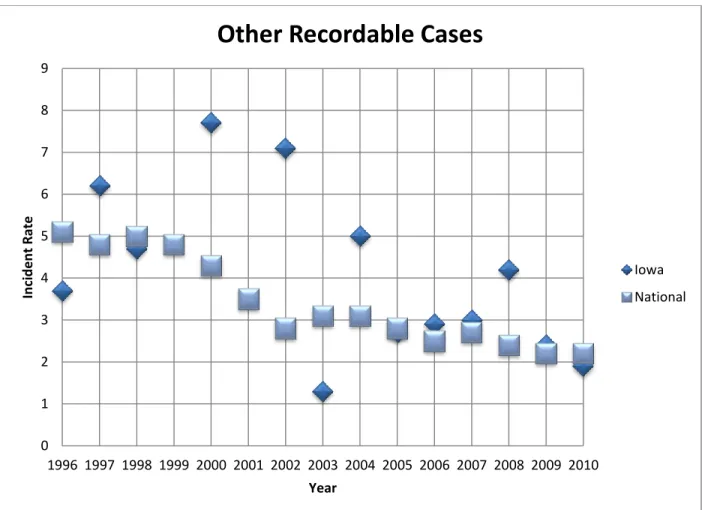
Figure 4.4 compares incident rates (calculated as shown on the first page of this chapter) for other recordable cases.
0 1 2 3 4 5 6 7 1996 1997 1998 1999 2000 2001 2002 2003 2004 2005 2006 2007 2008 2009 2010 In ci d e n t R ate Year
Cases with Days Away From Work, Job
Restriction, or Job Transfer
Iowa National
16
Figure 4.4. Cases with days away from work, job restriction, or job transfer for highway, street, and bridge construction
Other recordable cases include incidents with injuries or illnesses not severe enough for job restriction, job transfer, or days away from work.
It is important that Iowa use these metrics effectively to help reduce incidents within its own boundaries. If statistics such as these are ignored, it can be detrimental to the identification of major problems within the highway construction industry in Iowa. As the national standard in safety enforcement, these statistics provide the best snapshot of how each state is doing on the whole with regards to safety in industry.
4.3. Analysis of OSHA and Iowa OSHA Data Analysis
Data collection for highway, street, and bridge construction began in 1996 for Iowa OSHA and most recent data dates to 2010. This dataset includes information on incident rates for total recordable cases; total cases with days away from work, job restriction, or job transfer; and other recordable cases. Years that were not included in either statistical model were 1999 and 2001. Data for these years were not included only for Iowa, but were considered for national rates.
0 1 2 3 4 5 6 7 8 9 1996 1997 1998 1999 2000 2001 2002 2003 2004 2005 2006 2007 2008 2009 2010 In ci d e n t R ate Year
Other Recordable Cases
Iowa National
Linear regression models were performed for each of these categories to compare Iowa incident rates to national incident rates. A 95 percent confidence level was used for both the regression fit and the individual value range. It must be noted that Iowa data is included in the national data. Given it represents an extremely small percentage of the total national annual employment, it was determined that it would not affect the national linear models.
As seen in Figures 4.5 through Figure 4.7, a 95 percent confidence level is displayed for both the model and the individual value ranges. The darker ranges represent the linear model confidence interval, whereas the lighter ranges represent the individual value confidence ranges.
The model confidence interval can be interpreted in that the actual predictive linear model has a 95 percent chance of falling within the range provided. The individual value confidence interval can be interpreted in that actual individual values for incident rates for any given year have a 95 percent chance of falling within the range provided without being considered outliers.
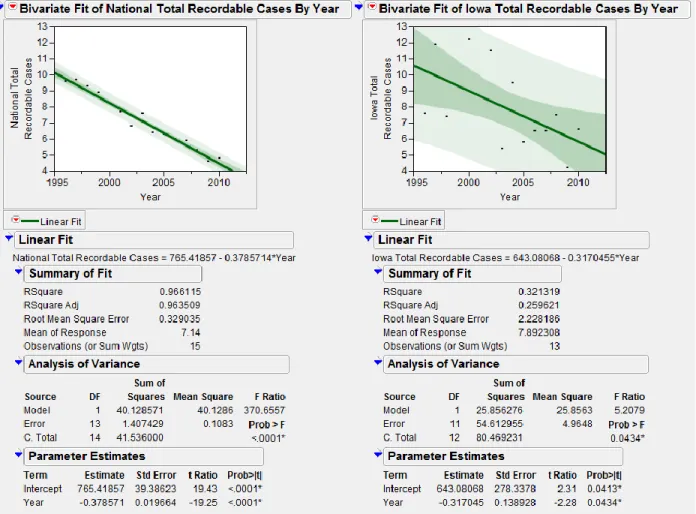
Figure 4.5 includes the JMP version 8 output of an analysis of variance test as well as a linear regression model for national and Iowa rates for total recordable cases (JMP is statistical analysis software that is used in this study to perform both the linear model analysis and analysis of variance tests.)
18
Figure 4.5. Linear fit for total recordable cases rate (national and Iowa) When analyzing the national yearly rates, there is a clear downward trend with a very tight confidence interval. The coefficient of determination of the national data is extremely high at 0.966, which means that the linear model of [Recordable Case Rate = (756.42) – (0.379 * Year)] is a very accurate and predictive model.
Iowa yearly rates, however, are not as readily able to predict an accurate yearly rate for total recordable cases. With an R-square value of 0.321, the model is a very poor predictor of total recordable cases. This model also has a standard error that is seven times as large as the national rate. Because of this, there is such a large overlap that it cannot be said that the two models are significantly different.
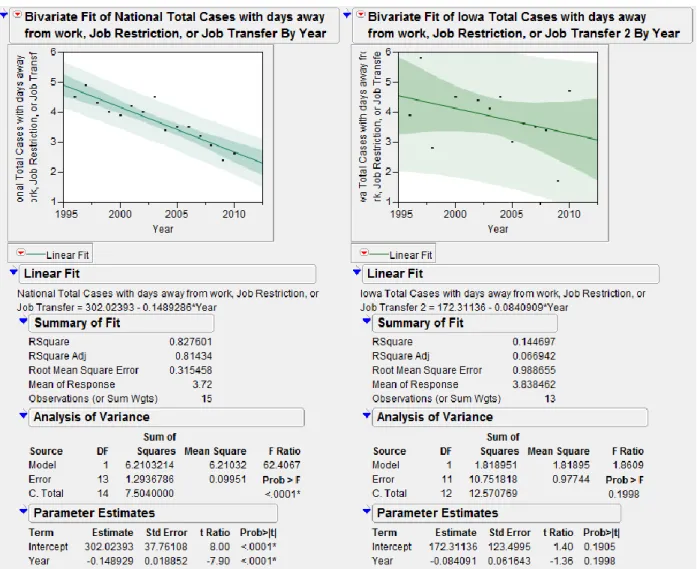
Figure 4.6 includes the JMP version 8 output of an analysis of variance test as well as a linear regression model for national and Iowa rates for cases with days away from work, job restriction, or job transfer.
Figure 4.6. Linear fit for total recordable cases with days away from work, job restriction, or job transfer (national and Iowa)
When analyzing the national yearly rates, there is a clear downward trend with a very tight confidence interval. The coefficient of determination of the national data is high at 0.828, which means that the linear model of [Recordable Case Rate = (302.02) – (0.149 * Year)] is an
accurate and predictive model.
Iowa yearly rates, however, are not as readily able to predict an accurate yearly rate for cases with days away from work, job restriction, or job transfer. With an R-square value of 0.145, the model is a very poor predictor of cases with days away from work, job restriction, or job transfer. This model also has a standard error that is three times as large as the national rate. Because of this, there is such a large overlap that it cannot be said that the two models are significantly different.
20
Figure 4.7. Linear fit for other recordable cases (national and Iowa) When analyzing the national yearly rates, there is a clear downward trend with a very tight confidence interval. The coefficient of determination of the national data is high at 0.893, which means that the linear model of [Recordable Case Rate = (459.82) – (0.228 * Year)] is a very accurate and predictive model.
Iowa yearly rates, in this case as well, are not as readily able to predict an accurate yearly rate for other recordable cases. With an R-square value of 0.306, the model is a poor predictor of other recordable cases. This model also has a standard error that is five times as large as the national rate. Because of this, there is such a large overlap that it cannot be said that the two models are significantly different.
4.4. Summary of OSHA and Iowa OSHA Data
When analyzing the predictive models using a linear regression in this chapter, it is found that it is extremely difficult to identify the source of the large variances within the Iowa OSHA data. There is a lot of statistical “noise” in the Iowa OSHA data that is likely attributed to having a smaller sample size than that of national levels.