ISSN: 2336-0992
Comparative Analysis of Exudates Detection from
Retinal Image with Effective Preprocessing Method
Nita Nimbarte, Milind Mushrif
Yeshwantrao chavan College of Engineering, Electronics & Telecommunication Department, Nagpur, India Email: [email protected], [email protected]
ABSTRACT
The most primal sign of Diabetic Retinopathy is exudates. Detecting the exudates at an earlier stage can prevent the vision loss. In this paper, we propose an efficient preprocessing algorithm, to enhance the contrast between background and exudates area. For feature extraction demonstrated Kirsch and Linde-Buzo-Gray (LBG) clustering method. The proposed algorithm is tested on the publically available DIARETDB1 database. Due to its distinguishing performance measures, the proposed method has been successfully applied to images of variable quality. Receiving operating curve (ROC) and weighted error rate (WER) which shows that the performance of our method is effective to detect exudate in the retinal image.
KEYWORDS
Retinal Image – Exudate Detection – Kirsch method – LBG Clustering method – Morphological operation
1. Introduction
Diabetic Retinopathy (DR) is a severe and widely spread eye disease. Exudates are one of the primary signs of DR. Exudates represent accumulations of lipid and protein. They are typically bright, reflective, white or cream colored lesions seen in the retina. They indicate increased vessel permeability and an asso-ciated risk of retinal edema. If this occurs in the macula, then, it will result in a lack of vision. Although not sight threaten-ing, they are a marker of fluid accumulation in the retina and if they are seen close to the macula center are considered sight threatening lesions. They are commonly seen in association with microaneurysms which have increased leakage such that the classical lesion is a circular ring of exudates with several microaneurysms at its center. Figure 1 shows an example of the exudates detection of the Diabetic Retinopathy [1]. In the resul-tant pictures, black indicates exudates and white indicates the area where the optic disc (OD) has masked out. The candidate regions obtained after morphological segmentation.
Detection of exudates by ophthalmologists normally re-quires pupil dilation using chemical solution which takes time and affects patients. Akara Sopharak et al. have proposed automatic methods of exudate detection on low-contrast im-ages taken from non-dilated pupils [2–4]. The process had two main steps of segmentation which are coarse segmentation using Fuzzy C-Means(FCM) clustering and fine segmentation using morphological reconstruction. Four features, namely intensity, standard deviation on intensity, hue and adapted edge, were selected for coarse segmentation. Traditional exudates detection
methods are based on specific parameter configuration, while the machine learning approaches which seems more flexible may be computationally high cost. A comparative analysis of traditional and machine method was reported. The sensitivity, specificity, precision, accuracy and time complexity of each method was also compared. Gerald Schaefer et al. have pre-sented an automated, neural network based approach for the detection of exudates [5]. Images are processed using a sliding window approach to extract sub regions of the image. Based on the ground truth database of images with known exudates loca-tions, a neural network was trained to classify the regions central pixels into exudates and non-exudates instances. It provides a sensitivity of 94.78% with a specificity of 94.29%. A machine learning approach was used to the problem of exudates classifi-cation. This method was used for exudates feature selection and classification using a Naive Bayes (NB) classifier [6]. Filtered images for noise reduction, enhanced for more contrast, detect and remove the OD; extract local features describing pixels or regions, then classify those features using a model built from a training set. The NB classifier, after feature selection, achieved an overall per-pixel sensitivity of 93.38%, specificity of 98.14%, precision of 47.51%, and an overall accuracy of 98.05% on a test set not used during training. The Nearest Neighbor (NN) classifier was used as a baseline method for comparison with NB and Support Vector Machine (SVM) classifiers [7]. The NB and SVM classifiers perform substantially better than the NN classifier. This was the first work to achieve practically useful exudates detection results on non-dilated fundus images. The k-mean clustering technique was used to detect exudates
[8, 9]. For the exudate detection, median filter was applied to the retinal image and the filtered image was subtracted from the green channel of the original image to eliminate the intensity variation. The sensitivity for the exudates detection was 86%. A new algorithm for the extraction of bright objects from fundus images based on marker controlled watershed segmentation was presented [10]. The proposed algorithm makes use of average filtering and contrast adjustment as preprocessing steps. The concept of the markers was used to modify the gradient before the watershed transformation was applied. The method can yield an average sensitivity value of about 95%.
Figure 1.Result of exudates detection [1]
Huiqi Li and Opas Chutatape proposed Kirsch’s method for exudates detection. This method is applied to red and green components of the color retinal images for detection of blood vessels and exudates [11]. It computes the gradient by convolu-tion the image with eight templates. The final gradient was set to the largest gradient among different directions. Thomas Walter et al. have used high grey level variation and morphological reconstruction methods for detection of exudates [12]. Another algorithm for detection of hard exudates (HEs) was based on retinal image analysis, which is an automatic image processing algorithm. This algorithm works on the statistical recognition and color information which was used to detect retinal exudates. User initialization was not required in this proposed algorithm. This algorithm was robust to the changes in the retinal fundus images which are typically encountered in the clinical environ-ments [13]. Giribabu Kande et al. have proposed a simple approach based on spatially weighted FCM clustering method, which is used to extract the enhanced exudate regions. By includ-ing the spatial neighborhood information into the standard FCM algorithm the spatially weighted FCM algorithm can be framed [14]. Hussain Jaafar et al. have presented an automated method for the detection of exudate in retinal images with the help of segmentation procedures. The coarse segmentation is based on calculating the local variation for each pixel of the image and fine segmentation uses an adaptive thresholding technique based on a new split-andmerge algorithm. Dynamic partitioning form is determined based on some features such as average intensities of the entire image and all sub-images, homogeneity in
adja-cent subimages, standard deviation values and distribution of illumination throughout the image. Morphological operation is applied on the coarse and fine detection results to obtain the final segmentation of exudates [15]. Kavitha et al. used a method based on color histogram thresholding for identification of hard and soft exudate pathologies in retinopathy images. The overall sensitivity, specificity and accuracy obtained by this approach were 89.78%, 99.12% and 99.07%, respectively [16].
Feroui Amel et al. proposed an algorithm which is based on a combination of k means clustering algorithm and mathematical morphology to detect hard exudates in retinal images. These techniques are widely used for image segmentation. The ad-vantage of the proposed approach is its adaptation to a variety of images in terms of brightness, color and contrast acquies-cent by a retinographe from non-dilated pupils [17]. Wei Bu et al. presented a novel method to detect HEs automatically in color retinal images. The method consists of two stages: coarse level and fine level. In coarse level an extract HEs candidate regions by combining histogram segmentation with morpholog-ical reconstruction method. While in fine level, they defined 44 representative features for each candidate region, and train SVM model to classify HEs and non-HEs [18]. Kekre et al. have discussed two techniques for efficient detection of HEs. The first technique was mathematical morphology. The second technique was hybrid approach for detection of HEs. This ap-proach consists of three stages: preprocessing, clustering and post processing. In preprocessing stage, it resizes the image and applies morphological dilation. The clustering stage applies LBG and k-means algorithm to detect HEs. In post processing stage, remove all unwanted feature components from the image to get accurate results [19].
Clustering methods discussed above are used for exudate detec-tion. These methods fail to provide optimum exudate detection for low contrast retinal images and merely calculated the values of Accuracy, Sensitivity and Specificity. The proposed work concentrates on preprocessing technique. As the exudates ap-pear bright as compared to other features in retinal image, the edge pixels get easily identified. Considering the above property, an effective preprocessing algorithm for exudates detection is developed. Morphological dilation operation is used to extend the thickness of the object (like exudates). To increase the edge pixels’ intensity, grayscale image is subtracted from dialated enhanced image. The proposed algorithm gives better contrast between the background and the object (like exudates and OD), resulting into prominent visibility of images. We applied two feature extraction methods. The first one is Kirsch method based on largest gradient by convolution the image with eight templates, followed by morphological operation. Another, the LBG clustering method is based on code vector, followed by thresholding and morphological operation. The DIARETDB1 [20] data base with 89 color retinal fundus images is used for testing and performance evaluation. We calculated False Posi-tive Rate(FPR), False NegaPosi-tive Rate(FNR) and Weighted Error Rate(WER) for the evaluation of our algorithm.
database that we used for evaluation. Section II-B describes the proposed algorithm. It includes three stages: (1) Pre-processing, (2) Segmentation Methods, (3) Postprocessing. Section III Ex-periments results and discussion are presented. Section IV, we end with the conclusion.
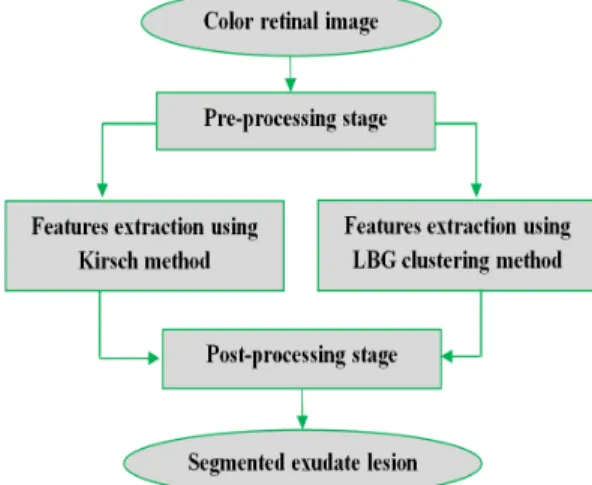
Figure 2.Flow Diagram of the algorithm
2. Methods and Materials
2.1 MaterialsThe color retinal images used in this paper were obtained from publicly available dataset DIARETDB1 databases. The database consists of 89 color fundus images of which 84 contain at least mild non-proliferative signs of the diabetic retinopathy and 5 are considered as normal, which do not contain any sign of the diabetic retinopathy [20].
2.2 Methods
This section presents exudates detection algorithm shown in Figure 2. In precise, we have divided this section into three sub sections, which deal with retinal image pre-processing, segmen-tation and post-processing.
2.2.1 Preprocessing
Retinal images are needed to be pre-processed to enhance the image quality. The RGB input image of size 1500*1152 resized into the fixed size of 256*256.
Algorithm for Preprocessing Stage:
1. Consider Green Channel of image I, it is denoted by Igc. 2. Apply Morphological Dilation operation on output image
of step 1.
Imd=Igc⊕Q=maxi,j∈Q(Igc(x−i,y−i) +Q(i,j)) (1)
Where Q is a binary structuring element.
3. Apply Contrast-Limited Adaptive Histogram Equaliza-tion (CLAHE) process on step 2 output image(Imd).
Ice=ApplyCLAHE(Imd) (2)
4. Convert resized RGB image into grayscale image, it is denoted byIgs.
5. To obtained preprocessed image following equation is used.
Is=Ice−Igs (3)
Green Channel Extraction:In the first step consider the green component of the resized RGB color retinal image, which con-tains the most information about all features like vessels, OD and bright lesions pixels like exudates since there is a higher contrast between background pixels and lesion pixels.
Morphological Operation:Dilation is a process that thickens objects in a binary image[21]. The extent of this thickening is controlled by the Structuring Element (SE), which is represented by a matrix of 0s and 1s. Mathematically, dilation operation can be written in terms of set notation as given in equation (1).
Contrast Enhancement:After morphological operation, contrast-limited adaptive histogram equalization (CLAHE) method is applied to enhance the contrast of step 2 output image(Imd).
CLAHE operates on small regions of the image, called Tile. Each Tile’s contrast is increased, so that the histogram of the output region approximately matches the
Image subtraction:The resized RGB image is converted into the grayscale image as shown in Figure 3.c. Finally, in step 5 the grayscale image (Igs) is subtracted from the enhanced image
(Ice) (see equation (3)). It gives more contrast in background
and lesion as shown in Figure 3.d.
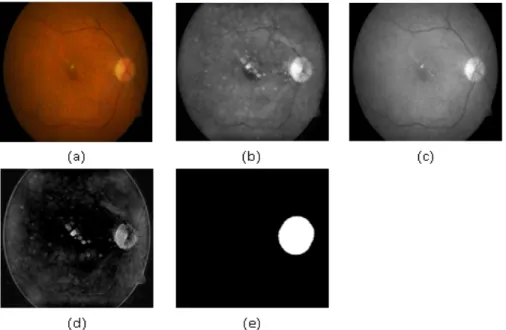
Optic Disc Elimination: In color retinal images OD and ex-udate are appear as a bright yellowish region. So because of similar appearance, it is necessary to remove OD for exudates detection. Using histon [23] based method mask is generated for eliminating OD (as shown in Figure 3.e).
2.2.2 Segmentation Method
Kirsch Method:The Kirsch method is applied on preprocessed image for edge detection. Which will produce the maximum value considering as the structuring element for the edge detec-tion. The Kirsch edge detection algorithm identifies both the presence of an edge and the direction of the edge. There are eight possible directions: north, northeast, east, southeast, south, southwest, west, and northwest [11].
1. Take a single mask and rotate it to 8 major compass ori-entations:N,NW,W,SW,S,SE,E,and NE.
2. The edge magnitude = the maximum value found by the convolution of each mask with the image.
3. The edge direction is defined by the mask that produces the maximum magnitude.
The Kirsch masks are defined as follows:
N= −3 −3 −3 −3 0 −3 5 5 5 W= −3 −3 5 −3 0 5 −3 −3 5 S= 5 5 5 −3 0 −3 −3 −3 −3 E= 5 −3 −3 5 0 −3 5 −3 −3 NW= −3 −3 −3 −3 0 5 −3 5 5 SW= −3 5 5 −3 0 5 −3 −3 −3 SE= 5 5 −3 5 0 −3 −3 −3 −3 NE= −3 −3 −3 5 0 −3 5 5 −3
The Kirsch algorithm works well for images having more contrast between the foreground and background pixels. Since exudates can be easily detected by the application of the Kirsch algorithm as shown in Figure 4.a. The OD appears like exudates feature so it extract incorrectly as an exudate. We are interested in detecting exudates hence eliminate OD (see Figure 4.b).
Figure 5. Segmented exudate a) Output of LBG algorithm, (b) Output of thresholding, (c) Output of Morphological op-eration,(d) Segmented exudate boundary is superimposed on original image.
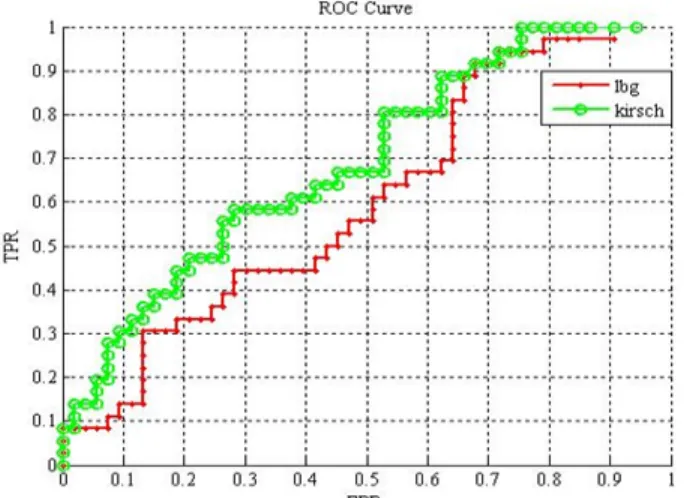
Figure 7.ROC curve for exudates detection
LBG Clustering Method:The LBG algorithm is an itera-tive algorithm which requires an initial codebook to start with. Codebook is generated using a training set of images. In this method an initial code vector is set as the average of the entire training sequence. This code vector is then split into two. The iterative algorithm is run with these two vectors as the initial codebook. The final two code vectors are splitted into four and the process is repeated until the desired number of code vec-tors are obtained [19]. Results of LBG algorithm are shown in Figure 5.
2.2.3 Postprocessing
Morphological filling operation, fill holes present in the seg-mented image, also erosion and dilation operations are applied to the segmented image for removing the false exudate parts [21]. It processes the image based on shapes. It performs to im-age using ‘disc’ structuring element (see Figure 4.c and Figure 5.c). The segmented image superimposed on the original image as shown in Figure 4.d.
3. Results and Discussion
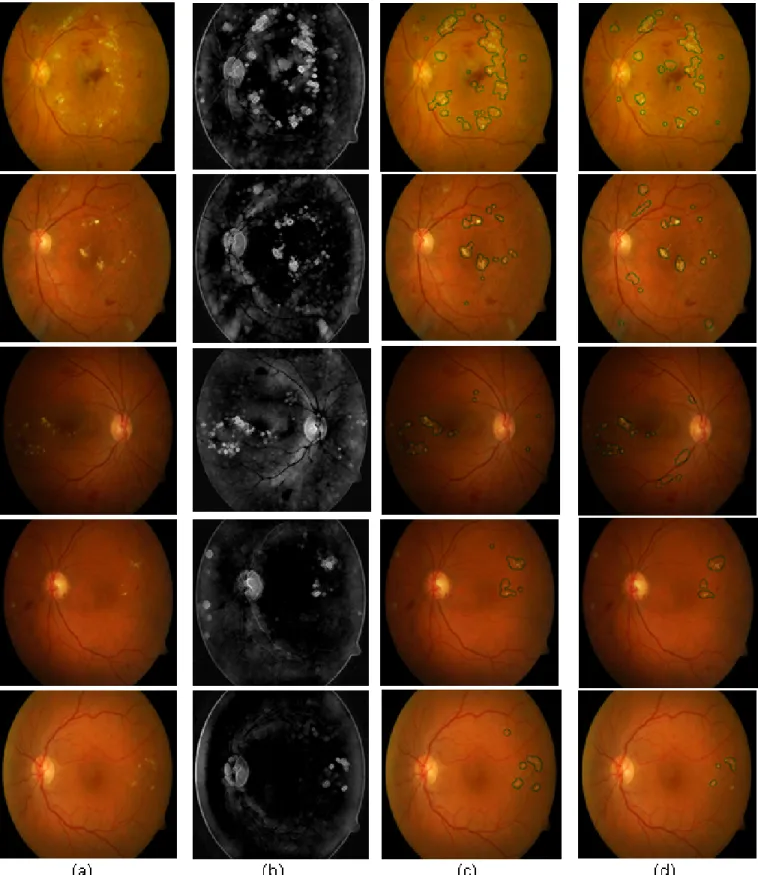
We applied our algorithm to 89 retinal images from DIARETDB1 database[20]. In Kirsch method the visibility of exudates is more clear. Whereas on LBG method the visibility of exudates is not clear as well as false exudates are detected as shown in Figure 7. The provided ground truth images (for example see Figure 4.e) are the result of several markings made by different experts for each retinal image. Depending upon the number of experts marking different areas at different confidence levels can be defined. The performance of the proposed algorithm was tested and evaluated, comparing the results with the ground truth im-ages at a pixel level. This evaluation is done in the computation of the sensitivity and specificity. The sensitivity and specificity values are reported for medical interpretations. Sensitivity value is described the severity of diseased population and specificity describe about healthy population [20].
Figure 3.Original Retinal Image, (b) Enhanced Image(Ice), (c) Gray scale Image(Igs), (d) Subtracted Image(Is) and (e) Mask for
OD Elimination
Figure 4.Segmented exudate a) Output of Kirsch algorithm, (b) Elimination of outer ring, (c) Output of Morphological operation,(d) Segmented exudate boundary is superimposed on original image and (e) Experts marked exudates for the same image[20].
Sensitivity(Sn) = T p
T p+Fn (4)
Speci f icity(Sp) = T n
T n+F p (5)
WhereT pis the number of abnormal retinal images found as abnormal, Tn is the number of normal retinal images found as normalF pis the number of normal retinal images found as abnormal i.e. false positives andFnis the number of abnormal retinal images found as normal i.e. false negative. Sensitivity and specificity are also referred to as the true positive rate (TPR)
Figure 6.a) Original Retinal Image, (b) Output of Preprocessing algorithm, (c) Output of Kirsch algorithm,(d) Output of LBG algorithm
Table 1.The Best Performance measures for Kirsch and LBG Method
FPR FNR WER
Kirsch Method LBG Method Kirsch Method LBG Method Kirsch Method LBG Method
R=0.1 0 0 0.916667 0.916667 0.083333 0.083333
R=1 0.283019 0.679245 0.416667 0.083333 0.349843 0.381289 R=10 0.754717 0.792453 0 0.027778 0.068611
Table 2.The Best Performance measures for Kirsch, LBG and Baseline Method[20]
FPR FNR WER Kirsch Method LBG Method Baseline Method Kirsch Method LBG Method Baseline Method Kirsch Method LBG Method Baseline Method R=0.1 0 0 0.02439 0.84211 0.89474 0.45 0.07656 0.08134 0.06308 R=1 0.28571 0.71429 0.07317 0.42105 0.10526 0.25 0.35338 0.40977 0.16159 R=10 0.83333 0.85714 0.80488 0 0.05263 0 0.07576 0.12577 0.07317
and true negative rate (TNR), respectively [20].
The best sensitivity and specificity are 97.22% and 98.11%, respectively achieved with a confidence level of 0.75. Several studies have used ROC analysis to compare the accuracy be-tween different methods. As shown in Figure 6, the area under the ROC curve for the Kirsch method is higher than the LBG method. A larger area under the curve signifies a greater dis-criminatory ability of the segmentation method. Single valued measures are derived from the corresponding ROC curve by computing an equal error rate (EER) (TPR= TNR). The EER measure assumes equal penalties for the both false positives and negatives. The weighted error rate is defined as
W ER(R) =FPR+R(FNR)
1+R =
(1−Sp) +R(1−Sn)
1+R (6)
WhereR=CFNR
CFPR is the cost ratio between FPR and FNR
(R=1 is the equal penalty for both). In the DIARETDB1 the following measures are computed: WER (0.1) (FNR is an order of magnitude less harmful), WER (1) (FPR and FNR are equally harmful) and WER (10) (FNR is an order of magnitude more harmful). These measures are computed from the nearest true points on the ROC without interpolation.
Evaluating results of WER for the applied methods are demonstrated in Table 1. R is the cost ratio between FPR and FNR. If value of R=1 then FPR and FNR are equally harmful. If R=10 then FNR is more harmful than FPR. With the LBG method the WER obtained is higher than the Kirsch method for R=1 and R=10. False positive exudate candidates are de-tected by the LBG algorithm that leads to overall less efficient result. For a better visualization ROC curve for both the meth-ods are plotted. ROC curve is plotted for TPR (True Positive Rate) against FPR (False Positive Rate). ROC curve obtained shows good result for Kirsch algorithm. For 61 test images of DIARETDB1 database, Table 2. described the best performance measures for Kirsch, LBG and Baseline method[20].
4. Conclusion
The proposed algorithm is applied on different qualities of im-ages through taking all image information into account. The performance of the proposed method is measured against expert marked images. The proposed pre-processing algorithm high-lights the main components of the human retina, i.e. the OD and exudates for easier segmentation. Then for exudates detection two algorithms were developed. In the first one, an efficient algorithm based on Kirsch method has been employed for bright region segmentation followed with morphological operations. In the second algorithm, LBG clustering method with morphologi-cal operations applied for exudates detection. The comparative study is done to analyze the efficiency of the system. It is demonstrated that the Kirsch algorithm detected bright lesion with higher accuracy and reliability than the LBG algorithm. Therefore, our system will help in improving diagnostic accu-racy as well as in reducing the workload of ophthalmologists in the future.
5. Acknowledgment
The authors would like to thank Tomi Kauppi et al. for their DIRETDB1database and Toolkit used in this research.
References
[1] RAVISHANKAR, Saiprasad, JAIN, Abhishek, et MITTAL,
Anish. Automated feature extraction for early detection of diabetic retinopathy in fundus images. In : Computer Vision and Pattern Recognition, 2009. CVPR 2009. IEEE Conference on. IEEE, 2009. p. 210-217.
[2] SOPHARAK, Akara et UYYANONVARA, Bunyarit.
Au-tomatic exudates detection on Thai diabetic retinopathy patients’ retinal images. In : Proceedings of the 2006 ECTI International Conference. 2006. p. 709-712.
[3] SOPHARAK, Akara et UYYANONVARA, Bunyarit.
image using fuzzy c-means and morphological methods. In : Proceedings of the third IASTED international conference Advances in Computer Science and Technology, Thailand. 2007. p. 359-364.
[4] SOPHARAK, Akara, UYYANONVARA, Bunyarit,
BAR-MAN, Sarah, et al. Comparative analysis of automatic ex-udate detection between machine learning and traditional approaches. IEICE TRANSACTIONS on Information and Systems, 2009, vol. 92, no 11, p. 2264-2271.
[5] SCHAEFER, Gerald et LEUNG, Edmond. Neural networks
for exudate detection in retinal images. In : Advances in Visual Computing. Springer Berlin Heidelberg, 2007. p. 298-306.
[6] SOPHARAK, Akara, NEW, K. Thet, MOE, Y. Aye, et al.
Automatic exudate detection with a naive Bayes classifier. In : International Conference on Embedded Systems and Intelligent Technology, Bangkok, Thailand. 2008. p. 139-142.
[7] SOPHARAK, Akara, DAILEY, Matthew N.,
UYYANON-VARA, Bunyarit, et al. Machine learning approach to au-tomatic exudate detection in retinal images from diabetic patients. Journal of Modern optics, 2010, vol. 57, no 2, p. 124-135.
[8] SIDDALINGASWAMY, P. C. et PRABHU, K.
Gopalakr-ishna. Automated detection of optic disc and exudates in retinal images. In : 13th international conference on biomed-ical engineering. Springer Berlin Heidelberg, 2009. p. 277-279.
[9] SOPHARAK, Akara, UYYANONVARA, Bunyarit,
BAR-MAN, Sarah, et al. Automatic detection of diabetic retinopa-thy exudates from non-dilated retinal images using mathe-matical morphology methods. Computerized Medical Imag-ing and Graphics, 2008, vol. 32, no 8, p. 720-727.
[10] ESWARAN, C., REZA, Ahmed Wasif, et HATI, Subhas.
Extraction of the contours of optic disc and exudates based on marker-controlled watershed segmentation. In : Com-puter Science and Information Technology, 2008. ICC-SIT’08. International Conference on. IEEE, 2008. p. 719-723.
[11] LI, Huiqi et CHUTATAPE, Opas. Fundus image features
extraction. In : Engineering in Medicine and Biology So-ciety, 2000. Proceedings of the 22nd Annual International Conference of the IEEE. IEEE, 2000. p. 3071-3073.
[12] WALTER, Thomas, KLEIN, Jean-Claude, MASSIN,
Pas-cale, et al. A contribution of image processing to the diag-nosis of diabetic retinopathy-detection of exudates in color fundus images of the human retina. Medical Imaging, IEEE Transactions on, 2002, vol. 21, no 10, p. 1236-1243.
[13] S ´ANCHEZ, Clara I., HORNERO, Roberto, L ´OPEZ, Mar´ıa
I., et al. A novel automatic image processing algorithm for detection of hard exudates based on retinal image analysis.
Medical Engineering & Physics, 2008, vol. 30, no 3, p. 350-357.
[14] KANDE, Giri Babu, SUBBAIAH, P. Venkata, et
SAVITHRI, T. Satya. Feature extraction in digital fundus images. J. Med. Biol. Eng, 2009, vol. 29, p. 122-130.
[15] JAAFAR, Hussain F., NANDI, Asoke K., et AL-NUAIMY,
Waleed. Automated detection of exudates in retinal images using a split-and-merge algorithm. EUSIPCO 2010, 2010, p. 1622-1626
[16] KAVITHA, S. et DURAISWAMY, K. Automatic detection
of hard and soft exudates in fundus images using color histogram thresholding. European Journal of Scientific Re-search, 2011, vol. 48, no 3, p. 493-504
[17] AMEL, Feroui, MOHAMMED, Messadi, et
ABDEL-HAFID, Bessaid. Improvement of the hard exudates detec-tion method used for computer-aided diagnosis of diabetic retinopathy. International Journal of Image, Graphics and Signal Processing (IJIGSP), 2012, vol. 4, no 4, p. 19.
[18] BU, Wei, WU, Xiangqian, CHEN, Xiang, et al. Hierarchical
detection of hard exudates in color retinal images. Journal of Software, 2013, vol. 8, no 11, p. 2723-2732.
[19] KEKRE, H. B., SARODE, Tanuja K., et PARKAR, Ms
Tarannum. Hybrid Approach for Detection of Hard Exu-dates. International Journal of Advanced Computer Science & Applications, 2013, vol. 4, no 3.
[20] DIARETDB1 Standard Diabetic
Retinopa-thy Database Calibration Level 1. 2010. DI-ARETDB1 Dataset. [Online] Cited: October 2011.] http://www2.it.lut.fi/project/imageret/diaretdb1/diaretdb1
v 1 1.zip.
[21] GONZALEZ, Rafael C., WOODS, Richard Eugene, et
ED-DINS, Steven L. Digital image processing using MATLAB. Pearson Education India, 2004.
[22] PIZER, Stephen M., JOHNSTON, R. Eugene,
ERICK-SEN, James P., et al. Contrast-limited adaptive histogram equalization: speed and effectiveness. In : Visualization in Biomedical Computing, 1990., Proceedings of the First Conference on. IEEE, 1990. p. 337-345.
[23] MOOKIAH, Muthu Rama Krishnan, ACHARYA, U.
Ra-jendra, MARTIS, Roshan Joy, et al. Evolutionary algorithm based classifier parameter tuning for automatic diabetic retinopathy grading: A hybrid feature extraction approach. Knowledge-based systems, 2013, vol. 39, p. 9-22.
![Figure 1. Result of exudates detection [1]](https://thumb-us.123doks.com/thumbv2/123dok_us/788270.2599667/2.918.79.437.335.526/figure-result-of-exudates-detection.webp)
![Table 2. The Best Performance measures for Kirsch, LBG and Baseline Method[20]](https://thumb-us.123doks.com/thumbv2/123dok_us/788270.2599667/7.918.118.799.281.395/table-best-performance-measures-kirsch-lbg-baseline-method.webp)