The University of Akron
IdeaExchange@UAkron
Honors Research Projects The Dr. Gary B. and Pamela S. Williams Honors
College
Winter 2018
Soil Moisture Sensor
Jaclyn Miller
[email protected] Derek Bitecofer Seung Jun Lee
Please take a moment to share how this work helps youthrough this survey. Your feedback will be important as we plan further development of our repository.
Follow this and additional works at:http://ideaexchange.uakron.edu/honors_research_projects Part of theElectrical and Electronics Commons, and theOther Electrical and Computer Engineering Commons
This Honors Research Project is brought to you for free and open access by The Dr. Gary B. and Pamela S. Williams Honors College at IdeaExchange@UAkron, the institutional repository of The University of Akron in Akron, Ohio, USA. It has been accepted for inclusion in Honors Research Projects by an authorized administrator of
IdeaExchange@UAkron. For more information, please [email protected], [email protected].
Recommended Citation
Miller, Jaclyn; Bitecofer, Derek; and Lee, Seung Jun, "Soil Moisture Sensor" (2018).Honors Research Projects. 776.
Team 02 – 1
Soil Moisture Sensor
Final Design Report
Design Team Number: 02
Derek Bitecofer
Seung Jun Lee
Jaclyn Miller
Faculty Advisor: Dr. Kye-Shin Lee
Senior Design Coordinator: Gregory A. Lewis
Date:
Team 02 – 2 Table of Contents 1.0 Problem Statement ... 7 1.1 Need ... 7 1.2 Objective ... 8 1.3 Research Survey ... 8 1.3.1 Patent Search ... 8
1.3.2 Energy Harvesting Component ... 9
1.3.3 Soil Moisture Sensor System ... 10
1.3.4 Soil Moisture Sensor Technology Comparison ... 10
1.3.5 User Interface ... 13
1.5 Objective Tree ... 15
2.0 Design Requirement Specification ... 16
2.1 Engineering and Marketing Requirements ... 17
3.0 Accepted Technical Design ... 18
Any design idea written within this section of "Accepted Technical Design" may or may not be improved upon or changed throughout the implementation phase of this project. See section 4.0 "Accepted Implemented Design" for further details. ... 18
3.1 Hardware Design ... 18
3.1.1 Block Diagrams and System Overview ... 18
3.1.2 Design Theory ... 23
3.2 Software Design ... 32
3.2.1 Communications ... 32
3.2.2 General Design ... 33
3.2.3 Microcontroller Requirements ... 37
3.2.4 Microcontroller Data Flow ... 42
3.2.5 ADC/LCD Module ... 45
3.2.6 Building Wireless Network (Lora) ... 48
3.2.7 User Interface (Web/Mobile Application) ... 49
4.0 Accepted Implemented Design ... 51
4.1 Power Design Implementation ... 51
4.3 Power Calculation Update... 57
4.4 Sensor Design Implementation Update ... 58
... 59
Team 02 – 3
4.6 Software Design Implementation Update ... 61
4.6.1 The Theory of Operation ... 61
4.6.2 Wireless Communication ... 62
4.6.3 Software Functional Table and Pseudocode ... 62
4.6.4 Sleep Mode ... 64
4.6.5 Downlink Encoder ... 66
4.6.6 ADC ... 67
4.6.7 HTTP Integration ... 68
4.6.8 Real-Time Graph ... 69
4.6.9 Email Notification System ... 71
4.6.10 Remote Power Control ... 73
5.0 Operation, Maintenance, and Repair Instructions ... 74
5.1 Calibration and Interpretation ... 74
5.1 Application Operation ... 75
6.0 Parts List ... 75
6.1 Budget ... 76
7.0 Design Team Information ... 77
8.0 Conclusions and Recommendations ... 77
8.1 Hardware Conclusions and Recommendations... 77
8.2 Software Conclusions and Recommendations ... 78
9.0 References ... 79
10.0 Appendices ... 81
10.1 Initial Power Design ... 81
10.1.1 Sources ... 81
11.1.2 Optimization Algorithm ... 87
11.1.3 Voltage Regulators ... 89
11.2 Pseudo Code ... 94
11.2.1 RTCC Pseudo Code ... 94
11.2.2 ADC/LCD Pseudo Code ... 95
11.2.3 ISR UART Pseudo Code... 95
11.2.4 Communication (Using Lora RN2903 (PIC18) Library for MPLAB ) ... 95
11.2.5 Communication (Using Lora RN2903 (Connected to PC) Command Line) ... 96
Team 02 – 4 11.2.7 User register.html... 97 11.2.8 User notification.html ... 98 11.2.9 Server action.php ... 99 11.2.9 Server mem_req.php ... 100 11.2.9 Server db_con.php ... 101
11.2.9 Notification Google API (GCM Server and curl function) ... 102
12.0 Project Schedule ... 103
12.1 Preliminary Fall 2017 Gantt Chart ... 103
Team 02 – 5
Table of Figures
Figure 1 - Objective Tree ... 15
Figure 2 - Hardware Block Diagram Level Zero ... 18
Figure 3 - Hardware Block Diagram Level One ... 19
Figure 4 - Hardware Block Diagram Level Two ... 20
Figure 5 - Hardware Block Diagram Level Three (System Overview) ... 21
Figure 6 - Power Design ... 23
Figure 7 - Wheatstone Bridge Example ... 25
Figure 8 - Difference Amplifier ... 26
Figure 9 - Op-Amp Voltage Follower (Buffer) ... 27
Figure 10 - Wheatstone Bridge Circuit Followed by a Different Amplifier (Sensor) ... 28
Figure 11 - Simulation of Sensor ... 30
Figure 12 - Structural Design ... 31
Figure 13 - Node-to-Node (Class A) Communication without Gateway ... 33
Figure 14 - Software Block Diagram Level Zero ... 34
Figure 15 - Software Block Diagram Level One ... 34
Figure 16 - Software Block Diagram Level Two ... 36
Figure 17 - PWM Graph ... 39
Figure 18 - Required Energy for the Microcontroller ... 42
Figure 19 - Software Block Diagram Level Three: RTCC Module (Sleep Mode) ... 44
Figure 20 - Software Block Diagram Level Three: ADC/LCD Module ... 46
Figure 21 - Software Block Diagram Level Three: ISR UART Module ... 47
Figure 22 - Software Block Diagram Level Three: Lora Network ... 48
Figure 23 - Software Block Diagram Level Three: User-Interface (Web/Mobile Application) ... 51
Figure 24 - Buck-Boost Converter Buck Mode Circuit and Simulation ... 54
Figure 25 - Buck-Boost Converter Boost Mode Circuit and Simulation ... 54
Figure 26 - Buck Converter Circuit and Simulation ... 55
Figure 27 - Implemented Linear Regulator Design ... 56
Figure 28 - Final Implemented Linear Regulator Perf Board ... 57
Figure 29 - Implemented Sensor Circuit ... 59
Figure 30 - Power Absorbed by the Sensor ... 59
Figure 31 - Updated Structural Design ... 60
Figure 32 - Implemented Structural Design ... 60
Figure 33 - Wireless Communication with Lora Network ... 62
Figure 34 - Design Team Information ... 77
Figure 35 - I-V Characteristics of Solar Panel [8] ... 82
Figure 36 - Capacity vs. Temperature Graph of Various Battery Types [12] ... 84
Figure 37 - Block Diagram of Switch Operation for Power Cases I, II, and III ... 88
Figure 38 - Voltage Regulator Circuitry (SPICE Topology) ... 89
Figure 39 - Suggested Layout of Voltage Regulator Components (SPICE Topology) ... 93
Figure 40 - Preliminary Fall 2017 Gantt Chart... 103
Team 02 – 6
Table of Tables
Table 1 - Soil Moisture Sensor Technology Comparison ... 12
Table 2 - Engineering and Marketing Requirements ... 17
Table 3 - Hardware Functional Requirement Level Zero ... 19
Table 4 - Hardware Functional Requirement Level One (Sensor)... 19
Table 5 - Hardware Functional Requirement Level One (Communications) ... 20
Table 6 - Hardware Functional Requirement Level Two (Communication & Microcontroller) ... 20
Table 7 - Hardware Functional Requirement Level Three (Sensor) ... 22
Table 8 - Hardware Functional Requirement Level Three (Microchip)... 22
Table 9 - Hardware Functional Requirement Level Three (Communications)... 23
Table 10 - Software Functional Requirement Level Zero - Software System ... 34
Table 11 - Functional Requirement Level One - Microcontroller ... 34
Table 12 - Functional Requirement Level One - Wireless Module ... 35
Table 13 - Functional Requirement Level One - Server ... 35
Table 14 - Functional Requirement Level One - User Interface ... 35
Table 15 - Functional Requirement Level Two - Microcontroller ... 36
Table 16 - Functional Requirement Level Two - GSM Module ... 36
Table 17 - Functional Requirement Level Two - Microcontroller ... 37
Table 18 - Functional Requirement Level Three- RTCC-Calibration ... 45
Table 19 - Functional Requirement Level Three- RTCC-ISR Alarm Register ... 45
Table 20 - Functional Requirement Level Three-ADC/LCD Module ... 46
Table 21 - Functional Requirement Level Three-ISR UART Module ... 48
Table 22 - Functional Requirement Level Three-Lora End-Device ... 49
Table 23 - Functional Requirement Level Three-Lora End-Device (Host Side) ... 49
Table 24 - Calculated Values for Buck-Boost Converter ... 52
Table 25 - Calculated Values for Buck Converter ... 53
Table 26 - Functional Table - MCU ... 63
Table 27 - Functional Table- Wireless Module ... 63
Table 28 - Functional Table- User Interface ... 63
Table 29 - Functional Table – Sleep Mode ... 64
Table 30 - Functional Table -Encoder ... 66
Table 31 - Functional Table -ADC ... 67
Table 32 - Real Time Graph UI ... 71
Table 33 - Notification Setup UI ... 72
Table 34 - Email Notification ... 72
Table 35 - Remote Power Module UI ... 74
Table 36 - Parts List ... 75
Team 02 – 7
Abstract
Because water is an important resource and not all communities around the world can afford to be liberal with their water needs; it has become important to use available water as efficiently as possible, especially in agriculture. For the purpose of reducing the overwatering of crops, an unattended ground moisture sensor can be implemented to measure the current moisture level in the soil surrounding the plants. This will allow a farmer to know when to water/stop watering his crop. For convenience, the moisture data information should be transmitted wirelessly to the user. The design of an unattended ground moisture sensor and wireless communication/user interface system is discussed. The sensor design consists of a Wheatstone bridge for determining the resistance of the soil, followed by a differential amplifier for converting the measured
resistance into a voltage. This is done because there exists a correlation between moisture and resistance. This voltage is interpreted by a microcontroller as moisture data and sent wirelessly to a Lora communication receiving node by a Lora communication transmitting node. The
receiving node then relays that information to a PC host for access by the user. The system has a power circuit that consists of a battery and a linear regulator.
1.0 Problem Statement
1.1 Need
With an increase in globalization and urbanization, a need for more productive and efficient methods for growing crops for an increasing population and a decreasing amount of farmland is very prominent. There has also been an increase in pollution in the global hemisphere that has and will continue affect the production of crops. Thus, a need arises to create a soil moisture system with statistical analysis of the data to aid in the monitoring of crop growth and production.
Team 02 – 8 Furthermore, pollution will be decreased with the production of a self-sufficient device which does not require external electrical power
[MA, JM]
1.2 Objective
The objective is to create moisture sensor that is convenient for farmers. The system will measure the moisture of the soil periodically throughout the user-selected time period. It will report the measured data to the user through a statistical interface which will allow for data analysis.
[MA, JM]
1.3 Research Survey
1.3.1 Patent Search
Three patents regarding moisture sensors were found. The first one is US 5424649 A, published on June 13, 1995. The patent is for a soil moisture sensor using sensor electrodes to sense capacitance which is proportional to the moisture of the soil [1]. It is similar to the proposed design because both the patented project and the idea regards sensing the moisture of soil. However, there are many differences between the project and the patented one. Primarily, the device will be self-sufficient, in that it will not require being plugged into a wall. This device will also record the data measured and send it to the user for statistical analysis.
The second patent is US 20080199359 A1, published on August 21, 2008. The patent is for a soil moisture sensor which measures the moisture of the soil and stores the values in its memory [2]. It is similar to our proposed design because, like the previous patent, both the patented project and
Team 02 – 9 our idea regards sensing the moisture of soil. Both projects also store the sensor readings in the memory. However, this project is different because it will provide the stored data to the user for statistical analysis.
The third patent is US 5621669 A, published on April 15, 1997. It is a probe used to measure moisture sensor and a controller for external actuators [3]. It is similar to our proposed design because, again, both the patented project and our idea regards sensing the moisture of soil. However, it is different because this device is simply a probe, not a fully-functioning measurement system. It does not store the measured values, nor does it provide the user with the data. Finally, it can be used as a controller, for which this project cannot be used.
[MA]
1.3.2 Energy Harvesting Component
Due to the fact that this moisture sensor system needs to be as automated and as self-sufficient as possible, an energy harvesting component needs to be added to the system. This can be done numerous ways, however, since this system is designed to be a low-cost system that can be used in various areas, a solar panel is the best option for this system. The solar panel will power all of the electronics in the soil moisture sensor. However, solar panels experience many issues in supplying a constant power, especially on cloudy days. Thus, a backup battery will be needed for the solar panel. On sunny days, the solar panel will power the whole system and will charge the backup battery supply. The battery will power the electronics when the solar panel cannot. For safe measure, a sensor should be attached to the solar panel and the DC battery supply to measure the power output.
Team 02 – 10 Due to weather conditions, there is a chance that the power output could be zero because no energy has been harvested over a long period of time. If this were to happen, a notification would be sent to the user informing him/her to switch the depleted battery with a fully charged battery. In the article, “Automated Irrigation System Using Solar Power,” a similar system is used to power their irrigation system. Differences between their proposed model and this system's proposed model is that this system has an extra power check to make sure there is always power to the system [4].
[JM]
1.3.3 Soil Moisture Sensor System
Soil moisture sensor systems can be implemented in a variety of ways. A simple resistive soil moisture sensor can be used to measure the resistance of the soil, which is proportional to the amount of water content in the soil. However, the resistance of soil is also dependent on temperature, thus an accompanying temperature sensor would increase the accuracy of the sensor. Another strategy would be to use a dielectric moisture sensor. These sensors are essentially capacitors, where the soil becomes the dielectric part of a capacitor and since the dielectric constant (ratio of permittivity of a material to the permittivity of air) changes as moisture builds (as the permittivity changes), so will the capacitance of the sensor [5]-[6]. [DB]
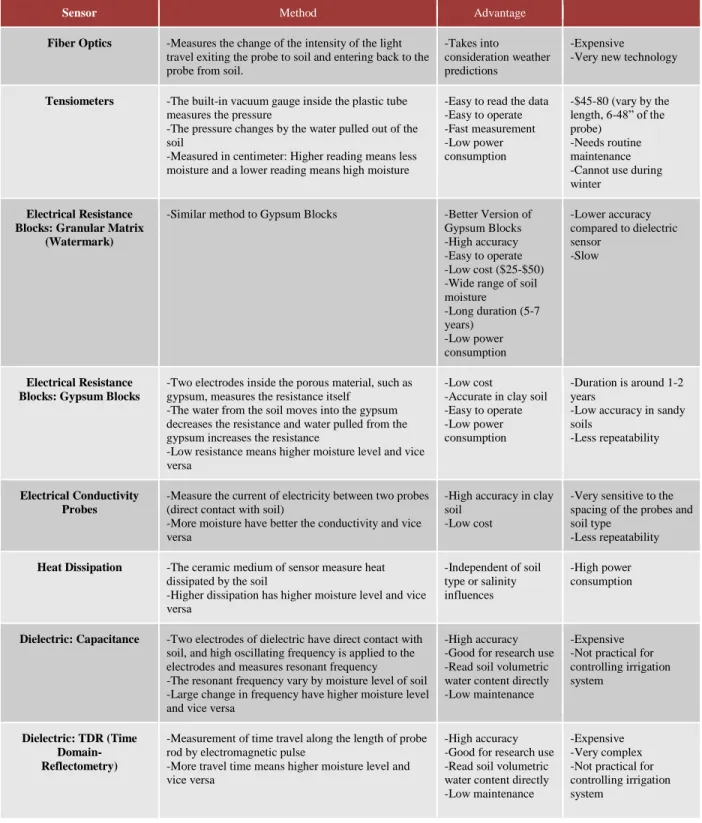
1.3.4 Soil Moisture Sensor Technology Comparison
The research survey of current soil moisture sensor technology is needed to select the most efficient and feasible sensor for this project. The research details a case study of four different types of moisture sensor (Capacitive dielectric sensor, two different types of conductivity sensors, and a resistance block sensor) to compare their performance based on the amount of water (in
Team 02 – 11 inches) applied with ET (EvapoTranspiration) information. The ET information simply tells how much water should be used and by subtracting the rainfall from ET values will give the required amount of water should be used. The case study was conducted both in clay soil and sand soil from May to September. Each plot is roughly 9' x 9' in size and each sensor was programmed to water daily with four start times of five minutes each, with at least one hour between cycles [7]. The results show that the best water saving sensor in clay soil is Capacitive dielectric sensor (Total of 11.30 inches while water requirement is 15.57 inches), and the best water saving sensor in sand soil is the resistance block sensor (Total of 22.88 inches while water requirement is 15.57 inches). These results implies that the environmental factors impact the moisture sensor performance and accuracy in multiple different soils. Other than environmental factors, there are many tradeoffs between cost and accuracy, and also power consumption. The overview of the sensor technology comparison is shown below Table 1.
Team 02 – 12
Sensor Method Advantage
Fiber Optics -Measures the change of the intensity of the light travel exiting the probe to soil and entering back to the probe from soil.
-Takes into
consideration weather predictions
-Expensive
-Very new technology
Tensiometers -The built-in vacuum gauge inside the plastic tube measures the pressure
-The pressure changes by the water pulled out of the soil
-Measured in centimeter: Higher reading means less moisture and a lower reading means high moisture
-Easy to read the data -Easy to operate -Fast measurement -Low power consumption -$45-80 (vary by the length, 6-48” of the probe) -Needs routine maintenance -Cannot use during winter
Electrical Resistance Blocks: Granular Matrix
(Watermark)
-Similar method to Gypsum Blocks -Better Version of Gypsum Blocks -High accuracy -Easy to operate -Low cost ($25-$50) -Wide range of soil moisture -Long duration (5-7 years) -Low power consumption -Lower accuracy compared to dielectric sensor -Slow Electrical Resistance
Blocks: Gypsum Blocks -Two electrodes inside the porous material, such as gypsum, measures the resistance itself -The water from the soil moves into the gypsum decreases the resistance and water pulled from the gypsum increases the resistance
-Low resistance means higher moisture level and vice versa
-Low cost
-Accurate in clay soil -Easy to operate -Low power consumption
-Duration is around 1-2 years
-Low accuracy in sandy soils
-Less repeatability
Electrical Conductivity
Probes -Measure the current of electricity between two probes (direct contact with soil) -More moisture have better the conductivity and vice versa
-High accuracy in clay soil
-Low cost
-Very sensitive to the spacing of the probes and soil type
-Less repeatability
Heat Dissipation -The ceramic medium of sensor measure heat dissipated by the soil
-Higher dissipation has higher moisture level and vice versa -Independent of soil type or salinity influences -High power consumption
Dielectric: Capacitance -Two electrodes of dielectric have direct contact with soil, and high oscillating frequency is applied to the electrodes and measures resonant frequency -The resonant frequency vary by moisture level of soil -Large change in frequency have higher moisture level and vice versa
-High accuracy -Good for research use -Read soil volumetric water content directly -Low maintenance
-Expensive -Not practical for controlling irrigation system
Dielectric: TDR (Time Domain- Reflectometry)
-Measurement of time travel along the length of probe rod by electromagnetic pulse
-More travel time means higher moisture level and vice versa
-High accuracy -Good for research use -Read soil volumetric water content directly -Low maintenance
-Expensive -Very complex -Not practical for controlling irrigation system
Table 1 - Soil Moisture Sensor Technology Comparison
Team 02 – 13
1.3.5 User Interface
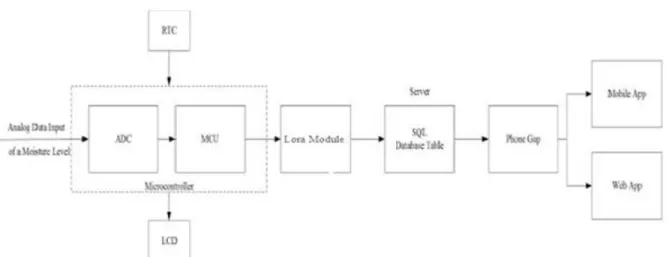
The user-interface should allow the user to record the useful data (moisture level) and remotely control the sensor device. There also needs to be a notification system, either by e-mail or text, that notifies users if there are any changes in the soil. The user-interfaces can be achieved by module interface via the IoT (The Internet of Things) system between the sensor, microcontroller, wireless communication, the database, and the users' devices (either webpage or mobile application). The components of the IoT system can include the sensor, the microcontroller, the wireless communication, the database and the user application. During data transmission from the moisture sensor to the user's device, the data is sent from the microcontroller through the wireless module. The data will be stored in the main server and the user can access and modify the data through the application. The application will be available in a web based application and a mobile application which will be supported on both ios and android. The mobile application engine can be designed by the PhoneGap application which provides an integrated program environment for both web-based and mobile-based application. The article, "Smart Discrete Water Quality Sensor" shows the user-interface between user and water sensor so that the user can retrieve the data in specific time of graph using PIC microcontroller, wi-fi module and mobile application.
The microcontroller has to be operated all the time. The clock of the microcontroller should always keep track of real time data even when the microcontroller is in sleep mode. This can be done by a RTCC module. Since the power supply of the system is a small battery, the system has to be operated efficiently. The article entitled “Design and Implementation of a Soil Moisture Wireless Sensor Network” details the efficient wireless network architecture to improve the lifetime of the sensor. A possible solution can be a scheduling of collecting data (sleep and awake periods). This technology is useful when a small number of sensors are used to cover a broad area. On the user’s
Team 02 – 14 side, the data should be available in a graph so the data can be analyzed by within a given period of time. There can be several features to analyze the data.
Team 02 – 15
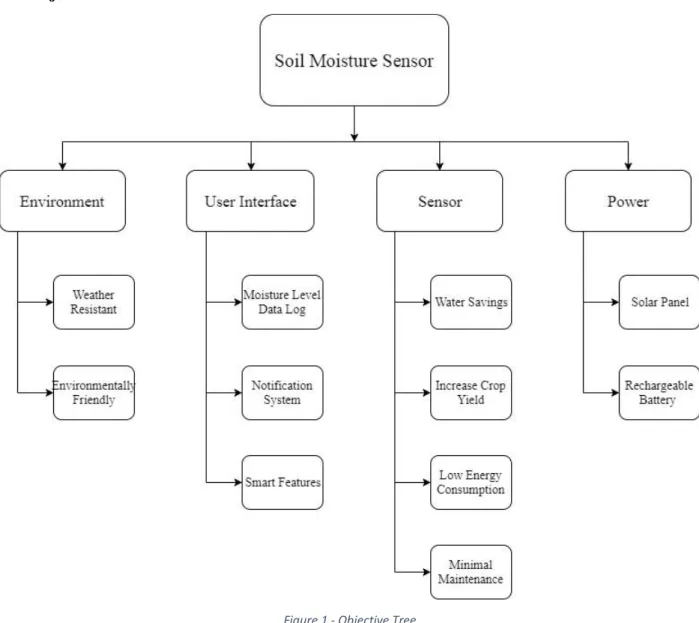
1.5 Objective Tree
Figure 1 - Objective Tree
Team 02 – 16
2.0 Design Requirement Specification
The following section contains the set of marketing requirements to be satisfied by the proposed design. Definitions of the terminology used in the marketing requirements are as follows:
The term ‘system’ refers to the completed project.
The system consists of a battery, a sensor designed by the team, a wireless communication (the Lore End-device with the built-in microcontroller and the Lora Gateway as a base station), a means to transport data and a user interface in the form of a phone app and/or desktop app.
Team 02 – 17
2.1 Engineering and Marketing Requirements
Marketing Requirements
Engineering Requirements Justification
1 The system must measure the soil moisture level 24 times a day.
The system should gather enough data for the user to analyze.
2, 7 The system must be able to operate within 0 to 50 degrees Celsius.
The power unit will not operate outside of this temperature region.
3, 6 The system will use less than 6W when measuring moisture.
The power unit does not supply more than 6W.
4 The system should relay the moisture level to the user within 5 minutes of the latest measurement taken.
The user may want to immediately know the moisture level of the crops.
1, 4 The system will notify the user of continuous non-optimum levels for 48 hours.
The user will want to know if the soil is not at the moisture level that the crops need.Therefore, the user can take
corrective action to mitigate the problem.
4
The system will complete its measurement process within 5 minutes.
The measurements need to be taken in a small time period to ensure that the numerical values are not thrown off by outliers caused by environmental factors.
4
The system should notify the user if the moisture level reads a number 3 or more standard deviations away from the last number taken.
This will ensure that if there is a dramatic change such as flooding or the removal of the device, the user will be notified.
3, 6
The sensor will draw 0A when not measuring the moisture level.
The system should use as little energy as possible when not in use. Therefore, the battery can power the system during long periods of insufficient light.
Marketing Requirements
1. The system should sense and store the soil moisture level. 2. The system should be weather resistant.
3. The system’s power should be supplied by the power unit.
4. The system will have a user interface that allows the user to control the system with smart features that may include, but not limited to averages, charts, graphs and notifications.
5. The system will be environmentally friendly. 6. The system will be energy efficient as possible.
7. The system will require minimal maintenance and be durable.
Table 2 - Engineering and Marketing Requirements
Team 02 – 18
3.0 Accepted Technical Design
Any design idea written within this section of "Accepted Technical Design" may or may not be improved upon or changed throughout the implementation phase of this project. See section 4.0 "Accepted Implemented Design" for further details.
3.1 Hardware Design
3.1.1 Block Diagrams and System Overview
The hardware of the moisture sensor will consist of three main parts: power, moisture sensor, and communications.The power section contains a battery. The solar panel will take energy from the sun and use it to power the system or charge the battery. The battery will be large enough to last the duration of the planting and harvesting season. Thus, the system will be made as energy efficiently as possible. The sensor will simply be a moisture sensor used to sense the amount of moisture in the soil. The communications contain a microprocessor and wireless communication modules. The sensor will transmit data to the microprocessor and the microprocessor will transmit data to the user on a computer or phone.
Team 02 – 19 Module Unattended Ground Moisture Sensor
Designers Mohammed Albusaleh & Derek Bitecofer
Inputs Power from the Battery
Soil Resistance (to determine moisture level)
Output Moisture Data
Description The system will be powered by the battery and will acquire soil moisture data. Table 3 - Hardware Functional Requirement Level Zero
Figure 3 - Hardware Block Diagram Level One
Module Moisture Sensor
Designers Mohammed Albusaleh & Derek Bitecofer
Inputs Battery Power
Soil Resistance
Output Data
Functionality The moisture sensor will calculate the moisture level of the soil based on the soil resistance and provide the data to the microcontroller.
Table 4 - Hardware Functional Requirement Level One (Sensor)
Team 02 – 20 Module Communications
Designers Mohammed Albusaleh & Derek Bitecofer Input Sensor Moisture Level Data
Output Moisture Level Data for User Interface
Functionality The moisture sensor system will provide the user with data about the moisture level of the soil.
Table 5 - Hardware Functional Requirement Level One (Communications)
Figure 4 - Hardware Block Diagram Level Two
[DB]
Module Communication & Microcontroller Designers Mohammed Albusaleh & Derek Bitecofer
Input Data
Output User Interface
Functionality The microcontroller’s onboard ADC will convert the analog data collected from the sensor into digital data. The data will be sent to the user using In Module / GateWay
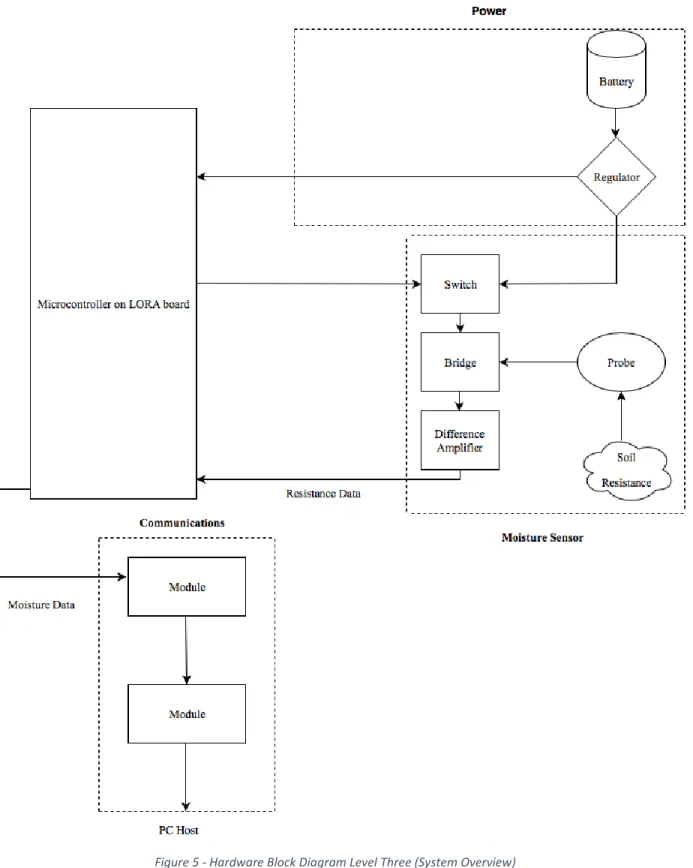
Team 02 – 21 Figure 5 - Hardware Block Diagram Level Three (System Overview)
Team 02 – 22 Module Sensor
Designers Mohammed Albusaleh & Derek Bitecofer
Inputs Power
Resistance of Soil Signal out for Switch
Outputs Moisture Sensor Data for Communications
Functionality The sensor will have two probes that with the soil, form a resistor for a circuit. As the resistance of the soil changes, so will the output of the
circuitry. The correlation between moisture, resistance and the output signal will be utilized in determining the proper moisture of the soil. To make the sensor as energy as efficient as possible, the circuit should not be powered continuously. Therefore, a signal from the microcontroller will be used to control a switch that will determine if the sensor is being powered.
Table 7 - Hardware Functional Requirement Level Three (Sensor)
Module Microchip
Designers Mohammed Albusaleh & Derek Bitecofer
Inputs Power from Battery
ADC Inputs from Voltage Monitors
Outputs PWM for Switches
Moisture Sensor Data for Communications
Functionality The microchip is the brain of the system. It gives PWM outputs for the switches and the moisture data to the communications for the user interface.
Team 02 – 23 Module Communications
Designers Mohammed Albusaleh & Derek Bitecofer
Inputs Power from Battery
PWM Input from PIC
Output Moisture Sensor Data for User Interface
Functionality The communications module transfers the moisture data from the sensor to the user interface.
Table 9 - Hardware Functional Requirement Level Three (Communications)
3.1.2 Design Theory
The hardware of this project boils down to three main sections: sensor, communications, and microprocessor. Each section is discussed in detail below.
3.1.2.1 Power Design Theory
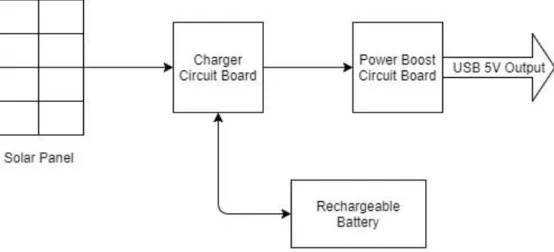
Please see the appendix 10.1 Initial Power Design for the extensive design that was originally made. Due to the loss of a team member, the power design needed to be reduced in complexity. There will no longer be the complicated switching conditions or the low battery conditions. Instead, there is the following:
Team 02 – 24 The voltage coming from the solar panel is quite uneven, thus the charger circuit board is needed to smooth out the voltage. This board will then be able to recharge the battery. The charger board also has another output to the power boost circuit board. This board will boost a voltage to approximately 3V to 5V. There are multiple different power boost circuit boards that can be used that have varying output current. During nighttime or during a very cloudy time, the rechargeable battery will supply power to the charger circuit board which can then power the boost circuit board. The 5V output will be used to supply the rest of the components in the hardware or software design. The 5V output was used because the majority of microcontrollers as well as many other components require a 5V input.
[JM]
3.1.2.2 Moisture Sensor
The moisture sensor will measure the resistance fluctuations in soil and send that information to a microcontroller in the form of a voltage. The voltage information will then be converted into moisture data using equations and a model. Firstly, the resistance measured will be related to the output signal by an equation. This resistance will then be related to moisture content by a
measured model. The details of which are discussed below.
[DB]
3.1.2.2.1 Wheatstone Bridge
A wheatstone bridge circuit is capable of determining an unknown resistance when compared with three known resistances. The circuit acts like a “scale” where the difference in the “weight” is a voltage. The voltage in question is measured at the junction of two of the known resistances; and at the junction with the other known resistance, along with the unknown resistance. See
Team 02 – 25 Figure 7 - Wheatstone Bridge Example. An intriguing fact about the nature of the wheatstone bridge that renders the circuit useful for this type of measurement is that the Current-Resistance plot is linear, which means the error will always be the same no matter what resistance you are measuring.
Figure 7 - Wheatstone Bridge Example
The equation that relates the resistances together can be seen below.
Equation 1
In the formula, Vm is the voltage being measured and Vs is the supplied voltage. To measure the voltage difference, a difference amplifier can be used. The formula was determined by analyzing the current in each branch, for the purpose of finding the voltage in between both R1, R3 and in between R2, R_unknown. Taking the difference of the voltage in the right branch and in the left branch relates the output voltage to the input voltage and all 4 of the resistances. After some simplification, the above formula is discovered. [17]
Team 02 – 26 [DB]
3.1.2.2.2 Difference Amplifier
A difference amplifier circuit takes the voltage potential at two points, subtracts them, applies a gain and then outputs that voltage. See Figure 8 - Difference Amplifier. This circuit essentially acts as a voltmeter.
Figure 8 - Difference Amplifier The output of the circuit is described by the equation
(22)
The circuit was analyzed using superposition; first, the currents through resistors R4, R5, and R6 were found using Ohm’s law and nodal analysis. Then V2 was set to 0V and the output voltage was found. Then V1 was set to 0V and an expression for the output voltage was found. By the
Team 02 – 27 superposition method, both output voltages were added together to form the final formula. After some simplification, the final expression (Wquation 22) is derived [18].
[DB]
3.1.2.2.3 Loading of the Wheatstone Bridge
For a wheatstone bridge to function properly, there must be no loading where the voltage difference is being measured. This means the input impedance of the difference amplifier must be much higher than the output impedance of the wheatstone bridge. To ensure no loading occurs, two buffer circuits can be placed at the inputs of the difference amplifier as shown in Figure 9 - Op-Amp Voltage Follower (Buffer).
Figure 9 - Op-Amp Voltage Follower (Buffer)
[DB]
3.1.2.2.4 Final Potential Circuit
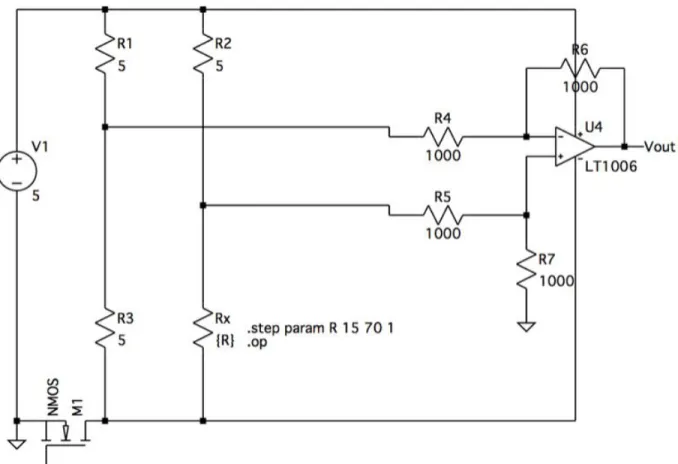
Connecting the bridge to the difference amplifier through two buffer circuits yields a potential soil resistance measuring circuit, see Figure 10 - Wheatstone Bridge Circuit Followed by a Different Amplifier (Sensor). The input voltage and values of resistors have not yet been
determined, but so long as R1=R2=R3 and the gain R6/R4 provided by the amplifier is taken into account, the circuits operation should be satisfactory. The final potential circuit design is shown below, where Rx is the resistance of the soil.
Team 02 – 28 Figure 10 - Wheatstone Bridge Circuit Followed by a Different Amplifier (Sensor)
The equation that relates the resistance at Rx to the output voltage was found by substituting the difference amplifier output voltage into the wheatstone bridge formula. The final formula that dictates what the measured resistance is, is shown in Equation 2.
Team 02 – 29 However, the above equation does not take into account the resistance of each probe. The
equation can be modified such that Rx=Rprobe1+Rprobe2+Rsoil.
[DB]
3.1.2.2.5 Soil Resistance Calculations
It will be necessary to measure the resistance of the soil that the sensor will be expected to monitor beforehand. This is because the resistivity of soil depends on the soil’s chemistry, which differs depending on the region. A range of soil resistances can be determined by gathering a sample of soil, drying it out and simply measuring the resistance with an
ohmmeter. A controlled amount of water should then be added and the resistance measured; up to the point where the soil is completely saturated. This data will allow for the creation of a moisture-to-resistance model and will greatly aid in the design and operation of the sensor. The model should be able to refer a volumetric water percentage given a measured resistance. To have a baseline, measurements taken by Md. Abdus SALAM, Quazi Mehbubar RAHMAN, Swee Peng ANG, and Fushuan WEN using the Wenner four pole method at a probe distance of 30cm yielded a soil resistance range of ~15-70 ohms. Where 15Ω represents wet soil and 70Ω is dry soil. It was not specified how much water was added to make the soil “wet” or how little for “dry” soil. This is another reason to do measurement experiments. [16]
Team 02 – 30
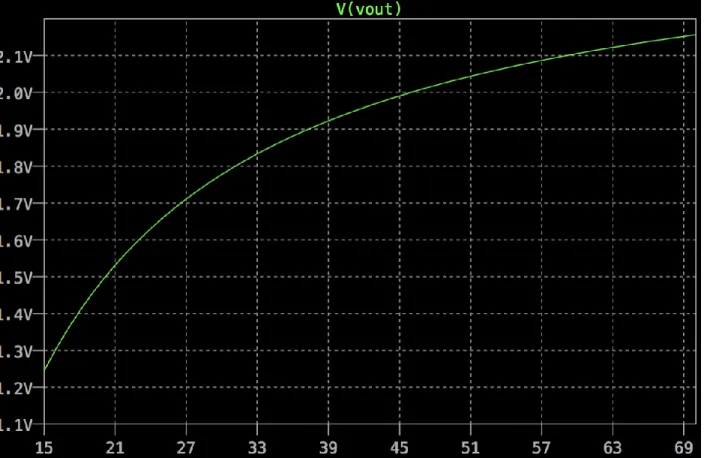
3.1.2.2.6 Simulation
A simulation of the sensor circuitry yielded the following graph. By measuring the output while varying the resistor Rx in a range consistent with researched soil resistance, an expected
resistance to output voltage graph was formed.
Team 02 – 31
3.1.2.3 Structural Design
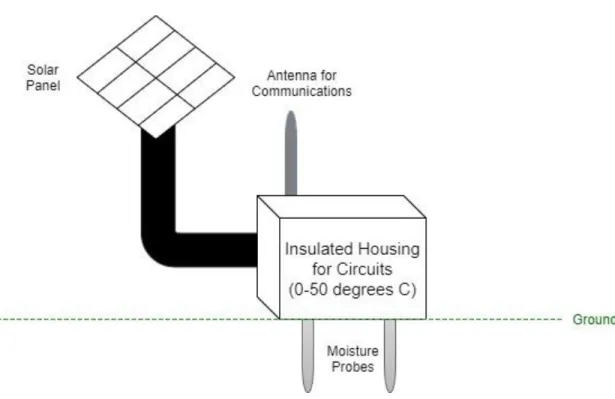
A simple structural design is shown below:
Figure 12 - Structural Design
The solar panel will be elevated above the ground. It will have an adjustable angle for the user to optimize. The housing will be insulated so that the circuitry will not go below 0 degrees Celsius or above 50 degrees Celsius. The components, especially the Lithium Ion Rechargeable Battery, will overheat and/or not work outside of this temperature range. In addition, the housing will be waterproofed so that the circuitry will not be damaged. Keeping that in mind, the opening for the solar panel connection to the housing should be on the side of the box to try to diminish any amount of water leakage. Lastly, there will be an antenna protruding from the top of the insulated housing for communication purposes.
Team 02 – 32
3.2 Software Design
3.2.1 Communications
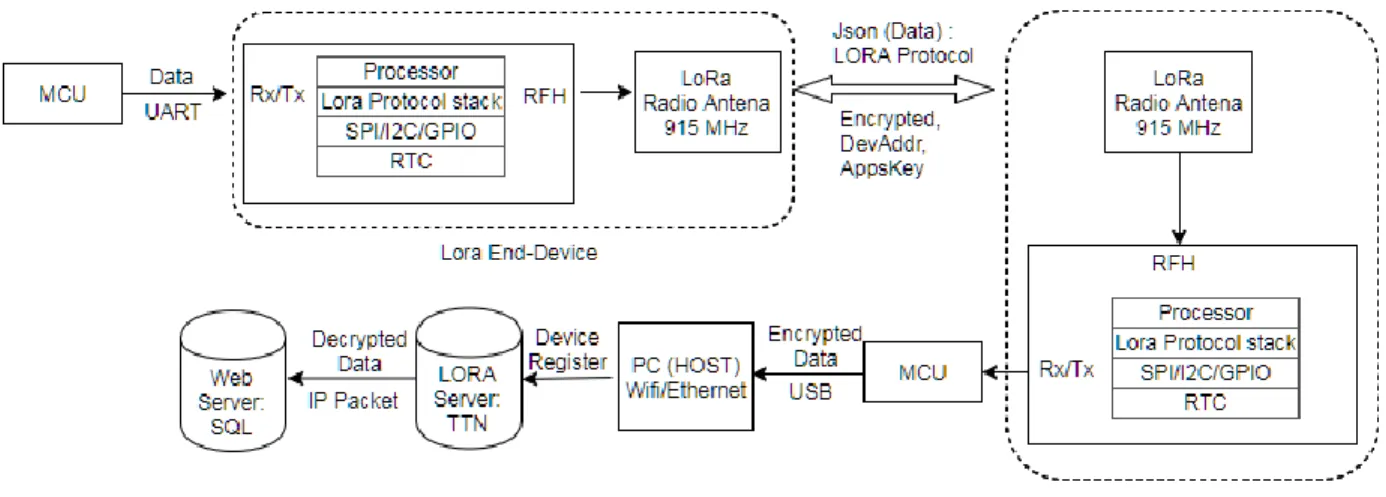
A possible solution would be to use an End-Node module which will send the moisture data from the sensor to another End-Node module. The moisture data would then be accessible by the user through a user interface on a mobile device computer. The LoraWan technology was considered because it has a wide communication range (up to 10 km) and low power-consumption (Rx current:13.5mA and Sleep Mode: 22uA). The Lora device will be in sleep mode automatically if there is no input for more than 30 seconds. However, there are some limitations for using those in this project due to the high price. There are some alternative options for using Lora
technology, but with the limited LPWAN (Low Power Wide Area Networks) technology as a trade-off. Another new option is Xbee. The full application of LoraWan needs three devices; Class A end-node, Class B gateway and LoraWan Server. Class B gateway has more receiving slots to listen to multiple nodes and IP forwarding protocol to the server. The communication between the node use Lora Radio Transceiver with 915 MHz band and FSK (Frequency-Shift Keying) modulation. Instead of using multiple listener of Gateway, the same end-node can also be communicated with each other. However, the limitation is that it only communicates with one node and it cannot connect to the LPWAN directly since it has no decrypt mode and IP
Team 02 – 33 forwarding protocol. But it can still connect to the LPWAN through the PC and act as Gateway.
Figure 13 - Node-to-Node (Class A) Communication without Gateway
[DB, SJL]
3.2.2 General Design
The software of the moisture sensor will consist of four main parts: microcontroller, wireless module, server and user-interface. The microcontroller has ADC (convert analog to digital data), wireless module (send data to server using GSM module), server side (data stored in MySql database) and User-Interface (data log, retrieving data).
Team 02 – 34 Figure 14 - Software Block Diagram Level Zero
Module Software System
Designer Jaclyn Miller and Seung Jun Lee
Inputs Moisture Data
Outputs User Interface
Description Take the input, the moisture data, from the moisture sensor, process it, and display it to the user.
Table 10 - Software Functional Requirement Level Zero - Software System
Figure 15 - Software Block Diagram Level One
Module Microcontroller
Designer Jaclyn Miller and Seung Jun Lee
Inputs Moisture Data
Outputs Wireless Module
Functionality Process data. This will be done by keeping track of the time such that every 12 or 24 hours the microcontroller will activate the sensor to take a moisture level reading. It will then process this information and transfer it to the Wireless Module.
Team 02 – 35 Module Wireless Module
Designer Seung Jun Lee
Inputs Microcontroller Moisture Level Data
Outputs Server
Functionality The wireless module will transmit the information or the moisture level from the sensor that has been processed by the microcontroller to the server. This may be done by wi-fi, Zibee, or any other similar technology.
Table 12 - Functional Requirement Level One - Wireless Module
Module Server
Designer Seung Jun Lee
Inputs Wireless
Outputs User Interface
Functionality The server will allow the transfer of data from the wireless module to the user interface.
Table 13 - Functional Requirement Level One - Server
Module User Interface Designer Seung Jun Lee
Inputs Analog Data Input
Outputs Graph in Web/Mobile Application
Functionality The user interface will allow the user to visualize the data and analyze it. Table 14 - Functional Requirement Level One - User Interface
Team 02 – 36 Figure 16 - Software Block Diagram Level Two
Module Microcontroller Designer Seung Jun Lee
Inputs ADC Analog Input
Outputs Digital Data
Functionality The digital data input as Microcontroller and transmit to SQL Data server by GSM Module. However, we decided not to use GSM Module due to their power consumption and price. We will update the block diagram once final design is accepted.
Table 15 - Functional Requirement Level Two - Microcontroller
Module Lora Module Designer Seung Jun Lee
Inputs Digital Data
Outputs Data Packet with Notification System
Functionality The digital data input as Microcontroller and transmit to SQL Data server by Lora Module.
Team 02 – 37 Module Server Side
Designer Seung Jun Lee
Inputs Data will be stored in the SQL Database Outputs Display data in Mobile phone
Functionality The web and mobile application is developed by the PhoneGap platform, which will create mobile app with web source code. The data in the database is retrieved by the sql query and display on the mobile app and web application.
Table 17 - Functional Requirement Level Two - Microcontroller
3.2.3 Microcontroller Requirements
As defined by the hardware team, the following pins are needed in the Microcontroller:
1 PWM output for the moisture level sensor
1 ADC inputs for the moisture level sensor
1 possible clock reference for the power optimization
In addition to this, other basic pins are needed for powering the microcontroller or for the software. These pins include the following:
Vcc, this is normally 5v or 3.3v
GND
An Internal Timer, this is needed for the software and will be described later
Lastly, the microcontroller must use as little power as possible. To do this, the microcontroller will have three modes of operation:
Idle Mode
Team 02 – 38 On Mode
[JM]
3.2.3.1 PWM Outputs
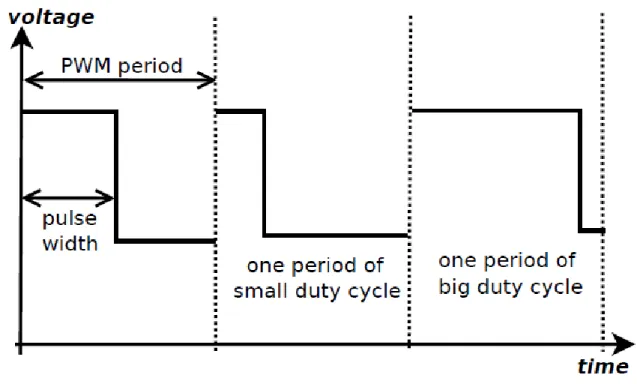
PWM or Pulse Width Modulation is a term that explains a digital signal or square wave. PWM can be used to control a voltage output to to dictate a component's on and off time. In this system’s case, PWM will be used to control five switches, four of which will be in the power optimization section and the last will be used in the moisture sensor. The PWM is defined by the duty ratio, D. The duty ratio is defined by the following:
Equation 3
Where TON is the time in which the signal is on and where T is the period. Thus, D will range from
0 to 1. The figure below, Figure 17 - PWM Graph, from Professor Forrest Sheng Bao’s Embedded Systems Interfacing lecture notes, helps explain the PWM signal. The frequency at which the signal repeats will also be an important factor in the switching process. For example, the switch going to the sensor will have a very low duty ratio and frequency. The frequency will be very low because the sensor does not need to be on all day long. The duty ratio will also be very small, closer to 0 than 1, because the sensor only needs to be on for a short amount of time each time it takes a measurement. The PWM for the switches in the power optimization area will most likely be at a higher duty ratio and frequency. They may also be dynamic or dependent on other factors such as the modes of operation of the power supply.
Team 02 – 39 Figure 17 - PWM Graph
[JM]
3.2.3.2 ADC Inputs
ADC, or Analog to Digital Converter, is used to convert an analog signal to a digital signal so that the microcontroller can process the signal’s information. Converting the signal is completed by periodically sampling the signal voltages. For each of the voltages a finite amount of binary bits are used to represent the voltage value. After this process has occurred the signal has been digitalized.
Two of the ADC inputs will be used in the power optimization part of the system and the other will be used in the sensor. The two in two power optimization will be used for the voltage monitors. It will let the microcontroller know the status of the solar panel and the battery. The other ADC input will be used in the sensor. In the sensor, the moisture of the soil will be
Team 02 – 40 converted into a voltage level and that voltage level will be ADC input. This input will then be processed by the microcontroller and be sent to the user.
[JM]
3.2.3.3 Clock Reference
The clock reference may be used for the power optimization. The clock reference will be used to control the voltage regulators. At this point in the design it is not known if this is needed. This may not be decided until the implementation process and will be discussed further at that time.
[JM]
3.2.3.4 Internal Timer
An internal timer is needed to control the switches and the active and sleep periods of the
microcontroller. This timer will be running in the background non-stop even in the sleep periods. This will tell the microcontroller when to wake up. When awake, it will regulate the switches and will be able to tell the sensor to turn on. The internal timer may also be used for other uses that are not yet determined.
Team 02 – 41
3.2.3.5 Modes of Operation
As mentioned above, there will be three modes of operation:
Idle Mode
Turn On/Off Mode
On Mode
During the idle mode very few things will be running on the microprocessor such as the timer. This mode will consume the least amount of power. The idle mode will be the mode the microcontroller is in the majority of the time. The turning on/off mode will consume more energy, however, this mode will not happen for a long period of time. The energy needed to turn on or off the microcontroller is different for each microcontroller. The on mode will use the most amount of energy and should not be on for a significant period of time. The duration of this mode will depend on the time needed to process the information from the sensor. The total energy needed will be determined by the summation of the energy needed in each mode. To help visualize this concept, see Figure 18 - Required Energy for the Microcontroller.
Team 02 – 42 Figure 18 - Required Energy for the Microcontroller
[JM]
3.2.4 Microcontroller Data Flow
The input data from the moisture sensor is a very small data bit in terms of the data transfer rate on communication part (Range of 40Mb/s), which the input data is around 2 or 3 bit (of range of 10 integer). So there is not much logic to design in the microcontroller software development. However, utilizing the Interrupt service for sleep mode and UART communication will result in a better output in terms of resource management in the microcontroller. The PIC24 family microcontroller has been chosen for standards for this process.
Team 02 – 43
3.2.4.1 RTCC Module
When the microcontroller first powers up, it initializes the ISR priority (set as 1) for RTCC alarm module. Since this implementation is only collecting and sending data during certain times of day, the whole CPU in the microcontroller and the Wireless Module (Lora) should be in sleep mode. The power consumption of the microcontroller and Lora device is very low while in sleep mode. This is within the range of 20mA*Fixed voltage for microcontroller and 30mA for Lora device. There also is a deep-sleep mode which has a range of nano ampere. The overall steps of RTCC module can be shown below. First, check the calibration for minor errors (PIC24
microcontroller has an average of 3 seconds delay every start). Then, it will mapping the pre-defined prescaler and set the wake up time based on the mask (4 bit) which is configured. It will call the interrupt service and continue executing from the last instruction of the register. It needs an external crystal oscillator (32.768kHz for PIC24 family).
Team 02 – 44 Figure 19 - Software Block Diagram Level Three: RTCC Module (Sleep Mode)
Team 02 – 45 Module RTCC-Calibration
Designer Seung Jun Lee
Inputs Measure current frequency
Outputs Update correct frequency into calibration register
Functionality This calibration runs every minute and check the 8-bit register in lower half of the calibration register. The equation for measuring the offset of current frequency is subtract from the ideal frequency, which is 32768 in this case. If the subtraction result negative, which means the current frequency is larger (faster) and vice versa. The correct value of frequency when it is faster is to subtract the value and add the value when slow. This will update the correct value of RTCC frequency.
Table 18 - Functional Requirement Level Three- RTCC-Calibration
Module RTCC-ISR Alarm Register Designer Seung Jun Lee
Inputs Pre-defined Mask : 0101 (Every Hour) Outputs Alarm for Interrupt service
Functionality The mask 0101 (every hour in our project) will call the interrupt, which I set this ISR priority as 1 when initialize the microcontroller, and wake up the system from the sleep mode.
Table 19 - Functional Requirement Level Three- RTCC-ISR Alarm Register
[SJL]
3.2.5 ADC/LCD Module
The LCD module had read and write bits, enable bits and an 8 bit register for data transmission. This is configured by the MCU as shown below. The ADC module have two channels (channel 0 for an 10 bit and other channel for an 8 bit). Since there is not a large amount of data, channel 0 can be selected, which has output range of [0-256]. With the given sampling time, in this case 3* T_AD, the digital will save in the ADC buffer register and later will be sent to the UART register.
Team 02 – 46 Figure 20 - Software Block Diagram Level Three: ADC/LCD Module
Module ADC/LCD
Designer Seung Jun Lee
Inputs Analog Input
Outputs Sequence of 8 bit Digital
Functionality After the channel number and sampling time is selected, the analog input wait for flag bit for the conversion. The converted digital data will stored in ADC buffer register and shift it to the UART register.
Table 20 - Functional Requirement Level Three-ADC/LCD Module
Team 02 – 47
3.2.5.1 ISR UART Module
This UART module is interrupt service driven. The data from the ADC buffer will first shift to the UART FIFO buffer. The interrupt will be called every time the tail of the buffer is not the same as the head (which indicates the buffer is not full). The tail will increment when the
interrupt is called and it will keep track of the buffer space. The tail and head is a pointer and the data will be sent to the Tx of UART if they are same (full). This will make the chain process of data register between FIFO buffer and UART register, without waiting for the flag to be set free like the ADC part.
Team 02 – 48 Module ISR UART Module
Designer Seung Jun Lee
Inputs Digital Data from the ADC buffer Outputs Digital Data send to Tx
Functionality The FIFO buffer is 9 bit wide and it holds the data before move to the shift register. Without ISR service, the data should be hold until all the data in shift register is sent to the Tx. With ISR, as soon as the one bit of data is send to the Tx, the next bit will be sent by the FIFO buffer.
Table 21 - Functional Requirement Level Three-ISR UART Module
[SJL]
3.2.6 Building Wireless Network (Lora)
Possible Option 1: Node-to-Node (Class A) Communication without Gateway
Team 02 – 49 Module Lora End-Device
Designer Seung Jun Lee
Inputs Digital Data UART (MCU)
Outputs Digital Data send to another Lora End-Device using Transceiver
Functionality The device will wakeup if there is any external input or data coming from the MCU. Then the end-device will call the Lora_init() and Lora_wan() function to make the data protocol with data received from the UART, its device key, data address and session key. This will protocol will be encrypted and transfer to another end-device connected to the host PC.
Table 22 - Functional Requirement Level Three-Lora End-Device
Module Lora End-Device (Host Side) Designer Seung Jun Lee
Inputs Encrypted Data Protocol from Lora End-Device Outputs Data Protocol send to PC via USB
Functionality Since this Host-side is not a gateway, it has no decryption and IP protocol forwarding, so it needs to be connected to PC to make connection to the Lora Network to see the data. After the data protocol is received, the host-side end devices will register its device id to the network via USB to host computer and send the data packet. The data will be availalbe in the any Lora hosting web site.
Table 23 - Functional Requirement Level Three-Lora End-Device (Host Side)
[SJL]
3.2.7 User Interface (Web/Mobile Application)
The front end tool, which is a client-side interface, will be developed in HTML and java-scripts. The back end tool, which is a server-side interface with a database, will be developed in PHP and MYSQL. The front-end page scripts are “login.htm”, “register.htm”, “notify_set.htm” and
“data.htm.” The back end server scripts are “register.php” and “member_req.php”. Between the client-side and the server-side, “action.php” and “dbcon.php” classify the request from the users and direct to the right function of the server-side scripts. The “dbcon.php” script sends MYSQL
Team 02 – 50 query to the server to make a connection, and input, retrieve and update the data. The system design is categorized into three modules; a user management, a notification management and a real-time graph. The user management enables new users to have a registration into the database with an ID, encrypted password and contact information (Email or Phone). These are saved into the database by calling the server side script, “register.php.” The existing users are distinguished by their own keyword in the database. The existing users can login through “login.htm‟ and register each water sensor on “notify_add_mod.htm.” This also enables users to setup the notification by inputting the maximum or minimum values desired of the collected moisture level. Users can add, delete or update the notification setup for each sensor on “notification.htm.‟ These requests of user management and sensor management are sent to “mem_req.php‟ on the server side through “action.php.” The main feature of the system is monitoring the real-time data by graph. The graph on “data.htm” enables users to input a preference of dates (“today”,
“yesterday”, “last seven days”, “this month” and “last month”) to see a real-time data read by the sensor. The user id and device id sensor and the range of selected date from “data.html” are used to retrieve corresponding data from the database via “member_req.php.” For the daily-based graph, the data is retrieved and displayed in an hour scale by calculating an average value of data in each hour. For the monthly-based graph, the data is retrieved and displayed in a day scale by sorting the maximum and the minimum value in each day. These processes can be achieved by the server side of “member_req.php‟ with sending SQL query to the database.
Team 02 – 51 Figure 23 - Software Block Diagram Level Three: User-Interface (Web/Mobile Application)
[SJL]
4.0 Accepted Implemented Design 4.1 Power Design Implementation
The implemented power design changed multiple times within the semester due to various restrictions. At the beginning of the semester it was determined that there would be a buck-boost and a buck circuit in the design. The buck-boost converter would take a voltage of 9V to 4V and either buck or boost it to the desired 5V, shown in Figure 24 and Figure 25. Similarly, the buck converter would take the 9V to 4V input and always buck it to 3.3V, shown in Figure 26. For the buck-boost circuit the following equations and table of values were calculated.
𝑉𝐼𝑁= −𝑉𝑜(1 − 𝐷
Team 02 – 52 For an inductor ripple current of 10%:
∆𝐼𝐿 𝐼𝐿 = 0.1 𝐼𝐿= 𝑉𝐼𝑁𝐷 𝑅(1 − 𝐷)2 𝐿𝐶𝐿𝑂𝑆𝐸𝐷 =𝑉𝐼𝑁𝐷𝑇 ∆𝐼𝐿 𝐶 = 𝐷 𝑅𝑓∆𝑉𝑉𝑜 𝑜 Assume f=100kHz
Parameters
IL
Δ
IL
LCLOSED
C VIN=4V, RL=15Ω 0.752A 0.0752 296mH 3.7µF VIN=4V, RL=70Ω 0.161A 0.0161 1.38mH 794nF VIN=9V, RL=15Ω 0.001397A 0.0001397 230mH 2.38µF VIN=9V, RL=70Ω 0.111 0.0111 2.89mH 510nFTable 24 - Calculated Values for Buck-Boost Converter
The chosen inductance value must be large enough to store the required amount of energy to ensure continue current. The circuit must stay in continuous current mode. Thus, the scenario 3 must be used for the inductance because it has the smallest current through the inductor and the largest value of the inductor. Lc was therefore calculated to be 230mH. For the capacitor,
Team 02 – 53 scenario 1 must be used because it has the largest capacitance. C= was therefore calculated to be 3.7µF.
For the buck circuit the following equations and table of values were calculated.
𝐷 = 𝑉𝑜 𝑉𝐼𝑁, 𝑤ℎ𝑒𝑛 𝑉𝐼𝑁 = 4𝑉 𝐷 = 0.825 𝑎𝑛𝑑 𝑤ℎ𝑒𝑛 𝑉𝐼𝑁 = 9𝑉 𝐷 = 0.367 𝐿𝑀𝐼𝑁 =(1 − 𝐷)𝑅 2𝑓 𝐶 = 1 − 𝐷 8𝐿(∆𝑉𝑜 𝑉𝑜 ⁄ )𝑓2 Parameters LMIN C VIN=4V, RL=15Ω 13mH 98.5pF VIN=4V, RL=70Ω 61mH 98.5pF VIN=9V, RL=15Ω 47mH 356pF VIN=9V, RL=70Ω 222mH 356pF
Table 25 - Calculated Values for Buck Converter
Similarly, to the buck-boost converter, the largest inductor and capacitor values are chosen to keep the converter in continuous current mode, thus, L=222mH and C=356pF.
Team 02 – 54 Figure 24 - Buck-Boost Converter Buck Mode Circuit and Simulation
Team 02 – 55 Figure 26 - Buck Converter Circuit and Simulation
This would directly follow the solar panel. The solar panel could vary anywhere from 9V-4V at approximately 6W and would still be able to supply enough energy for the whole circuit. Upon further calculations, the power that the system needed was dramatically less than initially
thought. There were also other restrictions from the solar panel such as the size of the solar panel impeding with crops. Another reason it was left out was the maintenance to the unit would be greatly higher. As stated in the marketing requirements, any maintenance should be minimal. Thus, the solar panel was removed from the design. Since the solar panel was removed, a 9V battery pack was used instead. The benefit of still using the converter design was that the battery could deplete all the way to 4V and still be able to properly power the system. The 5V output of the converter would then power the rest of the circuit. A PIC16F690 was used to create a PWM as the switching component. The following equations show some of the values that were used in setting up the PWM in the PIC.
𝑇 = (𝑃𝑅2 + 1)4𝑇𝑂𝑆𝐶(1)
Team 02 – 56
𝐷 = 𝑥
4(𝑃𝑅2 + 1), 𝑡ℎ𝑢𝑠 𝑥 = 44.48 𝑑𝑒𝑐𝑖𝑚𝑎𝑙 = 00101100 ℎ𝑒𝑥
The PIC was able to create a PWM that would theoretically drive the Mosfet. However, the design overlooked the simple fact that the drain of the Mosfet was at a higher voltage than the gate. Because of this, the switch would never turn on. Thus, the design of both of the converters are very flawed. The switching component of the converter should have been more fully thought through, however this was a simple mistake that was overlooked. Due to the sudden halt in the converter design, the power design was once again changed.
The design was changed to use a linear regulator. Figure 27 shows the linear regulator circuit that was used.
Figure 27 - Implemented Linear Regulator Design
A fuse and diode were used to help mitigate any issues with the system. The output of the circuit is 5, which then goes to the moisture sensor. The 9V or the 5V may be used to connect the LORA devise to power. Once this new design was implemented there was no more issues with
Team 02 – 57 the power design. Below is a figure showing the linear regulator circuit implemented on a perf board.
Figure 28 - Final Implemented Linear Regulator Perf Board
[JM]
4.3 Power Calculation Update
Through observation, the system takes about 30 seconds to connect to the network and send the data measured by the sensor to the gateway. The time needed for this process depends greatly on the environmental surroundings of the Lora node. Therefore, 30 seconds is only an
approximation. For the power calculation, 30 seconds was assumed to be the time needed. A 9 volt energizer battery has 5.49 watt hours which is equal to 19764 watt seconds. Our system measures moisture 24 times a day which requires that the system be on for 30 seconds each measurement, which translates to 720 seconds a day. Since the system uses 122mW while on, 2mW from the sensor and 120mW from the Lora board, the system will use 87.84 watt seconds each day. 19764/87.84 equals 225 days of measuring. If a user needs the system to last longer, the number of measurements taken each day can be reduced to greatly improve battery life. For example, should the user be content with only measuring 6 times a day, the system should last
Team 02 – 58 for approximately 900 days on a single 9 volt battery. Thus, the system can sufficiently last an entire planting season without the aid of an external solar panel charging system.
[DB]
4.4 Sensor Design Implementation Update
Measurements of damp potting soil were taken and found to be ~50kOhms. The measurements were taken using a Fluke digital multimeter. Because of these measurements, the sensor circuitry had to be changed. That is to say, the previous design did not produce the results needed for this application. The balanced state of the Wheatstone bridge was chosen to be 47 kOhms, with the intention of producing a circuit that has a voltage difference of zero volts between the two branches. Since the moist soil has a resistance of ~50 kOhms the voltage difference will be close to zero volts. Therefore, a higher voltage level translates to a greater resistance between the two probes; which means less moisture is prevalent in the soil. The difference amplifier circuit maintained a gain of 1 and the resistors were chosen to be 1 Mega Ohm. The resistors needed to be sufficiently high enough to prevent current from leaving the Wheatstone bridge circuit. Because the resistors were greatly increased, the buffer circuits were removed, as they were no longer needed. The sensor probe design consists of two stainless steel rods cut to 4 inches in length for the purpose of reaching the optimal depth for most plants. Diameter of 1/8 of an inch with a separation distance of 2 inches. Stainless steel was chosen due to its corrosion resistance properties. Figure 29 shows the final sensor circuit that was implemented. Figure 30 shows the power that is absorbed by the sensor.
Team 02 – 59 Figure 29 - Implemented Sensor Circuit
Figure 30 - Power Absorbed by the Sensor
Team 02 – 60
4.5 Structural Design Implementation Update
The only thing in the structural design that changed was the removal of the solar panel. The following figures show the updated structural design.
Figure 31 - Updated Structural Design
Figure 32 - Implemented Structural Design
Team 02 – 61
4.6 Software Design Implementation Update 4.6.1 The Theory of Operation
The software will consist of three main components: microcontroller (Laird RM191), wireless communication (Lora end-device and gateway) and the user-interface (web/mobile application). At first, the microcontroller component provides three operations: sleep mode, ADC and UART interface. The sleep mode closes the UART interface and Lora network joining and wake up the system by the event handler, such as timer (set by user) or GPIO input (reset button on the device) mode provides the low power mode (draws range of 20mA current). The ADC module enables sampling time (3xA/D Conversion Clock) and perform conversion of sequence of 8/10 bit of analog data into digital value and store into ADC buffer register. The UART interface is ISR driven and enables FIFO buffer (9 bit wide) to hold the data and send to Tx (uplink) of interface or receive in Rx (downlink). ISR performs keep track of buffer size and chain process of data movement between buffer and UART register. At second, the wireless component provides Lora Technology: enables 915MHz radio antenna, Frequency-Shift Keying (FSK) and Lora protocol (encrypted JSON format). The JSON data packet contains the value from UART register, Device Address, Session Key and Data Address. This component enables wireless communication between end-device and gateway. The registered Lora gateway joins the Lora Wan network to decrypt the data and forward Lora data packet to standard IP protocol (Web Server). The data format is sent to SQL server by HTTP integration. At last, the user-interface component provides two module: server side and user side. The server side performs sql query to retrieve, store and modify data on database. The user side provides GUI interaction with users; the real-time graph, remote power control and email notification system.