Title
On the physics of thermal-stability changes upon mutations of
a protein.
Author(s)
Murakami, Shota; Oshima, Hiraku; Hayashi, Tomohiko;
Kinoshita, Masahiro
Citation
The Journal of chemical physics (2015), 143(12)
Issue Date
2015-09-30
URL
http://hdl.handle.net/2433/202571
Right
© 2015 American Institute of Physics. This article may be
downloaded for personal use only. Any other use requires prior
permission of the author and the American Institute of Physics.
Type
Journal Article
Textversion
publisher
Shota Murakami, Hiraku Oshima, Tomohiko Hayashi, and Masahiro Kinoshita
Citation: The Journal of Chemical Physics 143, 125102 (2015); doi: 10.1063/1.4931814 View online: http://dx.doi.org/10.1063/1.4931814
View Table of Contents: http://scitation.aip.org/content/aip/journal/jcp/143/12?ver=pdfcov
Published by the AIP Publishing
Articles you may be interested in
Confinement in nanopores can destabilize α-helix folding proteins and stabilize the β structures
J. Chem. Phys. 135, 125101 (2011); 10.1063/1.3641482
Protein stability at a carbon nanotube interface
J. Chem. Phys. 134, 125101 (2011); 10.1063/1.3558776
Predicting stability of alpha-helical, orthogonal-bundle proteins on surfaces
J. Chem. Phys. 133, 115102 (2010); 10.1063/1.3479039
Molecular simulation of protein dynamics in nanopores. I. Stability and folding
J. Chem. Phys. 128, 115105 (2008); 10.1063/1.2894299
Phosphorylation effect on the GSSS peptide conformation in water: Infrared, vibrational circular dichroism, and circular dichroism experiments and comparisons with molecular dynamics simulations
THE JOURNAL OF CHEMICAL PHYSICS143, 125102 (2015)
On the physics of thermal-stability changes upon mutations of a protein
Shota Murakami,1Hiraku Oshima,2Tomohiko Hayashi,2and Masahiro Kinoshita2,a)
1Graduate School of Energy Science, Kyoto University, Uji, Kyoto 611-0011, Japan 2Institute of Advanced Energy, Kyoto University, Uji, Kyoto 611-0011, Japan
(Received 8 June 2015; accepted 14 September 2015; published online 30 September 2015)
It is of great interest from both scientific and practical viewpoints to theoretically predict the thermal-stability changes upon mutations of a protein. However, such a prediction is an intricate task. Up to now, significantly many approaches for the prediction have been reported in the literature. They always include parameters which are adjusted so that the prediction results can be best fitted to the experimental data for a sufficiently large set of proteins and mutations. The inclusion is necessitated to achieve satisfactorily high prediction performance. A problem is that the resulting values of the parameters are often physically meaningless, and the physicochemical factors governing the thermal-stability changes upon mutations are rather ambiguous. Here, we develop a new measure of the thermal stability. Protein folding is accompanied by a large gain of water entropy (the entropic excluded-volume (EV) effect), loss of protein conformational entropy, and increase in enthalpy. The enthalpy increase originates primarily from the following: The energy increase due to the break of protein-water hydrogen bonds (HBs) upon folding cannot completely be cancelled out by the energy decrease brought by the formation of protein intramolecular HBs. We develop the measure on the basis of only these three factors and apply it to the prediction of the thermal-stability changes upon mutations. As a consequence, an approach toward the prediction is obtained. It is distinguished from the previously reported approaches in the following respects: The parameters adjusted in the manner mentioned above are not employed at all, and the entropic EV effect, which is ascribed to the translational displacement of water molecules coexisting with the protein in the system, is fully taken into account using a molecular model for water. Our approach is compared with one of the most popular approaches, FOLD-X, in terms of the prediction performance not only for single mutations but also for double, triple, and higher-fold (up to sevenfold) mutations. It is shown that on the whole our approach and FOLD-X exhibit almost the same performance despite that the latter uses the adjusting parameters. For multiple mutations, however, our approach is far superior to FOLD-X. Five multiple mutations for staphylococcal nuclease lead to highly enhanced stabilities, but we find that this high enhancement arises from the entropic EV effect. The neglect of this effect in FOLD-X is a principal reason for its ill success. A conclusion is that the three factors mentioned above play essential roles in elucidating the thermal-stability changes upon mutations. C 2015 AIP Publishing
LLC.[http://dx.doi.org/10.1063/1.4931814]
I. INTRODUCTION
Maintaining the function of a protein at a temperature above the thermal denaturation temperature Tmof its native
state is a principal objective of researchers in a variety of fields related to biophysics and biochemistry.1 This enhancement
of the thermal stability, in general, can also lead to a higher stability against cooling, addition of chemical compounds, and change in pH. One of the methods of enhancing the thermal stability is the mutation. Though there are a number of possible mutations, only a small percentage of them actually lead to the enhancement with the protein function retained. It is strongly desired that the change in the thermal stability resulting from a mutation be predicted using a theoretical approach. The theoretical prediction is to be made on the condition that only the folded structure of the wild type is known (i.e., the folded structure of a mutant is unknown and there is no definite
a)Electronic mail: [email protected]
information on unfolded states of the wild type and the mutant). In the present article, we are concerned with the physico-chemical factors governing the thermal-stability changes upon mutations as well as the theoretical approaches toward the prediction based on chemical physics.
Up to now, significantly many approaches1–8for the
theo-retical prediction have been reported. They are concerned primarily with the free-energy difference between the folded and unfolded states∆Gat a given temperature (e.g., 25◦C) and
the change in∆Gupon mutation∆∆G. When the performance of an approach is examined,∆∆Gcalis compared with∆∆Gexp
(the subscripts “cal” and “exp” denote the calculated and experimental values, respectively). Though the most straight-forward way of evaluating the thermal stability is to look at Tm, ∆G has preferentially been employed.1 There are
two principal reasons for this: The construction of reliable ∆G is an important target in protein research and ∆G is certainly related to Tm. In most of the previously reported
approaches, ∆G comprises the components relevant to the
protein intramolecular energy, hydration free energy, and pro-tein intramolecular conformational entropy, and each compo-nent is further decomposed into multiple terms. Weighting coefficients are multiplied to the constituent terms of ∆G
and determined in advance so that ∆∆Gcalcan be best fitted
to ∆∆Gexp for a sufficiently large set of proteins and
muta-tions.2,4,6–8 It has been pointed out that the performance of an approach is remarkably dependent on the set of proteins and mutations employed for the fitting.8Though the weighting
coefficients determined should be close to unity in principle, some of the values obtained from the fitting are far from unity and even negative,2–4,6–8 which is physically unreasonable.
There is an approach3 in which the weighting coefficients
are not employed. However, it introduces two parameters in the modified Lennard-Jones (LJ) potential function defined between protein atoms. Moreover, ∆∆Gcalis multiplied by an
adjusting parameter η. A total of three parameters are thus introduced, and they are determined so that the root-mean-squared error between∆∆Gcaland∆∆Gexpcan be minimized.
The parameter ηshould be close to unity but the determined value is 0.2.3 Recently, a different type of approach9 has been reported. In this approach, electrostatics based on the Debye-Hückel (DH) theory and a simplified treatment of the hydration free energy are introduced into a Go-like model in which only the interactions present in the native structure are taken into account. The dielectric constant of water in the DH theory is set at 29: This value is far smaller than the rightful one 78. The interaction energy per native heavy-atom contact ξ is determined so that Tm of the wild type can be
matched with the experimental value. (There are two more parameters fitted to the experimental data.)Tmof a mutant is
then predicted and the change in Tm by the mutation, ∆Tm,
thus obtained is compared with the experimental value. The meanings of the Go-like model and the parameterξemployed, which largely vary from protein to protein,9are not physically sound.
We have shown that the driving force of protein folding is a large gain of water entropy10–12(our physical picture of the
folding is explained in Sec.II A). The water in the bulk makes a larger contribution to the gain than the water near the protein surface. Further, the protein-water-water triplet and higher-order correlations play critical roles in the gain. This entropic excluded-volume (EV) effect cannot be taken into account by a continuum model for water.10–12Using our theoretical method
emphasizing the effect, which is combined with a molecular model for water, we have succeeded in reproducing the large water-entropy gain upon apoplastocyanin (apoPC) folding13 experimentally estimated and in explicating the mechanisms of cold14 and pressure15 denaturating and of sugar-induced enhancement of the thermal stability.16(The importance of the entropic EV effect has been pointed out by other groups in different ways.17,18) The most serious drawback shared by all of
the previously reported approaches for predicting the thermal-stability changes upon mutations1–9 is that the entropic EV
effect is not taken into account. In the present article, we report the results of the first attempt to examine a theoretical approach for predicting the thermal-stability changes upon mutations, which possesses the following features: It is completely free from the parameters fitted to the experimental data and it
accounts for the entropic EV effect to its full extent. It is not an empirical approach but a physics-based one.
In earlier works, we proposed a measure of the thermal stability of a protein. The measure was defined as the water-entropy gain upon folding at 25◦C divided by the number of residues.19,20A larger measure implied higherTm. The validity
of the measure was corroborated for homologous proteins: the yeast, bacterial, and human orthologues of frataxins19and
four cytochromesctreated as models of mesophilic, moder-ately thermophilic, thermophilic, and hyperthermophilic pro-teins,20respectively. On the other hand, the structural diff
er-ences among the wild type and mutants of a protein are much smaller than those among homologous proteins. Nevertheless, these slight differences give rise to denaturation-temperature changes in various magnitudes. We first applied the measure to the present subject but found that the result was not very successful. Therefore, we decided to construct a new measure on the basis of our previously developed free-energy func-tion21,22including the enthalpic component as well. The func-tion has been tested for the discriminafunc-tion of the native fold from misfolded decoys: The success rate of the discrimination is almost 100%,21,22demonstrating its superiority over any of the previously reported functions in which the incorporation of the entropic EV effect is inadequate. However, the decoy structures are considerably different from the native structure. Further, it has only been shown that the function takes the lowest value for the native structure. Taken together, the subject tackled in the present study is significantly different from and much more delicate than the subjects treated in our earlier publications.19–22
In the present article, the performance of our approach is compared with that of FOLD-X2,23,24for 10 proteins and a total of 207 mutations including 18 double and 13 triple and higher-fold (up to sevenhigher-fold) mutations. The number of mutations changing the total charge of the protein is 81. FOLD-X is one of the most popular, successful approaches. In the version of FOLD-X employed by us, the number of the weighting coefficients is reduced to 1 but its recommended value is only 0.33.23,24It is still empirical in the sense that the terms in its
free-energy function are adjusted using the data from protein-engineering experiments and the experimental mutational free-energy changes.23,24We find that our approach and FOLD-X
exhibit almost the same performance. For multiple mutations, however, our approach is far superior to FOLD-X. This supe-riority is crucially important, because most of the mutations realizing remarkable enhancement of the stability are multiple mutations. Five multiple mutations for staphylococcal nuclease lead to highly enhanced stabilities. An important finding is that this high enhancement originates from the entropic EV effect. The neglect of this effect in FOLD-X is a principal reason for its ill success. The number of the factors taken into account in the new measure for our approach is still relatively small: They are the water-entropy gain, loss of the protein conformational entropy, break of protein-water hydrogen bonds (HBs), and formation of protein intramolecular HBs upon folding. The success mentioned above indicates that these physicochemical factors govern the thermal-stability changes upon mutations.
In our opinion, a variety of subjects regarding pro-teins (protein folding,13 cold denaturation,14 pressure
125102-3 Murakamiet al. J. Chem. Phys.143, 125102 (2015) denaturation,15thermal denaturation,19,20effects of cosolvent
addition on the structural stability,16 effects of mutations on the structural stability, etc.) should be elucidated in a unified manner within the same theoretical framework: A theory which can elucidate a particular subject but fails to elucidate the others, for example, is not a good one. Our goal is to develop a theoretical method which is capable of explicating a number of protein-related issues and demonstrate its versatility. A pivotal factor in the method is the entropic effect originating from the translational displacement of water molecules coex-isting with a protein. The present manuscript reports part of this development and demonstration.
II. NEW MEASURE OF THERMAL STABILITY OF A PROTEIN
A. Picture of protein folding
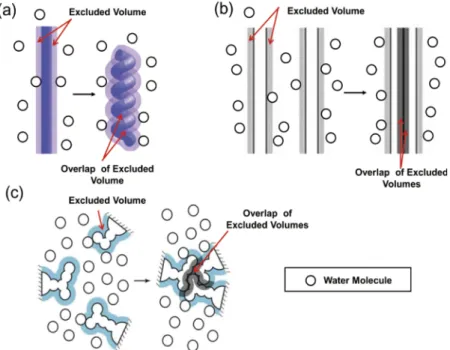
As illustrated in Fig.1, a backbone and side chains of a protein generate excluded spaces which the centers of water molecules cannot enter. The volume of an excluded space is “EV.” Upon formation ofα-helix andβ-sheet by the backbone (see Figs.1(a)and1(b)), the overlap of the EVs occurs and the total EV decreases by the overlapped volume.25Likewise,
large reduction of the total EV occurs when the side chains are closely packed (see Fig.1(c)).25A decrease in the total EV leads to an increase in the volume of the configurational phase space for water molecules, which is accompanied by a gain of water entropy. It is often claimed that intramolecular HBs and van der Waals attractive interactions within a protein play essential roles in driving a protein to fold. However, the folding undergoes serious dehydration comprising the loss of protein-water electrostatic and van der Waals attractive interactions and structural reorganization of water molecules near the pro-tein surface. The importance of the loss of propro-tein-water elec-trostatic attractive interactions was first pointed out by Honig and Nicholls.26Protein-water HBs form a pivotal component
of protein-water electrostatic attractive interactions. Terazima
et al.27showed that apoPC folding at 25◦C exhibits a
signif-icantly large enthalpic increase, proving that the dehydration effect dominates.13(The experimental technique of Terazima
et al.enables us to directly measure the enthalpic change upon protein folding at a given temperature.) Taken together, a large water-entropy gain surpasses the enthalpic increase and loss of the protein conformational entropy.10–13
B. Free-energy function for a protein and free-energy change upon protein folding
The free-energy functionFdefined by21,22
F=(Λ−T SVH)/(kBT0),T0=298 K (1)
has recently been developed by us on the basis of the phys-ical picture described in Sec. II A. Here, Λ is the sum of protein intramolecular energy and hydration energy,SVHthe
hydration entropy,T the absolute temperature, and kB
Boltz-mann’s constant. Λ,SVH, and F are functions of the protein
structure. F was originally developed for the discrimination of the native fold from many misfolded decoys. Since only very compact structures were treated in the discrimination, the protein conformational entropy was not incorporated in
F. In the present study, we introduce the free-energy change upon protein folding, ∆Φ=kBT0(FF−FU)−T∆SC (the
sub-scripts “F” and “U” denote the values of the folded (native) and unfolded (denatured) states, respectively, and ∆SCis the
change in the conformational entropy) expressed by
∆Φ/(kBT0)=(∆Λ−T∆SVH−T∆SC)/(kBT0), (2)
where ∆X denotes the change in X upon folding: ∆Λ >0, ∆SVH>0, and∆SC<0.
The protein insertion can be considered under either isochoric (constant-volume) or isobaric (constant-pressure) condition. The hydration free energy µtakes the same value irrespective of the insertion condition. However, this is not the case for the hydration energyEVHandSVH.28Fortunately,
FIG. 1. (a) Formation ofα-helix by a portion of the backbone. (b) Formation ofβ-sheet by portions of the backbone. (c) Close packing of side chains. The total excluded volume decreases by the overlapped volume, which leads to a corresponding increase in the total vol-ume available to the translational displacement of water molecules coexisting with the protein.
protein folding occurs with the system pressure and volume almost unchanged (the EV of a more compact structure is smaller but the partial molar volume is almost independent of the compactness).10,12It follows that the hydration energy and entropy under isochoric condition, respectively, are almost equal to the hydration enthalpy and entropy under isobaric condition. We adopt isochoric condition. Isochoric condition is free from compression or expansion of the bulk water by which the physical interpretation of a change in a thermodynamic quantity of hydration is made rather difficult.28
C. Water-entropy gain upon protein folding
∆SVH is a function of the number density of water ρ
andT. If ρis kept constant, ∆SVHbecomes larger asT
in-creases.29 IfT is kept constant, ∆S
VHbecomes smaller as ρ
decreases.29 It is experimentally known that above 298 K ρ
decreases progressively with increasingT: In this temperature region, the effect of ρdominates and ∆SVH is a decreasing
function ofT.29We then consider the wild type and a mutant
of a protein whose number of residues is Nr.SVH,U/(kBNr)is
not significantly dependent on the mutation if the total num-ber of S–S bonds remains unchanged upon mutation. How-ever, this is not true for SVH,F/(kBNr) that is quite sensitive
to the packing efficiency of the backbone and side chains in the folded state.19,20As a result, ∆SVH/(kBNr)(∆SVH=SVH,F
−SVH,U; ∆SVHis the water-entropy gain upon folding) varies
significantly from mutant to mutant. (∆SVH/(kBNr)of the wild
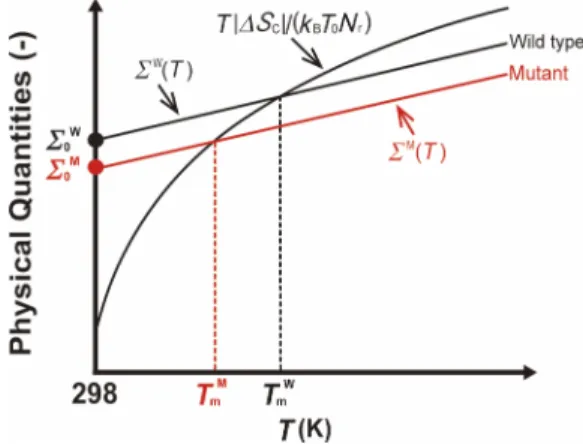
type is also significantly different from that of a mutant.) See Fig.2illustrating our physical picture of the thermal stability of the wild type and a mutant.
D. Loss of protein conformational entropy upon protein folding
The protein conformational entropy is denoted by SC.
Since the folded state is under structural constraint on
FIG. 2. Illustration of our physical picture for thermal stabilities of the wild type and a mutant of a protein. Σ(T)is defined by Eq.(3), ∆SCis
the conformational-entropy loss upon protein folding, Nrthe number of
residues,kBBoltzmann’s constant,Tmthe thermal denaturation temperature, Σ0=Σ(T0)(T0=298 K), and the superscripts, “W” and “M,” denote values
or quantities of the wild type and the mutant, respectively.ΣW(T)andΣM(T)
do not necessarily change linearly withT. The two solid lines ofΣW(T)and
ΣM(T)are not necessarily parallel.
account of its closely packed properties,SC,Fremains roughly
constant against an increase inT. SC,Uis much more
influ-enced by T. SC,U is related to the ranges of dihedral
an-gles allowed, which depend on the torsion energy andT.19,20 At lowT, angles giving only low torsion energy are acces-sible. As T increases, the allowed range of each angle is increasingly widened andSC,Ubecomes larger. AsTincreases
further, the enlargement of SC,U is diminished due to the
steric repulsion among atoms in a residue and in neighbor-ing residues. Therefore, dSC,U/dT >0 and d2SC,U/dT2<0
with the result of d|∆SC|/dT >0 and d2|∆SC|/dT2<0 (∆SC
=SC,U−SC,F).20 This temperature dependence of ∆SC has
been verified by Fitter’s experimental study.30 If the total
number of S–S bonds remains unchanged upon mutation,
SC,U/(kBNr)is almost constant whileSC,F/(kBNr)is essentially
zero, and|∆SC|/(kBNr)can be considered independent of the
mutation.
E. Enthalpy change upon protein folding
Protein folding is accompanied by a decrease in the pro-tein intramolecular energy (factor 1) and an increase in the hydration energy (factor 2).13Factor 2 originates from a loss of protein-water attractive (electrostatic and van der Waals) interactions and a gain of water-water attractive interactions ascribed to the structural reorganization of water near the pro-tein surface. Factor 1 remains unchanged against an increase in
T. Experimental results27have shown that factor 2 dominates
at 298 K and protein folding gives rise to an enthalpy increase and that factor 2 becomes weaker asT increases. The gain of water-water attractive interactions, which is largely influenced byT, is also significant in factor 2.∆Λis a strongly decreasing function ofT: It takes large, positive and negative values at 298 K and in the vicinity ofTm, respectively.
F. New measure of thermal stability of a protein We defineΣ(T)by
Σ(T)=−∆F/Nr=(T∆SVH−∆Λ)/(kBT0Nr), (3)
where∆X denotes the change inX upon protein folding. As illustrated in Fig.2considering the wild type and a mutant of a protein, the thermal stability can be argued by the compe-tition of Σ(T)andT|∆SC|/(kBT0Nr). The argument is based
on the free-energy change upon folding defined by Eq.(2). ∆Λ is a strongly decreasing function of T whereasT∆SVH
remains roughly constant against an increase in T. Hence, Σ(T) is an increasing function ofT. BelowTm, the folded
state is more stable than the unfolded state because Σ(T)
is larger than T|∆SC|/(kBT0Nr). The inversion occurs above
Tm, causing thermal unfolding. Σ0=Σ(T0)(T0=298 K) can
be a measure of the thermal stability. The larger Σ0 is, the
higherTm is. The slopes of the two solid lines for the wild
type and the mutant can be different, but the difference is assumed to be not large enough to invert the order of the thermal stability,TmW>TmM(the superscripts, “M” and “W,”
denote values for the mutant and the wild type, respectively) in Fig.2. We examine the correlation between ∆Σ0and ∆Tm
125102-5 Murakamiet al. J. Chem. Phys.143, 125102 (2015) defined as ∆Σ0=Σ0M−Σ W 0 , (4a) ∆Tm=TmM−TmW. (4b)
III. MODEL AND THEORETICAL METHOD A. Models of water and proteins
A multipolar model31,32is employed for water. A point
dipole and a point quadrupole of tetrahedral symmetry are embedded at the center of a hard sphere with diameter dS
=2.8 Å. We adopt the self-consistent mean field (SCMF) theory developed by Kusalik and Patey31,32 to account for
the effect of the molecular polarizability. SVHis determined
primarily by the geometric characteristics of a protein structure and rather insensitive to the protein-water interaction poten-tials. The insensitivity has been substantiated in our earlier studies.20,33For example, even when the protein-water elec-trostatic potentials are completely shut off,|SVH|of a protein
decreases only by∼5%. Therefore, we model a protein as a set of fused hard spheres just for calculatingSVH.10–16
B. Angle-dependent integral equation theory (ADIET) for molecular liquids
The ADIET29,31,32 is employed for calculatingS VH of a
spherical solute (see step (1) described in Sec. III C). The water-water and solute-water potentials and correlation func-tions are dependent on the Euler angles representing the orien-tations of water molecules. The details of basic equations and numerical solution procedure were described in our earlier publications.29,34 SVHis evaluated via the temperature
deriv-ative of µcalculated using the hypernetted-chain closure and the Morita-Hiroike formula adapted to molecular liquids.29By the ADIET combined with the multipolar water model, the dielectric constant of water is calculated to be 84 (this value is in close proximity with the experimental one 78).29Further,
µof a nonpolar solute calculated is in perfect agreement with that obtained from a Monte Carlo simulation.29
C. Calculation of hydration entropy of a protein with a prescribed structure
When a structure of a protein is given, itsSVHis calculated
by a hybrid of the ADIET and the morphometric approach (MA).35In the MA, the geometric characteristics of a solute molecule are represented by only the four measures,Vex,A,X,
andY.35Vexis the EV, Ais the water-accessible surface area
(ASA), and X andY are the integrated mean and Gaussian curvatures of the accessible surface, respectively. SVHis
ex-pressed by the linear combination of the four geometric mea-sures,35
SVH/kB=C1Vex+C2A+C3X+C4Y. (5)
The four coefficients (C1–C4) are dependent only on the
ther-modynamic state of the solvent and independent of the solute shape. Hence, they can be evaluated in the simplest geom-etries: for hard-sphere solutes (isolated atoms) with various
diameters. We refer to the effect expressed by Eq.(5)as the EV effect. At normal temperature and pressure,C1Vexusually
makes the largest contribution toSVH/kB.
The calculation consists of the four steps summarized below.13–16
(1) Calculate SVHof a hard-sphere solute with diameter dU
immersed in the multipolar-model water using the ADIET. Consider different values ofdUin the range, 0.6≤dU/dS
≤10, to obtain a sufficiently large set of data forSVHand
R(R=(dU+dS)/2).
(2) DetermineC1–C4by applying the least-squares method to
the following equation:
SVH/kB=C1(4πR3/3)+C2(4πR2)+C3(4πR)+C4(4π).
(6) Equation (6) is the linear combination of the four geometric measures for spherical solutes. The determined values are as follows:C1=−0.1968 Å−3,C2=0.0452 Å−2,
C3=0.2567 Å−1, andC4=−0.3569.
(3) CalculateVex, A,X, andY of a protein with a prescribed
structure using an extended version35of Connolly’s
algo-rithm.36,37 The x-y-z coordinates and diameters of the
protein atoms are the input data. The diameter of each atom is set at the sigma value of the LJ potential parameters taken from CHARMM22.38
(4) ObtainSVHfrom Eq.(5)to whichC1–C4determined in step
(2) are substituted.
The maximum value of dUconsidered in step (1) must
be sufficiently large so that the effects of the four geometric measures can fully be taken into account. We have verified thatdU=10dSis large enough: Altering 10dSto 30dSresults
in essentially no changes in C1–C4 determined. We
empha-size that protein molecules are not assumed to be ideally spherical. Step (4) is applicable to a variety of protein struc-tures including random coils or fully extended strucstruc-tures. More detailed descriptions are provided in our earlier publica-tions,10–12,35,39,40two of which demonstrated the high accuracy
of the MA.35,40
D. Calculation of energetic component for a protein with a prescribed structure
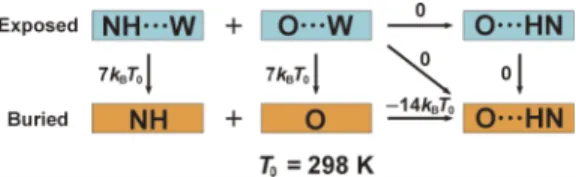
We briefly summarize the procedure for calculating the energetic component Λ(see the thermodynamic cycle illus-trated in Fig.3).21,22 A fully extended structure is chosen as
the reference one because it possesses the maximum number of HBs with water molecules and no intramolecular HBs:Λ=0.
FIG. 3. Thermodynamic cycle for calculating the energetic component Λ. “W” and “· · ·” represent a water molecule and a hydrogen bond, respectively, andkBis Boltzmann’s constant. This figure is illustrated for the case where
N is the donor and O is the acceptor though there are four different donor-acceptor combinations: (N, O), (O, N), (O, O), and (N, N).
Let us consider a transition from the reference structure to a more compact one. A gain of protein intramolecular interac-tions, loss of protein-water interacinterac-tions, and energy change caused by structural reorganization of water molecules near the protein surface are assumed to be cancelled out except for the following: When the break of HBs with water molecules is not compensated by the formation of intramolecular HBs, a serious energetic increase is caused and to be taken into account. The torsion energy, which is sufficiently low for any structure considered, can be neglected.
The structural transition defined above is followed by two cases: (i) a donor and an acceptor are buried in the protein inte-rior after the break of HBs with water molecules, but they form an intramolecular HB and (ii) a donor or an acceptor is buried but it finds no partner for a HB. No penalty is imposed in case (i) but a penalty of 7kBT0is imposed in case (ii).21,227kBT0is
based on the estimation that the free-energy lowering brought by hydrogen-bond formation between two formamide mole-cules in a nonpolar solvent is −14kBT0.41 The nonpolar
sol-vent mimics the environment of protein interior, and−14kBT0
includes the entropic gain of the nonpolar solvent upon the hydrogen-bond formation. The ASA of each donor or acceptor is calculated using Connolly’s algorithm.36,37 The donor or
acceptor is considered buried if its ASA is smaller than 0.001 Å2. On the basis of the criteria proposed by McDonald
and Thornton,42we determine whether an intramolecular HB is
formed or not. All of the donors and acceptors are examined for backbone-backbone, backbone-side chain, and side chain-side chain intramolecular HBs to calculateΛ.21,22
E. Proteins and mutations considered
We choose the proteins treated in experiments under the condition which satisfies the following: The values of Tm
and/or ∆∆Gexp were measured in aqueous solution whose
pH is in the range from 6 to 8; no denaturants were utilized in the determination of Tm and/or ∆∆Gexp, and the folded
structures of the wild types were determined using the X-ray crystallography. The structure models obtained from NMR are excluded for the following reasons. The NMR models are constructed by a structure calculation upon which the structural information experimentally obtained as a set of constraints is imposed.43Typical constraints are the nuclear Overhauser effect (NOE), residual dipolar coupling (RDC), hydrogen bonding, and dihedral angle restraints. Unless the amount of constraints is sufficiently large, the models constructed are substantially influenced by the structure calculation em-ployed. About 20–40 candidate models are usually prepared, but they are often significantly different from one another.43
The prediction of the thermal-stability changes upon mutations is made under the condition that the wild-type structure is given whereas a mutant structure is unknown. Since this is a subtle task, it is required that the wild-type structure be sufficiently certain. We exclude the NMR models to concentrate on the investigation of our thermal-stability measure. It is true, how-ever, that some NMR models give successful results while others do not, but this is beyond the scope of our work. (Of course, when the amount of constraints is large enough, the models from NMR can be better than those from the X-ray
crystallography because the former accounts for the structure fluctuation in aqueous solution.43)
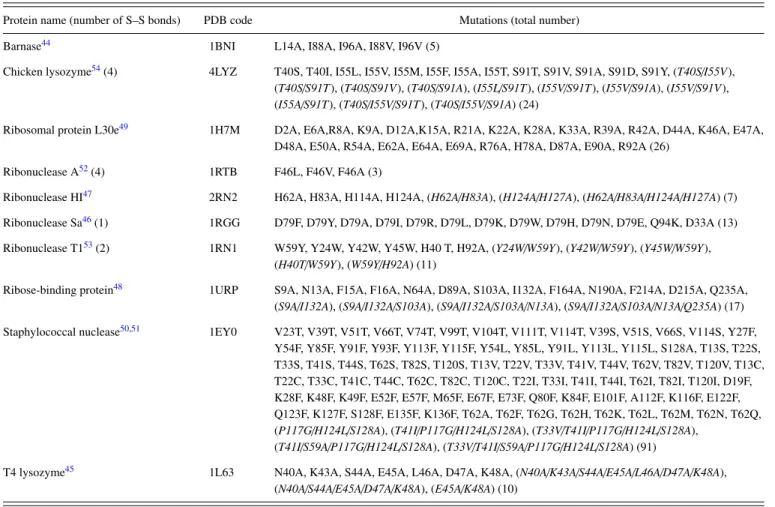
We test 10 proteins44–54 listed in TableI. Four of them possess S–S bonds. The crystallization for the X-ray crystal-lography was made in aqueous solution whose pH was in the range from 6 to 8 with the exception of ribosomal protein L30e,55 ribonuclease (RNase) HI,56 and ribose binding pro-tein:57 Their pH-values were 5.6, 9.0, and 5.0, respectively.
We could not find the pH-values in the crystallization for chicken lysozyme58 and RNase A.59In order to confirm that
the proteins considered are sufficiently diverse, we analyze the amino-acid sequence homology for all of the protein pairs using “CLUSTAL W.” 60 For any two of RNase A, RNase
HI, RNase Sa, and RNase T1, the homology is in the range 3%–9%. For chicken lysozyme and T4 lysozyme, it is 11%. Among the 45 pairs, only 7 of them exhibit the homology exceeding 10%. Thus, the amino-acid sequences of the 10 proteins are quite different. The values ofTmand∆Gexpfor the
wild types of the 10 proteins are collected in TableII.∆Gexp,
the free-energy change upon unfolding at 25 ◦C, was cal-culated using the experimental data (see Secs.IV BandIV C for ∆∆Gexp).
The mutants considered for each protein are also listed in TableI. A total of 207 mutations (176 are single, 18 are double, and 13 are triple and higher-fold) are chosen. It is observed in the table that we consider a variety of mutations including those changing the total charge (e.g., mutating from a nonpolar residue to a charged one): The number of such mutations is 81. The 5 multiple mutations in the case of staphy-lococcal nuclease51include the mutation from proline (Pro) to
glycine (Gly). Chicken lysozyme,54RNase A,52RNase Sa,46 and RNase T153 possess 4, 4, 1, and 2 S–S bonds, respec-tively, but the number of S–S bonds remains unchanged upon any mutation considered. By the mutation Pro → Gly, the unfolded state becomes more extended. The presence of an S–S bond makes the unfolded state less extended. There is a trend that proteins with S–S bonds and mutations including Pro or Gly are avoided due to the resulting lower prediction performance,3,9but we challenge such proteins and mutations.
(Our result is discussed in Sec.IV A.)
F. Preparation of folded state for wild type and mutant Models of the folded structures of the wild types are taken from Protein Data Bank (PDB). After giving hydrogen atoms to the models using the CHARMM61and MMTSB62programs,
we slightly modify the models using the energy minimization described in our earlier publication20 to remove unrealistic
overlaps of protein atoms. The modification is carried out using the CHARMM22 parameters38with the CMAP correction63
and the GBMV implicit solvent model.64,65We put positional
restraints in the harmonic form on all of the heavy atoms during the energy minimization. The force constant for the restraints is 2Mkcal/(mol Å2)whereM is the mass of each atom.
It is required that the thermal-stability change upon muta-tion be predicted without any experimentally determined struc-tural data for the resultant mutant. Starting from the folded structure of the wild type taken from the PDB code as the template, we construct the folded-structure model of a mutant
125102-7 Murakamiet al. J. Chem. Phys.143, 125102 (2015) TABLE I. Proteins and mutations considered. The multiple mutations are italicized.
Protein name (number of S–S bonds) PDB code Mutations (total number) Barnase44 1BNI L14A, I88A, I96A, I88V, I96V (5)
Chicken lysozyme54(4) 4LYZ T40S, T40I, I55L, I55V, I55M, I55F, I55A, I55T, S91T, S91V, S91A, S91D, S91Y, (T40S/I55V),
(T40S/S91T), (T40S/S91V), (T40S/S91A), (I55L/S91T), (I55V/S91T), (I55V/S91A), (I55V/S91V), (I55A/S91T), (T40S/I55V/S91T), (T40S/I55V/S91A) (24)
Ribosomal protein L30e49 1H7M D2A, E6A,R8A, K9A, D12A,K15A, R21A, K22A, K28A, K33A, R39A, R42A, D44A, K46A, E47A,
D48A, E50A, R54A, E62A, E64A, E69A, R76A, H78A, D87A, E90A, R92A (26) Ribonuclease A52(4) 1RTB F46L, F46V, F46A (3)
Ribonuclease HI47 2RN2 H62A, H83A, H114A, H124A, (H62A/H83A), (H124A/H127A), (H62A/H83A/H124A/H127A) (7) Ribonuclease Sa46(1) 1RGG D79F, D79Y, D79A, D79I, D79R, D79L, D79K, D79W, D79H, D79N, D79E, Q94K, D33A (13)
Ribonuclease T153(2) 1RN1 W59Y, Y24W, Y42W, Y45W, H40 T, H92A, (Y24W/W59Y), (Y42W/W59Y), (Y45W/W59Y), (H40T/W59Y), (W59Y/H92A) (11)
Ribose-binding protein48 1URP S9A, N13A, F15A, F16A, N64A, D89A, S103A, I132A, F164A, N190A, F214A, D215A, Q235A,
(S9A/I132A), (S9A/I132A/S103A), (S9A/I132A/S103A/N13A), (S9A/I132A/S103A/N13A/Q235A) (17) Staphylococcal nuclease50,51 1EY0 V23T, V39T, V51T, V66T, V74T, V99T, V104T, V111T, V114T, V39S, V51S, V66S, V114S, Y27F,
Y54F, Y85F, Y91F, Y93F, Y113F, Y115F, Y54L, Y85L, Y91L, Y113L, Y115L, S128A, T13S, T22S, T33S, T41S, T44S, T62S, T82S, T120S, T13V, T22V, T33V, T41V, T44V, T62V, T82V, T120V, T13C, T22C, T33C, T41C, T44C, T62C, T82C, T120C, T22I, T33I, T41I, T44I, T62I, T82I, T120I, D19F, K28F, K48F, K49F, E52F, E57F, M65F, E67F, E73F, Q80F, K84F, E101F, A112F, K116F, E122F, Q123F, K127F, S128F, E135F, K136F, T62A, T62F, T62G, T62H, T62K, T62L, T62M, T62N, T62Q, (P117G/H124L/S128A), (T41I/P117G/H124L/S128A), (T33V/T41I/P117G/H124L/S128A),
(T41I/S59A/P117G/H124L/S128A), (T33V/T41I/S59A/P117G/H124L/S128A) (91)
T4 lysozyme45 1L63 N40A, K43A, S44A, E45A, L46A, D47A, K48A, (N40A/K43A/S44A/E45A/L46A/D47A/K48A),
(N40A/S44A/E45A/D47A/K48A), (E45A/K48A) (10)
using Modeller66(Ver. 9.11). We generate 10 candidate models
on the condition that the modification of the coordinates is limited to the protein atoms within the distance of 2 Å from the center of the mutated residue. The model with the lowest value of our free-energy functionF atT =T0(see Eq.(1)) is
chosen as the best one. Since the 10 models are all compact, the protein conformational entropy need not be taken into consideration. When unrealistic overlaps of protein atoms are observed, they are removed in the manner mentioned above
TABLE II. Values of thermal denaturation temperature,Tm, and free-energy
change uponunfoldingat 25◦C,∆G
exp, for wild types of the 10 proteins listed
in Table I.∆Gexpwas calculated using the experimental data, and ∆Gexp
for staphylococcal nuclease was calculated at 20◦C.∆Gexpis not presented
in the literature for chicken lysozyme, RNase (ribonuclease) HI, RNase Sa, ribose-binding protein, and T4 lysozyme.
Protein name Tm(◦C) ∆Gexp(kcal/mol)
Barnase44 53.9 9.5
Chicken lysozyme54 74.0 . . . Ribosomal protein L30e49 93.8 11.4
Ribonuclease A52 59.7 9.30 Ribonuclease HI47 50.2 . . . Ribonuclease Sa46 47.8 . . . Ribonuclease T153 57.2 7.82 Ribose-binding protein48 57.5 . . . Staphylococcal nuclease50,51 52.7 5.4 T4 lysozyme45 62.2 . . .
with the alteration that the minimization is terminated once the LJ potential energy becomes negative. This alteration is for preserving the original structure as much as possible.
G. Preparation of unfolded state for wild type and mutant
Structural properties of the unfolded state of a protein are not exactly known. A prevailing method for modeling the unfolded state is to generate a sufficiently large set of random coils. In our earlier works,19,20it was shown that the previous
measure of the thermal stability19,20 retains its efficacy even
when a small number of extended structures are employed as the model of the unfolded state.20 Therefore, we adopt
five extended structures. The new measure differs from the previous one in the respect thatΛis taken into account. Since Λis calculated by regarding a fully extended structure as the reference one, the employment of a small number of extended structures is justifiable. All of the S–S bonds are broken in the preparation of the unfolded state. The effect of this treatment is discussed in Sec.IV A. The main-chain dihedral angles(φ,ψ)
of the 5 extended structures are in the range from (−130◦, 130◦) to (−170◦, 170◦) with a step of (−10◦, 10◦) (ω is set
at 180◦).20For Pro, however,
(φ,ψ)is set at (−60◦, 40◦). The
most probable conformer for each side chain is taken from Dunbrack’s Backbone-Dependent Rotamer Library.67,68 The
extended structures are modified using the energy minimi-zation explained above with the alteration that we put the
position restraints only on Cαatoms to allow for more struc-tural flexibility.
H. Performance measures defined for theoretical prediction method
In addition to the correlation coefficient between two quantities of interest (e.g., ∆Σ0 and ∆Tm in our theoretical
approach), a variety of measures are examined in the perfor-mance test. Here, mutations which lead to higher and lower thermal stabilities are referred to as “good mutation” and “bad mutation,” respectively. There are two cases: case (a) where a mutation is actually (i.e., experimentally) a good one and case (b) where a mutation is actually a bad one. In case (a), when it is predicted to be a good one, it is counted as a true positive (TP), and when it is predicted to be a bad one, it is counted as a false negative (FN).69In case (b), when it is predicted to be a bad one, it is counted as a true negative (TN), and when it is predicted to be a good one, it is counted as a false positive (FP).69
The performance measures for a prediction method are then defined as follows:69
Accuracy=MA=(TP+TN)/(TP+FN+TN+FP), (7a)
Recall=MR=TP/(TP+FN), (7b)
Precision=MP=TP/(TP+FP), (7c)
Specificity=MS=TN/(TN+FP), (7d)
Negative predictive value=MN=TN/(TN+FN). (7e)
“Recall” is defined for the actual good mutations. It represents the proportion of those which are successfully predicted to be good mutations. “Precision” is defined for the predicted good mutations. It represents the proportion of those which are actually good mutations. “Specificity,” which is defined for the actual bad mutations, represents the proportion of those which are successfully predicted to be bad mutations. “Nega-tive predic“Nega-tive value” is defined for the predicted bad mutations and it represents the proportion of those which are actually bad mutations. “Accuracy” is defined for all of the mutations and the proportion of the successful predictions. The measures are concerned with whether the thermal stability becomes higher or lower and irrelevant to the degree of the stability change. We remark that MAis most frequently considered.8
IV. RESULTS AND DISCUSSION
A. Relation between∆Σ0and∆Tm
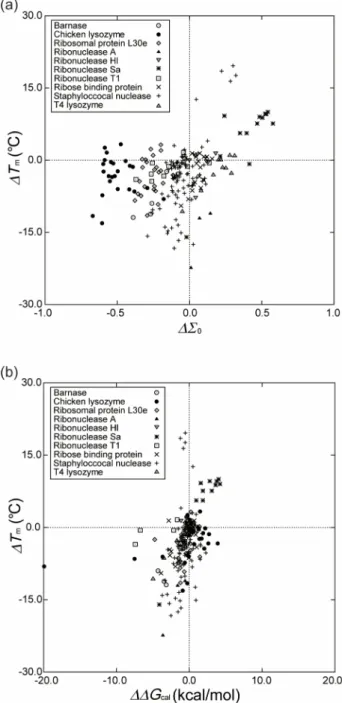
∆Tmis plotted against∆Σ0in Fig.4(a). In a strict sense,
∆Σ0is not linearly correlated to ∆Tm. However, negative∆Σ0
implies negative ∆Tmand positive∆Σ0implies positive ∆Tm,
and larger|∆Σ0|leads to larger|∆Tm|. Hence, the performance
can be evaluated through the plot of ∆Tm against ∆Σ0 and
the measures, in particular, MA. The correlation coefficient
in Fig.4(a) is 0.409 and MAis 73.4%. Even the 5 multiple
mutations including the mutation Pro → Gly in the case of staphylococcal nuclease do not appreciably deviate from the plot. Further, the data points for the proteins possessing S–S bonds do not exhibit apparent deviation, either. When a protein
FIG. 4. (a) Relation between∆Tmand∆Σ0calculated by our approach for
the 207 mutants listed in TableI.Tmis the thermal denaturation temperature, Σ(T)is defined by Eq.(3), andΣ0=Σ(T0)(T0=298 K). The unit ofTmis
◦
C here.∆denotes “the value for a mutant minus that for the wild type”. (b) Relation between∆Tmand∆∆Gcal.∆∆Gis the change in∆Gupon mutation
(∆∆G=∆GM−∆GW; the superscripts, “W” and “M,” denote values of the
wild type and the mutant, respectively),∆G (∆G>0) is the free-energy change uponunfolding, and the subscript “cal” denotes the value calculated by FOLD-X.
possesses more S–S bonds, the unfolded state becomes less extended with the result that |∆SC|decreases for allT. This
effect (effect I) makes the folded state more stable. By contrast, the EV of the unfolded state and the decrease in the EV upon folding become smaller, which is followed by decreased∆SVH
for all T. This effect (effect II) makes the folded state less stable. It is not definite which of the two effects dominates. However, the number of S–S bonds remains unchanged upon any mutation considered, which should be responsible for the exhibition of no apparent deviation.
125102-9 Murakamiet al. J. Chem. Phys.143, 125102 (2015) B. Comparison with FOLD-X in terms of performance
by looking at∆Tm
FOLD-X, which is one of the most popular, successful approaches, can freely be used.2,23,24 We use Version 3 that
is essentially the same as the newest one, Version 4 (Version 4 is just easier to use than Version 3). We then compare our approach and FOLD-X in terms of the performance. It should be noted that all of the previously reported approaches including FOLD-X share roughly the same prediction perfor-mance.5,9 In FOLD-X, the force field employed is different from ours and the folded states of the wild type and a mutant are also differently prepared. We use FOLD-X in its original way without any modification. We plot ∆Tm against ∆∆Gcal
calculated by FOLD-X in Fig.4(b). Here,∆∆Gis the change in ∆Gupon mutation(∆∆G=∆GM−∆GW),∆G(∆G>0) is the free-energy change uponunfoldingat 25◦C, and the subscript
“cal” denotes the calculated value. Positive∆∆Gimplies that the stability is enhanced by the mutation. Since∆∆Gin FOLD-X is defined as “∆GW−∆GM,” the calculated value is
multi-plied by−1. The correlation coefficient in Fig.4(b)is 0.395. In the previous tests, the correlation coefficient for FOLD-X was about 0.5 or better,5 so the protein data set considered
in the present study should be more difficult to theoretically treat. In Table III, we compare FOLD-X with our approach in terms of the five performance measures defined by Eq.(7). All of the measures are considerably higher in ours than in FOLD-X. MA, for instance, is 73.4% in ours and 66.7% in
FOLD-X.
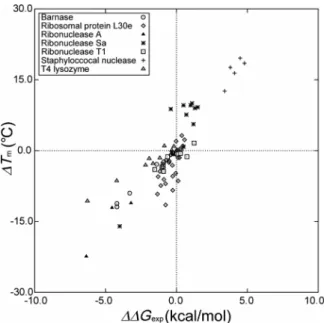
C. Comparison with FOLD-X in terms of performance by looking at∆∆Gexp
It is worthwhile to examine the relation between ∆Tm
and ∆∆Gexp. The subscript “exp” denotes the experimentally
determined value. There is no data of ∆∆Gexp for chicken
lysozyme, RNase HI, ribose binding protein, and single muta-tions of staphylococcal nuclease. There are 73 mutants with the data of ∆∆Gexpavailable. Care must be taken in handling
the data of ∆∆Gexp because ∆G was defined for folding in
some proteins and for unfolding in others. Since the values of ∆∆Gexpwere calculated at 52.6◦C for RNase Sa46and at
62.2◦C for T4 lysozyme45in the references, we recalculated
them at 25◦C using the thermodynamic data given.52For the multiple mutations of staphylococcal nuclease,51the values of
∆∆Gexpwere calculated at 20 ◦C in the reference. However,
the thermodynamic data were not given. We decided to adopt the values at 20◦C because they should be very close to those
at 25◦C. The relation between ∆T
mand∆∆Gexpis plotted in
Fig.5. As expected, they are highly correlated: The correlation coefficient reaches 0.881.
TABLE III. Comparison between our approach and FOLD-X in terms of the performance measures defined by Eq.(7). The data points in Fig.4are considered.
Approach MA MR MP MS MN
Ours 0.734 0.623 0.485 0.773 0.856 FOLD-X 0.667 0.604 0.400 0.688 0.835
FIG. 5. Relation between∆Tmand∆∆Gexpfor the 73 mutants with the data
of∆∆Gexpavailable. See the caption of Fig.4for the notation. The subscript
“exp” denotes an experimental value.
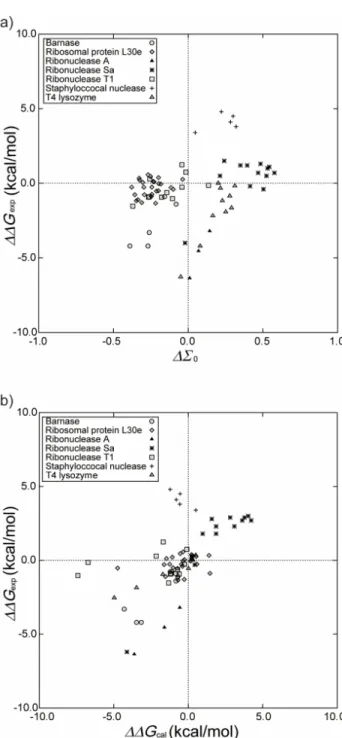
We then employ ∆∆Gexp instead of ∆Tm in the
perfor-mance evaluation. Figure6(a)shows the plot of∆∆Gexpagainst
∆Σ0for our approach and Fig.6(b)shows the plot of∆∆Gexp
against∆∆Gcal2,23,24for FOLD-X. The 73 mutants are
consid-ered (i.e., the other 134 mutants are excluded). The correla-tion coefficients in Figs.6(a)and6(b) are 0.314 and 0.473, respectively. The five performance measures for our approach and FOLD-X are compared in TableIV. Except for MR, the
measures are considerably higher in FOLD-X than in ours.
MA is 64.4% in ours and 71.2% in FOLD-X. Overall, the
performance of FOLD-X is higher than ours. This result is not surprising because the weighting coefficients employed in FOLD-X are determined in advance so that ∆∆Gcal can be
best fitted to∆∆Gexpfor a sufficiently large set of proteins and
mutations. By contrast, our approach includes no such fitting procedure.
To confirm that the higher performance of FOLD-X mentioned above is attributed not to the exclusion of the 134 mutants but to the replacement of ∆Tm by ∆∆Gexp, we plot
∆Tm against ∆Σ0 for ours and against ∆∆Gcal for FOLD-X
only for the 73 mutants. The results are shown in Figs.7(a) and 7(b) where the correlation coefficients are 0.583 and 0.540, respectively. FOLD-X exhibits lower performance with respect to the correlation coefficient. The five performance measures for ours and FOLD-X are compared in TableV:MR
andMNare higher in ours than in FOLD-X, but the opposite
is true for the other three measures (MA is 75.3% in ours
and 79.5% in FOLD-X). However, the differences are not large.
In summary, our approach and FOLD-X are better suited to ∆Tm and∆∆Gexp, respectively, in the exhibition of higher
performance. The reason why ours is better suited to ∆Tm
may be the following.∆Tmcan directly be measured, whereas
∆∆Gexp at 25 ◦C is evaluated using the enthalpy and
heat-capacity changes upon unfoldingat the denaturation temper-ature and the assumption that the heat-capacity change is
FIG. 6. (a) Relation between∆∆Gexpand∆Σ0calculated by our approach
for the 73 mutants with the data of∆∆Gexpavailable. (b) Relation between ∆∆Gexpand∆∆Gcal. The subscript “cal” denotes the value calculated by
FOLD-X. See the captions of Figs.4and5for the notation.
independent ofT. Actually, the assumption is not quite correct because the heat-capacity change increases progressively as
T becomes lower. (See our earlier publication11for a detailed
discussion.) ∆Tmmay be more reliable than∆∆Gexp.
TABLE IV. Comparison between our approach and FOLD-X in terms of the performance measures defined by Eq.(7). The data points in Fig.6are considered.
Approach MA MR MP MS MN
Ours 0.644 0.571 0.533 0.689 0.721 FOLD-X 0.712 0.571 0.640 0.800 0.750
FIG. 7. (a) Relation between∆Tmand∆Σ0calculated by our approach for
the 73 mutants considered in Fig.6. (b) Relation between∆Tmand∆∆Gcal.
The subscript “cal” denotes the value calculated by FOLD-X. See the caption of Fig.4for the notation.
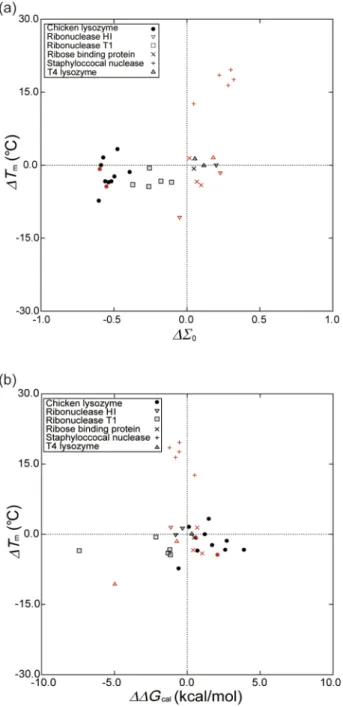
D. Comparison with FOLD-X in terms of performance for multiple mutations
Taking only the 31 multiple mutations, we plot ∆Tm
against∆Σ0for our approach and against∆∆Gcalfor FOLD-X
TABLE V. Comparison between our approach and FOLD-X in terms of the performance measures defined by Eq.(7). The data points in Fig.7are considered.
Approach MA MR MP MS MN
Ours 0.753 0.714 0.667 0.778 0.814 FOLD-X 0.795 0.679 0.760 0.867 0.813
125102-11 Murakamiet al. J. Chem. Phys.143, 125102 (2015)
FIG. 8. (a) Relation between∆Tmand∆Σ0calculated by our approach for
the 31 multiple mutants in TableI. (b) Relation between∆Tmand∆∆Gcal.
The subscript “cal” denotes the value calculated by FOLD-X. The keys for the triple and higher-fold mutations are drawn in red. See the caption of Fig.4 for the notation.
in Figs.8(a)and8(b), respectively. The correlation coefficient in Fig.8(a)is 0.549 whereas that in Fig.8(b)is only 0.024. The correlation coefficient in FOLD-X for the 18 double mutations is 0.177 whereas that for the triple and higher-fold mutations is
negative. There is a strong trend in FOLD-X that the prediction performance becomes progressively worse as the time of the mutations increases. In TableVI, we compare FOLD-X with our approach in terms of the five performance measures. All of the measures in ours are much higher than those in FOLD-X.
MAis 74.2% in ours and 48.4% in FOLD-X.
There are two possible reasons for the ill success of FOLD-X for multiple mutations. The first reason is that adjust-ment of the terms in its free-energy function and determination
TABLE VI. Comparison between our approach and FOLD-X in terms of the performance measures defined by Eq.(7). The data points in Fig.8are considered.
Approach MA MR MP MS MN
Ours 0.742 0.750 0.643 0.737 0.824 FOLD-X 0.484 0.500 0.375 0.474 0.600
of the weighting coefficient in the van der Waals term are performed only for single mutations.2,23,24The second one is
much more important. As observed in Fig.8,Tmof
staphylo-coccal nuclease is made higher by 12.6–19.6◦C due to the 5
multiple mutations.51FOLD-X fails to reproduce these highly
enhanced stabilities. By contrast, our approach is successful in reproducing them. We find the following: As shown in Fig.9, this success is thanks to the entropic component of∆Σ0,
∆SVH/(kBNr), and the energetic component, −∆Λ/(kBT0Nr),
works to lower the stabilities. Thus, the highly enhanced stabilities are brought by the entropic EV effect.
The free-energy function of FOLD-X is parameterized using only the experimental data for single mutations. If it were re-parameterized using the experimental data including those for multiple mutations, the result from FOLD-X would certainly be improved. It should be emphasized, however, that the entropic EV effect is not incorporated in the free-energy function of FOLD-X. Without incorporating this crucial effect, even if the result is improved by the re-parameterization, the improvement is not physically sound.
E. Cases where structural data for folded states of mutants are experimentally available
The performance of our approach will become higher if the preparation method for the folded state of a mutant is improved. As an illustration, we limit the prediction to the mu-tants whose structural data for folded states are experimentally available (a total of 22 mutants). The experimental data are used for these mutants. The method of preparing the folded structure for each mutant is the same as that for the wild type
FIG. 9. Relation between ∆Tmand ∆Σ0 calculated by our approach for
the 5 multiple mutations of staphylococcal nuclease. Red: Only the entropic component of∆Σ0is considered;∆Σ0=∆SVH/(kBNr). Blue: Only the
ener-getic component of∆Σ0is considered;∆Σ0=−∆Λ/(kBT0Nr). Green: Both
of the entropic and energetic components of∆Σ0 are considered; ∆Σ0= ∆SVH/(kBNr)−∆Λ/(kBT0Nr). This figure should be compared with the data
described in Sec.III F. We find that the correlation coefficient between∆Tmand∆Σ0reaches 0.678.
There are two different data for chicken lysozyme: The PDB codes are 4LYZ54 and 1HEL.70 The two data give the results which are different in a quantitative sense. In all of the sections described above, we adopt 4LYZ leading to better performance-test results for both of our approach and FOLD-X. When the structural data experimentally determined are used for the mutants, however, 1HEL is adopted because the result for chicken lysozyme is quantitatively better for 1HEL.
V. CONCLUDING REMARKS
We have examined a new measure of the thermal stability of a protein by applying it to the prediction of the thermal-stability changes upon mutations. In the measure, the entropic EV effect10–16is incorporated to its full extent using a molec-ular model for water. A unique approach has thus been obtained for the prediction using the measure. The performance of our approach would become much higher by the introduction of fitting parameters (e.g., by optimizing two weighting coeffi -cients multiplied toT∆SVHand to∆Λin Eq.(3), respectively,
by adjusting 7kBT0or−14kBT0in Fig.3), in which case,
how-ever, the thermal-stability measure or the free-energy function becomes somewhat physically ambiguous. Hence, the use of those parameters is avoided.
We have compared our approach with FOLD-X2,23,24in
terms of the prediction performance for 10 proteins and a total of 207 mutations including 31 multiple mutations. Further, 4 of the 10 proteins possess S–S bonds and the 5 multiple mutations for staphylococcal nuclease51include Pro→ Gly, which presents much challenge. FOLD-X is one of the most popular, successful approaches. Our approach and FOLD-X exhibit almost the same performance on the whole, despite that ours employ no fitting parameters unlike FOLD-X. The factors taken into account in our thermal-stability measure are the water-entropy gain, loss of the protein conformational entropy, break of protein-water HBs, and formation of pro-tein intramolecular HBs upon folding (i.e., the propro-tein ther-mal stability is described by the competition of Σ(T) and
T|∆SC|/(kBT0Nr)as illustrated in Fig.2). In our approach, when
the structures of folded states of the mutants are experimen-tally available and they are utilized, the correlation coefficient between ∆Tm and ∆Σ0 reaches 0.678. These successful
re-sults indicate that the three physicochemical factors govern the thermal-stability changes upon mutations.
For multiple mutants, ours is far superior to FOLD-X. This superiority is important, because most of the mutations realizing remarkable enhancement of the stability are mul-tiple mutations. For example,Tmof staphylococcal nuclease
could be made higher by 12.6–19.6◦C only by multiple
muta-tions.51 Moreover, even when two single mutations, (a) and
(b), lead to higher thermal stability, the double mutation of (a) plus (b) does not necessarily result in further higher stability. It is thus crucial to successfully predict the stability change brought by a multiple mutation. We have argued that the highly enhanced stabilities for five multiple mutations of staphylo-coccal nuclease are realized by the entropic EV effect and that
a principal reason for the ill success of FOLD-X is the neglect of this effect. We believe that the entropic EV effect, which is quite sensitive to the protein structural changes, generally plays a pivotal role in achieving high enhancement of the stability by means of mutation. It is worthwhile to incorporate this effect in the free-energy function of FOLD-X and re-parameterize it using the experimental data including those for multiple mutations.
Khechinashviliet al.71–73made thermodynamic analyses
on thermal denaturation of mesophilic and thermophilic pro-teins and draw the following conclusions: The thermal stability is not correlated with the protein intramolecular energy and it has entropic nature, and the conformational-entropy gain upon denaturation becomes more substantial as the temperature in-creases, which plays a pivotal role in the inducement of thermal denaturation. The first conclusion is consistent with our claim that the water-entropy effect is a crucially important factor in the thermal stability, and the second conclusion is in line with our physical picture of thermal denaturation illustrated in Fig.2.
In the present article, we are interested in not only the physicochemical aspects of the thermal-stability changes upon mutations but also the prediction performance. A future study pursuing higher performance is of value: It can be obtained by improving the energetic and entropic components of the free-energy function. In particular, the protonation states of some residues might be changeable during the folding or unfolding process, and this effect should be examined. Our method of preparing the folded structure of a mutant seems to be cruder than that employed in FOLD-X. In fact, when the experi-mentally determined mutant structures are used (when they are available), the performance of our method is considerably improved as explained in Sec. IV E. The simplified model of the unfolded state (i.e., a set of five extended structures described in Sec.III H) is also to be reconsidered.
ACKNOWLEDGMENTS
The computer program for the MA was developed with R. Roth and Y. Harano. This work was supported by JSPS (Japan Society for the Promotion of Science) Grant-in-Aid for Scientific Research (B) (No. 25291035: M. Kinoshita) and by Grant-in-Aid for JSPS fellows (H. Oshima).
1A. Mozo-Villiarías and E. Querol,Curr. Bioinf.1, 25 (2006).
2R. Guerois, J. E. Nielsen, and L. Serrano,J. Mol. Biol.320, 369 (2002). 3N. Pokala and T. M. Handel,J. Mol. Biol.347, 203 (2005).
4S. Yin, F. Ding, and N. V. Dokholyan,Nat. Methods4, 466 (2007). 5V. Potapov, M. Cohen, and G. Schreiber,Protein Eng., Des. Sel.22, 553
(2009).
6A. Benedix, C. M. Becker, B. L. de Groot, A. Caflisch, and R. A. Böckmann,
Nat. Methods6, 3 (2009).
7Z. Zhang, L. Wang, Y. Gao, J. Zhang, M. Zhenirovskyy, and E. Alexov,
Bioinformatics28, 664 (2012).
8L. Wickstrom, E. Gallicchio, and R. M. Levy,Proteins80, 111 (2012). 9A. N. Naganathan,J. Phys. Chem. B117, 4956 (2013).
10M. Kinoshita,Front. Biosci.14, 3419 (2009). 11M. Kinoshita,Int. J. Mol. Sci.10, 1064 (2009). 12M. Kinoshita,Biophys. Rev.5, 283 (2013).
13T. Yoshidome, M. Kinoshita, S. Hirota, N. Baden, and M. Terazima,J. Chem.
Phys.128, 225104 (2008).
14T. Yoshidome and M. Kinoshita, Phys. Chem. Chem. Phys.14, 14554
125102-13 Murakamiet al. J. Chem. Phys.143, 125102 (2015)
15Y. Harano, T. Yoshidome, and M. Kinoshita,J. Chem. Phys.129, 145103
(2008).
16H. Oshima and M. Kinoshita,J. Chem. Phys.138, 245101 (2013). 17S.-H. Chong and S. Ham,Chem. Phys. Lett.535, 152 (2012). 18G. Graziano,Phys. Chem. Chem. Phys.16, 21755 (2014).
19K. Amano, T. Yoshidome, Y. Harano, K. Oda, and M. Kinoshita,Chem.
Phys. Lett.474, 190 (2009).
20K. Oda, R. Kodama, T. Yoshidome, M. Yamanaka, Y. Sambongi, and M.
Kinoshita,J. Chem. Phys.134, 025101 (2011).
21T. Yoshidome, K. Oda, Y. Harano, R. Roth, Y. Sugita, M. Ikeguchi, and M.
Kinoshita,Proteins77, 950 (2009).
22S. Yasuda, T. Yoshidome, Y. Harano, R. Roth, H. Oshima, K. Oda, Y. Sugita,
M. Ikeguchi, and M. Kinoshita,Proteins79, 2161 (2011).
23J. Schymkowitz, J. Borg, F. Stricher, R. Nys, F. Rousseau, and L. Serrano,
Nucleic Acids Res.33, 382 (2005).
24J. W. H. Schymkowitz, F. Rousseau, I. C. Martins, J. Ferkinghoff-Borg, F.
Stricher, and L. Serrano,Proc. Natl. Acad. Sci. U. S. A.102, 10147 (2005).
25S. Yasuda, H. Oshima, and M. Kinoshita,J. Chem. Phys.137, 135103
(2012).
26B. Honig and A. Nicholls,Science268, 1144 (1995).
27N. Baden, S. Hirota, T. Takabe, N. Funasaki, and M. Terazima,J. Chem.
Phys.127, 175103 (2007).
28N. M. Cann and G. N. Patey,J. Chem. Phys.106, 8165 (1997). 29M. Kinoshita,J. Chem. Phys.128, 024507 (2008).
30J. Fitter,Biophys. J.84, 3924 (2003).
31P. G. Kusalik and G. N. Patey,J. Chem. Phys.88, 7715 (1988). 32P. G. Kusalik and G. N. Patey,Mol. Phys.65, 1105 (1988).
33T. Imai, Y. Harano, M. Kinoshita, A. Kovalenko, and F. Hirata,J. Chem.
Phys.125, 024911 (2006).
34M. Kinoshita and D. R. Bérard,J. Comput. Phys.124, 230 (1996). 35R. Roth, Y. Harano, and M. Kinoshita,Phys. Rev. Lett.97, 078101 (2006). 36M. L. Connolly,J. Appl. Crystallogr.16, 548 (1983).
37M. L. Connolly,J. Am. Chem. Soc.107, 1118 (1985).
38A. D. MacKerell, Jr., D. Bashford, M. Bellott, R. L. Dunbrack, Jr.,
J. D. Evanseck, M. J. Field, S. Fischer, J. Gao, H. Guo, S. Ha, D. Joseph-McCarthy, L. Kuchnir, K. Kuczera, F. T. K. Lau, C. Mattos, S. Michnick, T. Ngo, D. T. Nguyen, B. Prodhom, W. E. Reiher III, B. Roux, M. Schlenkrich, J. C. Smith, R. Stote, J. Straub, M. Watanabe, J. Wiórkiewicz-Kuczera, D. Yin, and M. Karplus,J. Phys. Chem. B102, 3586 (1998).
39T. Hayashi, H. Oshima, T. Mashima, T. Nagata, M. Katahira, and M.
Kinoshita,Nucleic Acids Res.42, 6861 (2014).
40H. Oshima and M. Kinoshita,J. Chem. Phys.142, 145103 (2015). 41S. F. Sneddon, D. J. Tobias, and C. L. Brooks III,J. Mol. Biol.209, 817
(1989).
42I. K. McDonald and J. M. Thornton,J. Mol. Biol.238, 777 (1994). 43H. Mishima, S. Yasuda, T. Yoshidome, H. Oshima, Y. Harano, M. Ikeguchi,
and M. Kinoshita,J. Phys. Chem. B116, 7776 (2012).
44J. T. Kellis, Jr., K. Nyberg, and A. R. Fersht,Biochemistry28, 4914 (1989).
45D. W. Heinz, W. A. Baase, and B. W. Matthews,Proc. Natl. Acad. Sci.
U. S. A.89, 3751 (1992).
46S. R. Trevino, K. Gokulan, S. Newsom, R. L. Thurlkill, K. L. Shaw, V. A.
Mitkevich, A. A. Makarov, J. C. Sacchettini, J. M. Scholtz, and C. N. Pace, J. Mol. Biol.354, 967 (2005).
47S. Kanaya, M. Oobatake, H. Nakamura, and M. Ikehara,J. Biotechnol.28,
117 (1993).
48N. C. Vercillo, K. J. Herald, J. M. Fox, B. S. Der, and J. D. Dattelbaum,
Protein Sci.16, 362 (2007).
49C.-F. Lee, G. I. Makhatadze, and K.-B. Wong,Biochemistry 44, 16817
(2005).
50M. P. Byrne and W. E. Stites,Biophys. Chem.125, 490 (2007). 51J. Chen, Z. Lu, J. Sakon, and W. E. Stites,J. Mol. Biol.303, 125 (2000). 52T. Kadonosono, E. Chatani, R. Hayashi, H. Moriyama, and T. Ueki,
Biochemistry42, 10651 (2003).
53W.-D. Schubert, G. Schluckebier, J. Backmann, J. Granzin, C. Kisker, H.-W.
Choe, U. Hahn, W. Pfeil, and W. Saenger,Eur. J. Biochem.220, 527 (1994).
54P. Shih, D. R. Holland, and J. F. Kirsch,Protein Sci.4, 2050 (1995). 55Y. W. Chen, M. Bycroft, and K.-B. Wong,Biochemistry42, 2857 (2003). 56S. Kanaya, A. Kohara, M. Miyagawa, T. Matsuzaki, K. Morikawa, and M.
Ikehara, J. Biol. Chem.264, 11546 (1989).
57A. J. Björkman and S. L. Mowbray,J. Mol. Biol.279, 651 (1998). 58R. Diamond,J. Mol. Biol.82, 371 (1974).
59D. L. Birdsall and A. McPherson, J. Biol. Chem.267, 22230 (1992). 60J. D. Thompson, D. G. Higgins, and T. J. Gibson,Nucleic Acids Res.22,
4673 (1994).
61B. R. Brooks, R. E. Bruccoleri, B. D. Olafson, D. J. States, S. Swaminathan,
and M. Karplus,J. Comput. Chem.4, 187 (1983).
62M. Feig, J. Karanicolas, and C. L. Brooks III,J. Mol. Graphics Modell.22,
377 (2004).
63A. D. Mackerell, Jr., M. Feig, and C. L. Brooks III,J. Comput. Chem.25,
1400 (2004).
64M. S. Lee, M. Feig, F. R. Salsbury, Jr., and C. L. Brooks III,J. Comput. Chem. 24, 1348 (2003).
65J. Chocholoušová and M. Feig,J. Comput. Chem.27, 719 (2006). 66A. Šali and T. L. Blundell,J. Mol. Biol.234, 779 (1993). 67R. L. Dunbrack, Jr. and F. E. Cohen,Protein Sci.6, 1661 (1997). 68R. L. Dunbrack, Jr.,Curr. Opin. Struct. Biol.12, 431 (2002).
69H. Oshima, S. Yasuda, T. Yoshidome, M. Ikeguchi, and M. Kinoshita,Phys.
Chem. Chem. Phys.13, 16236 (2011).
70K. P. Wilson, B. A. Malcolm, and B. W. Matthews, J. Biol. Chem.267, 10842
(1992).
71N. N. Khechinashvili, M. V. Fedorov, A. V. Kabanov, S. Monti, C. Ghio, and
K. Soda,J. Biomol. Struct. Dyn.24, 255 (2006).
72N. N. Khechinashvili, S. A. Volchkov, A. V. Kabanov, and G. Barone,
Biochim. Biophys. Acta1784, 1830 (2008).
73N. N. Khechinashvili, A. V. Kabanov, M. S. Kondratyev, and R. V. Polozov,