THESIS FOR THE DEGREE OF LICENTIATE OF ENGINEERING MACHINE AND VEHICLE SYSTEMS GRADUATE SCHOOL
Driver interaction with vulnerable road users:
Understanding and modelling driver behaviour for the
design and evaluation of intelligent safety systems
CHRISTIAN-NILS BODA
Department of Mechanics and Maritime Sciences CHALMERS UNIVERSITY OF TECHNOLOGY
Driver interaction with vulnerable road users: Understanding and
modelling driver behaviour for the design and evaluation of
intelligent safety systems
CHRISTIAN-NILS BODA
© CHRISTIAN-NILS BODA, 2017
THESIS FOR LICENTIATE OF ENGINEERING no 2017:06 Department of Mechanics and Maritime Sciences
Vehicle Safety Division
Chalmers University of Technology SE-412 96 Gothenburg, Sweden Telephone + 46 (0)31-772 1000
Chalmers Reproservice Gothenburg, Sweden 2017
Driver interaction with vulnerable road users:
Understanding and modelling driver behaviour for the design and evaluation of intelligent safety systems
CHRISTIAN-NILS BODA
Department of Mechanics and Maritime Sciences Vehicle Safety Division
Chalmers University of Technology
Abstract
Every year, more than 5000 pedestrians and 2000 cyclists die on European roads. These vulnerable road users (VRU) are at especially high risk when interacting with motorised vehicles. Safety systems designed to mitigate or avoid crashes with VRU started to enter the market a few years ago and still need to be improved to be effective in all scenarios. Understanding how drivers interact with VRU is crucial to improve the development and the evaluation of safety systems. Today, however, there is a lack of knowledge about driver behaviour in interactions with VRU, which keeps active safety measures from expressing their full potential. This thesis has multiple objectives: 1) to provide new knowledge about driver behaviour in crossing interactions with VRU, 2) to present this knowledge to assessment programs such as Euro NCAP with the goal of improving their system-evaluation scenarios, and 3) to include this knowledge in a counterfactual analysis framework for safety-benefit evaluation. Results showed that the moment in which a VRU becomes visible to the driver had the largest influence on the driver braking response process in driver-VRU interactions. This thesis contributes to experimental methodologies by comparing the steps of the response process in test-track and in driving-simulator studies. Additionally, the thesis describes a driver braking response model and uses the information gained from it to suggest improvements in the design and evaluation of safety systems. Finally, a framework for counterfactual simulations was developed which is suitable for evaluating safety benefits and refining intelligent safety systems (such as autonomous emergency braking and frontal collision warning). This thesis addressed some of the research gaps in the understanding of driver behaviour that have hindered the improvement of driver models and their application to the design and evaluation of safety systems.
Keywords: Active safety, counterfactual analysis, pedestrian, bicyclist, driver behaviour, driver model, Euro NCAP
Funding acknowledgment
This work was conducted at SAFER within the DIV project that is sponsored by Toyota Motor Europe and Autoliv Research. The earlier stage of this work was funded by Vinnova (EFrame project) and National Academy of Sciences (S08 — S2-S08A-RW-1).
Acknowledgments
I would like to thank all my colleagues at the Accident Prevention group for the fruitful discussions since I started to work at Chalmers. Marco, thank you for your patience and for making my life as a Ph.D. candidate as smooth and entertaining as possible. Thank you, Jonas, for having offered me the opportunity to join the research group back in 2013 and for having motivated me to stay; you changed my life. Thank you, Giulio, Daniel, and Alberto for being supportive and for our discussions. Thank you Jordanka for the lemon curd ice cream which gave me the motivation to finish this thesis. It is fantastic to have colleagues that I can consider friends!
Tack så mycket, min älskade Maria, för din kärlek och ditt stöd utan förbehåll. Jag älskar dig!
Merci, Aurélia et Jean-Adrien, de m’avoir encouragé et soutenu, et d’être toujours présents lorsque j’en ai besoin. Finalement, je voudrais remercier mes chers parents, Joëlle et Christian, et ma chère sœur, Rosalie, pour le soutien que vous m’avez apporté pendant toutes les années de ma vie. Je suis fier de compter parmi votre famille. Je vous aime !
Table of Contents
Abstract ... III Acknowledgments ... VII Table of Contents ... IX
1 Background ... 1
2 Modelling driver behaviour ... 3
3 Modelling driver behaviour: the bicyclist- and pedestrian-driver interaction case ... 5
3.1 Factors investigated in the literature review ... 5
3.2 Driver behaviour models in driver-pedestrian interactions ... 8
3.3 Driver behaviour models in driver-cyclist interactions ... 9
4 Studying driver behaviour ... 11
4.1 Real-world studies ... 11
4.2 Test tracks ... 11
4.3 Driving simulators ... 12
4.4 A qualitative comparison of test environments ... 13
5 Evaluating intelligent safety systems ... 15
5.1 System performance ... 15
5.2 System safety benefits ... 15
5.3 Methodologies for evaluating intelligent safety system performance and safety benefits ... 15
6 Objectives ... 19
7 Summary of papers ... 21
Paper I — How do Drivers Negotiate Intersections with Pedestrians? Fractional Factorial Design in an Open-source Driving Simulator ... 23
Paper II — Modelling how drivers respond to bicyclists crossing their path at intersections: How do test-track and driving simulator experiments compare? ... 25
X
Paper III — Counterfactual simulations applied to SHRP2 crashes: The effect of driver behaviour models on safety benefit estimations of
intelligent safety systems... 27
8 Discussion ... 29
8.1 Driver response process in interaction with VRUs ... 29
8.2 Test environments ... 29
8.3 Safety system design ... 30
8.4 Safety system evaluations ... 31
9 Conclusions ... 33
9.1 Driver response process in interaction with VRU ... 33
9.2 Simulators and test-tracks in the era of naturalistic driving studies 33 9.3 Safety systems design ... 33
9.4 Recommendations for Euro NCAP ... 34
9.5 Evaluation of safety system performances with counterfactual simulations ... 34
10 Future work ... 35
1
Background
Pedestrians and cyclists account for a large number of fatalities on the world’s roads. In the European Union, 5000 pedestrians and 2000 cyclists, at least, die every year (Strandroth et al., 2014). This accounts for 27% of all road fatalities. In the United States of America, pedestrians killed by motor vehicles represent the third-highest number of deaths on the road, and the number has increased over the past five years. In 2015, pedestrians accounted for 14.5% of road fatalities and cyclists accounted for 2.2% (Washington DC, 2016). These two categories of road users are categorized as vulnerable road users (VRUs); a European directive defined VRUs as “non-motorised road users, such as pedestrians and cyclists as well as motor-cyclists and persons with disabilities or reduced mobility and orientation” (European Parliament, 2010).
Although the general trend is towards a decrease in road fatalities, VRU casualties hardly follow this trend (European Commission, 2016). Safety systems to address this problem were introduced into the market. Passive safety systems, such as soft car parts (bumper, hood, etc.) or, more recently, pedestrian airbag systems, are effective ways to reduce the number of fatalities or injuries when a crash is unavoidable. Intelligent safety systems (ISS), which include advanced driver-assistance systems and different forms of automated driving systems, strive to avoid crashes by warning drivers or controlling the car (for example, Volvo’s Pedestrian and Cyclist1 Detection
with Full Auto Brake system (Lindman et al., 2010), Toyota’s Pre-Collision System with Pedestrian Detection function (Hayashi et al., 2013; Tsuchida, Tokoro, Fujinami, & Usami, 2007).
The evaluation of ISS performance is essential for further systems development. This evaluation aims at quantifying the performance of the systems to learn how efficient the system is and in which conditions it performs suboptimally (Euro NCAP, 2015, 2017b; Fildes et al., 2015; Hulshof, Knight, Edwards, Avery, & Grover, 2013). Systems evolution constantly strives to address more driving conditions more effectively. Historically, drivers were the ones controlling their cars, but with the
1
http://support.volvocars.com/en-CA/cars/Pages/owners-manual.aspx?mc=V423&my=2016&sw=15w17&article=3bf022eeedf3242bc0a801 e80043a9f6
2
introduction of ISS the controls started to be shared between drivers and ISS. The interaction between them is crucial; ISS must take drivers’ behaviour into consideration to maximize its performance without annoying drivers (Lubbe & Davidsson, 2015). However, most of the existing evaluation frameworks do not take driver behaviour into account—not because it was believed there was no need for doing so, but because understanding driver behaviour is arduous and few models exist for predicting driver behaviour. Before driver behaviour can be modelled, studies have to be undertaken to provide reliable knowledge on driver behaviour. Many methodologies exist for studying how drivers behave; the choice depends on the objectives of the study. As a consequence of this choice, the results have to be carefully interpreted to avoid overgeneralizing to unrealistic conclusions.
This thesis presents the work which was conducted to improve knowledge about driver behaviour in interaction with VRU, in order to devise models that can be used for ISS evaluation and for informing assessment programmes such as Euro NCAP.
The first section of the thesis (Chapters 2-5) introduces the field of driver modelling in driver-VRU interactions and ISS evaluation. Knowledge and research gaps are identified.
The second section (Chapter 6) presents the objectives of the licentiate and the Ph.D. project, which guide the undertaken work in its goal to fill the gaps identified in the first section.
The third section (Chapters 7-10) presents three papers, explains how they fill some of the gaps, and concludes by describing future Ph.D. work which intends to address the remaining gaps.
2
Modelling driver behaviour
Thoroughly modelling driver behaviour is, if not impossible, certainly arduous. A quote from Cacciabue and colleagues in 2010 is still valid today: “… the critical bottleneck, evident for many years, remains the modelling and consideration of human mental processes and behaviour in interaction with the machine or the system supposed to support and improve performance and safety.” (Cacciabue, Carsten, & Tango, 2010). While several frameworks attempt to describe and explain most of the driving process (Engström et al., 2017; Fuller, 1984; Ljung Aust & Engström, 2010; Summala, 1988, 2007; Wilde, 1982), none of them are fully implemented. Even if they were, they would still require proper knowledge to be fine-tuned enough to correctly predict driver behaviour in a given context.
There are three types of driver models: conceptual, statistical, and process (Markkula, 2015). Conceptual models qualitatively describe how drivers interact with their vehicle and the environment (the models developed by Ljung Aust and Engström (2010) and Summala (1988) belong to this type). The other two types quantitatively describe drivers’ behaviour. Statistical models describe some aspects of driver behaviour with the means of distributions. They are open-loop (this type of model is used in (Kusano & Gabler, 2012) for instance). Process models, like statistical models, are mathematical, but they close the control loop and use past and current data to produce an output, such as braking or steering (an example of this type of model can be found in (Markkula, 2014). Some components of process models can be modelled by statistical models (Markkula, 2015, Bärgman, 2017 #228).
Additionally, Michon proposed a hierarchical structure that organises drivers’ tasks into three levels (Michon, 1985): 1) a strategic level where planning of the trip is undertaken, 2) a tactical level where the manoeuvre (depending on the current driving situation) is decided, and 3) an operational level where drivers actually control (operate) the vehicle. This classification is extensively used in the traffic safety field. It has the advantage of providing a clear and complete view of what a thorough driver model should contain. In the broad field of driver behaviour modelling, this thesis focuses only on process models that predict and quantify drivers’ tasks at the operational level
4
because conceptual models, as well as the strategic level of drivers’ tasks, are not implemented in ISS evaluation simulations.
3
Modelling driver behaviour: the bicyclist- and
pedestrian-driver interaction case
Interest in the driver-VRU interaction is not new; already in the mid-20th
century, studies were undertaken in order to reduce pedestrian casualties on the road. For instance, Barrett, Kobayashi, and Fox (1968) demonstrated that automobile simulators (already in the pre-digital era) may be useful for pedestrian-driver interaction studies. In a site-based observation study, Katz, Zaidel, and Elgrishi (1975) studied which factors influence drivers’ decision to yield at pedestrian crossings. In the case of cyclist-driver interactions, Kroll and Ramey (1977) investigated the influence of bike lanes on driver behaviour when overtaking a cyclist while McHenry and Wallace (1985) looked at the effect of curb lanes’ width on the same interaction. Research into the safety aspects of driver-VRU interactions has continued since then, with more studies undertaken to better understand the relevant driver behaviour. The main objective of this research is to identify the factors influencing driver behaviour and their roles in making the driver-VRU interaction unsafe.
3.1
Factors investigated in the literature review
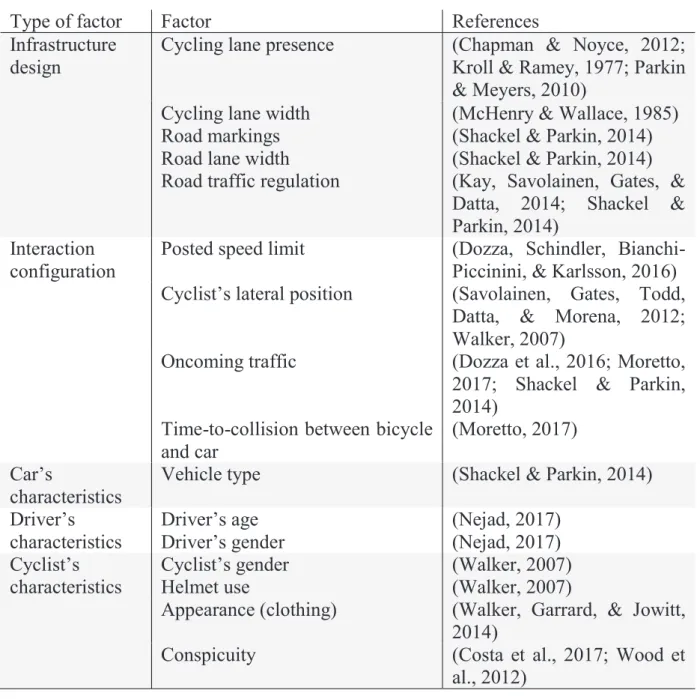
Because the research on interactions between drivers and VRU started long ago and the interest grew through the years, there is a significant amount of literature studying the influence of various factors on driver behaviour. An excerpt of these studies can be found in Tables 1-3. The investigated factors can be grouped by type: 1) infrastructure design (lane dimensions, posted signs, lighting, etc.); 2) interaction configuration; 3) vehicle characteristics; 4) driver characteristics; and 5) VRU characteristics. Only the studies which quantify the factors’ effect on driver behaviour are presented here. The driver-VRU interactions can also be grouped by type: crossing and overtaking. Table 1 lists the studies which investigated crossing interactions with pedestrians, Table 2 lists those which investigated overtaking interaction studies with cyclists, and Table 3 lists those which investigated crossing interactions with cyclists.
While the list of studies reported in the below tables is not exhaustive, it gives a good overview of the knowledge currently available. An important factor with a significant effect on driver behaviour is how easily detectable the VRU is, or VRU conspicuity (Balk, Tyrrell, Brooks, & Carpenter, 2008; Costa et
6
al., 2017; Langham & Moberly, 2003; Wood et al., 2012). However, this factor has to be considered together with other related factors, such as the type of vehicle headlamp (in night scenarios) or visibility. Visibility is defined as the point in time when the VRU can be observed by the driver; the later the VRU is observable, the lower the visibility. For example, the type of vehicle headlamp will have an effect on the conspicuity of the VRU and the conspicuity will then have an effect on the visibility. In fact, the moment when the driver can observe the VRU (e.g. visibility) was shown to have a significant influence on the driver response process in driver-pedestrian crossing interaction (Iwaki et al., 2015). However, in the driver-cyclist crossing interaction, the influence of visibility was not investigated.
Table 1 — List of factors investigated in driver-pedestrian crossing interactions by study
Type of factor Factor References
Infrastructure
design Crossing marking presence Safety countermeasures (Katz et al., 1975) (Bella & Silvestri, 2015, 2016)
Interaction
configuration Oncoming traffic (Sun, Ukkusuri, Benekohal, & Waller, 2002) Crossing angle (Iasmin, Kojima, & Kubota,
2015)
Number of pedestrians (Katz et al., 1975; Sun et al., 2002)
Car’s speed (Katz et al., 1975; Lubbe & Rosén, 2014)
Pedestrian’s speed (Lubbe & Davidsson, 2015)
Gap timing (Várhelyi, 1998)
Visibility of the pedestrian (Iwaki, Sato, Wakasugi, & Uchida, 2015)
Car’s
characteristics Vehicle type Headlamp type (Sun et al., 2002) (Bullough & Skinner, 2009) Warning safety system (Lubbe, 2017)
Social interaction
Non-verbal communication (Guéguen, Eyssartier, & Meineri, 2016; Guéguen, Meineri, & Eyssartier, 2015; Katz et al., 1975)
Driver’s characteristics
Driver’s age (Bromberg, Oron-Gilad,
Ronen, Borowsky, & Parmet, 2012; Katz et al., 1975; Sun et al., 2002)
Pedestrian’s
characteristics Conspicuity (Balk et al., 2008; Langham & Moberly, 2003)
Table 2 — List of factors investigated in driver-cyclist overtaking interactions by study
Type of factor Factor References
Infrastructure design
Cycling lane presence (Chapman & Noyce, 2012; Kroll & Ramey, 1977; Parkin & Meyers, 2010)
Cycling lane width (McHenry & Wallace, 1985) Road markings (Shackel & Parkin, 2014) Road lane width (Shackel & Parkin, 2014) Road traffic regulation (Kay, Savolainen, Gates, &
Datta, 2014; Shackel & Parkin, 2014)
Interaction configuration
Posted speed limit (Dozza, Schindler, Bianchi-Piccinini, & Karlsson, 2016) Cyclist’s lateral position (Savolainen, Gates, Todd,
Datta, & Morena, 2012; Walker, 2007)
Oncoming traffic (Dozza et al., 2016; Moretto, 2017; Shackel & Parkin, 2014)
Time-to-collision between bicycle and car
(Moretto, 2017) Car’s
characteristics
Vehicle type (Shackel & Parkin, 2014) Driver’s
characteristics
Driver’s age (Nejad, 2017)
Driver’s gender (Nejad, 2017)
Cyclist’s characteristics
Cyclist’s gender (Walker, 2007)
Helmet use (Walker, 2007)
Appearance (clothing) (Walker, Garrard, & Jowitt, 2014)
Conspicuity (Costa et al., 2017; Wood et
al., 2012)
Table 3 — List of factors investigated in driver-cyclist crossing interactions by study
Type of factor Factor References
8 Infrastructure
design Cycle lane width (Räsänen, Koivisto, & Summala, 1999) Road traffic regulation (Räsänen et al., 1999)
Interaction configuration
Crossing direction (near or farside) (Räsänen & Summala, 2000)
Car’s speed (Silvano, Koutsopoulos, &
Ma, 2016)
Cyclist’s speed (Petzoldt, Schleinitz, Krems, & Gehlert, 2015; Silvano et al., 2016)
Arrival time difference (Silvano et al., 2016) Driver’s
characteristics
Expectancy (Phillips, Bjørnskau,
Hagman, & Sagberg, 2011)
Finally, in the case of driver-pedestrian interaction, it is worth noting that we found no studies that investigated overtaking scenarios with pedestrians. In the case of driver-cyclist interactions, only five of the cited studies investigated crossing interactions (Table 3) whereas the others focused on overtaking interactions (Table 2).
3.2
Driver behaviour models in driver-pedestrian interactions
Three of the studies presented in Table 1 produced models of drivers’ responses in interactions with pedestrians. The first one (Sun et al., 2002) is a probabilistic model that predicts whether a driver will yield. The second model (Bella & Silvestri, 2016) is a braking-response model that predicts the deceleration-phase duration (from the initial speed to the minimum speed) depending on the type of safety treatment (infrastructure design), the car’s initial speed, longitudinal distance to the crossing, minimum speed to reach, and the average deceleration rate. It is interesting to note that the authors concluded by saying that drivers could approach the intersection more smoothly when infrastructure design provided better visibility. Finally, the third model (Iwaki et al., 2015) is a process model that is more complete. It predicts the start of gas pedal release and brake initiation as well as jerk and maximum deceleration, with visibility as a main factor.These three models were developed for crossing scenarios; to the author’s knowledge no models for driver behaviour when overtaking a pedestrian have been published.
3.3
Driver behaviour models in driver-cyclist interactions
Most of the studies cited in Table 2 and Table 3 did not specifically intend to develop a driver model. However, a few of them sketched a driver model— and the ones that did, such as the one by (Dozza et al., 2016), were interested in overtaking manoeuvres. Only one study was found which treats the specific case of crossing driver-cyclist interaction; it provides a driver model predicting probabilities of getting in a conflict and of yielding (Silvano et al., 2016).4
Studying driver behaviour
Driving data from simulator, test-track and real-world driving are all considered in this thesis, because these environments provide the data which can be used to model driving behaviour, evaluate driver models, and evaluate ISS. Other types of studies (based on questionnaires, on-site recordings, or epidemiology, for example) have their strengths, but they do not provide detailed driving data about the driver’s controls—such as steering wheel angle and brake pedal use, or the driver’s cognition—such as eye movements, secondary tasks, and brain activity. Therefore, the data provided by the latter types of study cannot be used to model driver behaviour directly. Below is a short description of the three test environments of interest, followed by a brief qualitative comparison.
4.1
Real-world studies
There are three kinds of real-world studies: controlled observation, field operational tests (FOT), and naturalistic driving studies (NDS) (Carsten, Kircher, & Jamson, 2013). These three are designed to provide the researchers with naturalistic driving data; drivers are expected to behave naturally. They drive instrumented vehicles that record the cars’ controls, driver state, etc. Carsten et al. (2013) presented the three categories extensively and pinpointed their major applications. Controlled observations are short-duration experiments. Drivers are asked to drive on a real road and follow a predefined route that is carefully chosen according to the research objectives. FOT and NDS are both large-scale, long-term studies. FOTs are undertaken to evaluate assistance systems, while NDSs aim at improving knowledge about how conflicts arise. EuroFOT, one of the most recent FOT studies, had the goal of analysing the effects of adaptive cruise control systems (ACC) in combination with forward collision warning (FCW) (Benmimoun, Pütz, Zlocki, & Eckstein, 2013). SHRP2 is one of the most recent NDSs; the participants’ own cars were equipped to record the required data (SHRP2, 2006). Many investigations, such as that by (Victor et al., 2014), were done using these naturalistic driving data.
4.2
Test tracks
On a test track, a car is driven without real traffic. This method allows the researchers to have more control of the scenarios under investigation. Additionally, test-track environments can be used for two purposes:
12
evaluating ISS performance and studying driver behaviour. As examples from the literature, Kiefer et al. (1999) proposed evaluation procedures for ISS on a test track, and Najm and Smith (2004) presented a driver response model using data gathered on a test track.
The test-track setup may be a safer environment for the participants than real-world studies. As with controlled-observation studies, test-track studies are often of short duration and designed to answer specific research questions. However, because they are not on real roads and most of the interactions are with dummies or balloon cars, the ecological validity of the environment is questionable. Ecological validity is defined by (Mullen, Charlton, Devlin, & Bédard, 2011) as the degree to which simulator behaviour reflects real-life on-road behaviour patterns displayed over extended periods of time.
4.3
Driving simulators
Driving simulators are not a recent phenomenon. They were already mentioned in the literature at the beginning of the 20th century (K. Caird & J.
Horrey, 2011). In the 1960s, driver simulators were proposed for studying driver behaviour in interaction with VRU (Barrett et al., 1968). Simulators provide a safe experimental environment for studying the behaviour of drivers as they drive a virtual car. In the era of personal computers, the possibilities with respect to driving simulators have multiplied. We can nowadays easily find free, open-source driving simulators, such as OpenDS (Math, Mahr, Moniri, & Müller, 2013).
The proliferation of simulators has resulted in a heterogeneous mix. For research purposes, they can be classified as low- or high-fidelity. “Fidelity” describes how well a simulator reproduces the real-world experience. This experience can be defined in terms of three kinds of validity: ecological validity (defined above); behavioural validity, the extent to which a simulator elicits the same driving behaviour that occurs when driving on real roads; and physical validity, the extent to which the physical components of a simulated vehicle (i.e., layout, visual displays, and dynamic characteristics) correspond to on-road vehicles (definitions adapted from (Mullen et al., 2011)). The fidelity of a simulator describes the extent of its physical and ecological validities combined. Furthermore, fidelity has a direct impact on the behavioural validity of the simulator, as well; the more realistic the simulator experience the more immersed the drivers. Extensive research on simulator validity was conducted in 2011(Mullen et al., 2011), containing most of the considerations that a researcher should keep in mind when using simulators.
Behavioural, physical, and ecological validities in a simulator setup define the extent to which the driver, vehicle, and environment, respectively, reflect reality. These validities are important when interpreting driver behaviour in a simulator and should be considered when generalising results to the real world.
4.4
A qualitative comparison of test environments
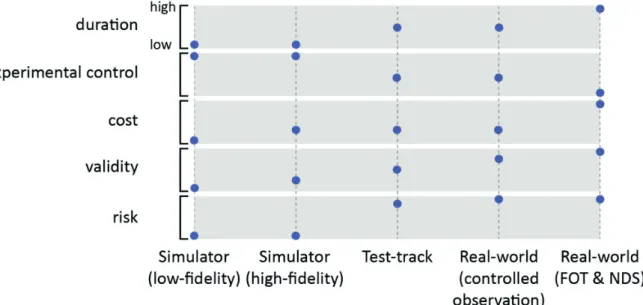
A qualitative comparison of the test environments (i.e. real world, test tracks, and driving simulators) is presented in Figure 1 and discussed below. Five key characteristics (duration, experimental control, cost, validity, and risk) are highlighted, showing how the environments differ and, possibly, complement each other.
Figure 1 — Qualitative comparison between experimental environments
Duration — Since NDS and FOT studies are usually long-term, they have a longer duration than the other types. Experimental control — Simulators allow researchers a high degree of control, and most of the scenario features can be extracted (kinematics, vehicle controls, etc.). Similarly, test tracks are more controlled than real-world studies because they offer the researchers a way to control the configuration of the test scenario. Finally, simulators, test tracks, and controlled observations permit the researchers to implement measurement systems that are more intrusive, such as EEG or fMRI, to monitor participants’ brain activity when driving (Alizadeh & Dehzangi, 2016). Cost — Costs are higher for NDS and FOT because of the long duration, hardware cost, data storage, etc. Comparing the costs of the other
14
types is difficult because it depends mainly on the type of setup chosen. However, low-fidelity simulators, such as a personal computer running OpenDS, would be remarkably inexpensive compared to the other environments. Validity — Both FOT & NDS seem to be the perfect environments for studying natural driving with high validity (behavioural, ecological, and physical). Controlled observation studies may be less valid because of the predefined and controlled aspects. Because test-track studies are undertaken off of real roads, they may have even less validity—but they may still have more validity than simulators. Risk — Risk can be seen as a significant factor that influences driver behaviour (Summala, 2007), but in simulators it is not present at all, and on test tracks (without real traffic, since other road users are represented by dummies, balloon cars, etc.) it is greatly diminished. In real-world studies, the risk can be considered similar to the normal risk that anyone experiences when driving.
An analysis based on these five key characteristics should facilitate the correct choice of methodology, by evaluating which is best suited to answer the research questions of interest.
5
Evaluating intelligent safety systems
5.1
System performance
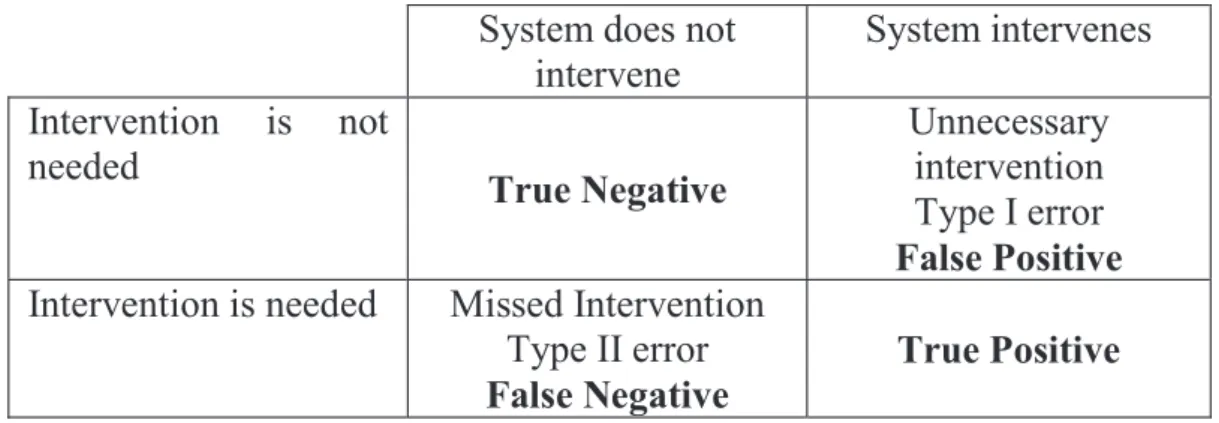
When evaluating the performance of an ISS, the aim is primarily to estimate how good the system is at detecting critical situations and intervening (true positive), and how good it is at not intervening when no intervention is required (true negative) (Nilsson, 2014). In this thesis, system performance is defined by the true positive rate (also called sensitivity) and false positive rate (also called specificity) (Fawcett, 2006). Sensitivity is a statistical measure which represents the proportion of true positives over the total number of situations where intervention is needed. Specificity is a statistical measure which represents the proportion of false positives over the total number of situations where intervention is not needed (see Table 4).
Table 4 — Binary classification adapted from (Nilsson, 2014)
System does not intervene System intervenes Intervention is not needed True Negative Unnecessary intervention Type I error False Positive Intervention is needed Missed Intervention
Type II error
False Negative True Positive
5.2
System safety benefits
To evaluate the impact of ISS in a real-world vehicle fleet, the safety benefits of the system are estimated. Concretely, a safety benefit evaluation answers questions such as “If we put the system on the market, how many crashes, fatalities, and injuries will it prevent?”. Safety benefits are different from performance; a system can be very effective (performance) without having a real impact on the number of crashes or their severity (safety benefits).
5.3
Methodologies for evaluating intelligent safety system
performance and safety benefits
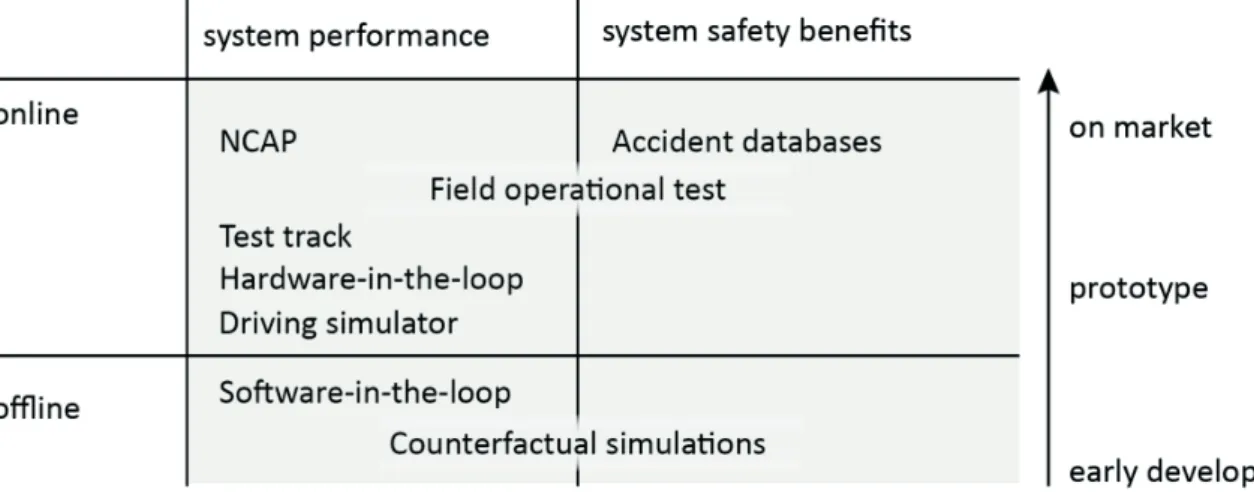
The performance and safety benefits of ISS can be evaluated using different methodologies, defined below. Figure 2 demonstrates a way to organise the
16
methodologies as a function of the real-time requirement of the system (on/offline) and the type of evaluation (performance vs. safety benefits). It should be noted that the methodologies discussed here are focused on the evaluation of ISS, in contrast to the ones presented in Chapter 4, which focused on driver behaviour. Online methodologies rely on the evaluated system being capable of running in real time, while offline methodologies do not. In Figure 2, the arrow on the right-hand side shows part of the product life cycle, from early development and beyond its release on the market. Depending on the requirements of the methodologies, the system may be at different stages of development (early, late or on the market). The methodologies are described below.
Figure 2 — Comparison of methodologies in a three-dimension space (on-/off-line, performance/safety benefits, and development timeline). NCAP stands for new car assessment program.
NCAP — The new car assessment programmes (NCAPs), such as Euro NCAP, may be the methodology most familiar to the public. These programmes rate ISS performance. Using test tracks, the programmes evaluate the performances of ISS that are already on the market. Therefore, they are distinguished from the test-track methodology (see Figure 2) which supports the development of ISS.
FOT — Field operational tests are defined in the previous section. This type of large-scale naturalistic driving study estimates performance and safety benefits. Data collected can be used to determine the performance, by analysing situations in which the system was activated or situations that required an intervention. Additionally, the safety benefits of the system can be evaluated if the study design integrates a baseline period. For example, in the famous EuroFOT study, drivers drove 3 months without active AEB and
FCW systems. Afterwards, the systems were activated for the rest of the data collection (Benmimoun et al., 2013).
Test track — Test-track studies are defined in the previous section, but here they do not focus on driver behaviour. Their setups allow ISS to be tested, to determine if the system works according to the specifications (Nilsson, 2014). Hardware- and Software-in-the-loop — The system can be tested at an early stage of the development process using hardware- or software-in-the-loop. If the system hardware is already available, the hardware-in-the-loop can test the actual implementation using a computer-based simulation that models all of the related systems (such as vehicle dynamics, vehicle control, environment, etc.). If the system is not physically available, a representation of it can be used instead; this is the software-in-the-loop methodology.
Driving simulator — For some ISSs, such as electronic stability control systems, the driver interacts directly with the system. In these cases, the software-in-the-loop does not provide the required interaction between the ISS to be evaluated and the driver. Instead, driving simulators can be used to evaluate the ISS; participants are instructed to drive with and without the systems and drive as they would normally. The modelled ISS’s performance can be evaluated by comparing the outcome of the scenarios with and without the ISS. A study by Markkula et al. presents such a methodology (Markkula, Benderius, Wolff, & Wahde, 2013).
Crash databases — Crash databases include databases from police reports, hospital reports, and insurance claims. The databases, such as GIDAS or STRADA, might include information about the crash, such as the type of crash, kinematics, trajectories, information on occupants, vehicles’ characteristics, etc. While not completely representative of all actual crashes, these databases provide researchers with comprehensive knowledge about crash scenarios. Additionally, it should be noted that these databases are rare and differ in terms of quality and the level of detail. It is possible to use these crash statistics to evaluate the safety benefits of the system of interest (Sternlund, 2017; Sternlund, Strandroth, Rizzi, Lie, & Tingvall, 2017; Strandroth et al., 2012). Typically, this methodology requires that the system to be evaluated have a large penetration rate, and it takes time to acquire enough data to evaluate the safety benefits.
Counterfactual simulations — The principle of counterfactual theory is not a recent concept. It is applied in different fields such as economics (Velupillai,
18
1996), cognitive sciences (Gerstenberg, Goodman, Lagnado, & Tenenbaum, 2014), or philosophy (WILLIAMSON, 2007). The idea behind the counterfactual analysis is to determine how an event would have changed if preceding events had been modified. This concept was introduced into ISS evaluation recently (McLaughlin, Hankey, & Dingus, 2008; Sugimoto & Sauer, 2005). The methodology uses real-world driving data recorded prior to critical events (e.g. crashes and near-crashes) (Aoki, Aga, Miichi, Matsuo, & Tanaka, 2010; Gordon et al., 2010; McLaughlin et al., 2008; McLaughlin, Hankey, Dingus, & Klauer, 2009; Rosén et al., 2010) or reconstructed driving data from crash statistics (Kusano & Gabler, 2012; Sugimoto & Sauer, 2005). These naturalistic driving data are used to replay the event, both with and without the ISS to be evaluated. The comparison between the two groups of events provides an estimation of the ISS performance and/or safety benefits. Safety indicators, such as the ratio of avoided crashes:crashes and the reduction of impact speed, are used in many counterfactual studies to describe the performance of ISS (Gordon et al., 2010; Kusano & Gabler, 2012; Sugimoto & Sauer, 2005; Van Auken et al., 2011). However, other metrics can be used, such as the frequency of ISS alerts, the percentage of the population expected to respond (McLaughlin et al., 2008), and fatality reduction (Aoki et al., 2010).
It should be highlighted that, in the history of ISS evaluation using counterfactual simulations, the implemented driver models could be as simple as chosen values of reaction time to initiate braking/steering (Kusano & Gabler, 2012; Sugimoto & Sauer, 2005). As McLaughlin et al. (2008) suggested, driver models should not be disregarded in this type of framework; they are an important piece of the puzzle and should be detailed enough to take into account the entire event process, from perception to action.
6
Objectives
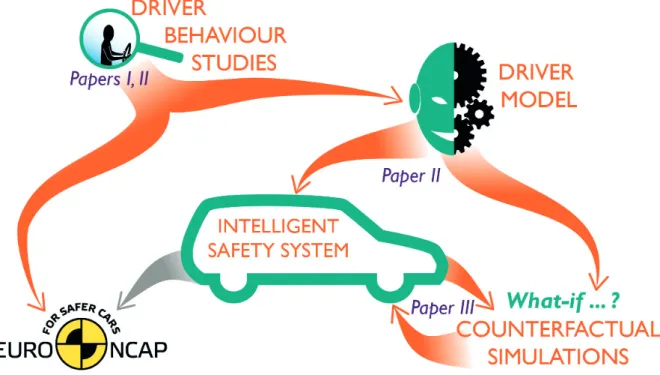
Figure 3 — Organization of the Ph.D. project.
The overall aim of this Ph.D. work is to inform the development and evaluation of ISS by modelling how drivers interact with pedestrians and cyclists. The models developed in this thesis will ideally be integrated into the threat assessment of ISS and guide the development of Euro NCAP test scenarios, Euro NCAP scenarios, to test how effectively ISS can avoid cyclists and pedestrians. Figure 3 illustrates the overall organisation of the Ph.D. project. The orange connectors represent the connections made between the different stakeholders of the research aim presented above, and the grey connector represents the Euro NCAP evaluation of ISS, which is an evident connection but out of the Ph.D.’s scope. The papers included in this licentiate thesis are referenced in the figure. The position of each reference shows what part of the project that paper addresses.
20
To achieve the overall aim, several objectives have been set: Intermediate objectives (to be achieved for the licentiate degree)
- Investigate, describe, and model the driver response process when a VRU crosses the driver path.
- Inform Euro NCAP with new knowledge about driver interactions with crossing VRU to guide the development of their test scenarios. - Develop a framework for ISS evaluation through counterfactual
simulations, including driver models of the driver response process.
Future objectives (to be achieved for the Ph.D. degree)
- Investigate, describe, and model the driver response process when a VRU is overtaken by the driver.
- Further develop and evaluate the response models (developed within this Ph.D. work) with naturalistic driving data.
7
Summary of papers
Paper I
Dozza M., Boda C.-N., Thalya P., Jaber L. and Lubbe N. “How do Drivers Negotiate Intersections with Pedestrians? Fractional Factorial Design in an Open-source Driving Simulator”. RSS2017 Road Safety & Simulation International Conference, Den Haag, The Netherlands. Oct. 17-19, 2017. Author’s contribution: Devised experimental protocol, modified OpenDS to match the study’s requirements, ran most of the analyses, produced the figures, and participated in the paper writing.
Paper II
Boda, C.-N, Dozza, M., Bohman, K., Thalya, P., Larsson, A., Lubbe, N. (2017). “Modelling how drivers respond to bicyclists crossing their path at intersections: How do test-track and driving simulator experiments compare?” (submitted to Accident Analysis and Prevention)
Author’s contribution: Main writer and coordinator of contributions from the co-authors. Participated in the setup of the simulator and test-track experiments and devised the experimental protocol. Performed all the analyses in the paper.
Paper III
Bärgman, J., Boda, C.-N., Dozza, M. (2017). "Counterfactual simulations applied to SHRP2 crashes: The effect of driver behaviour models on safety benefit estimations of intelligent safety systems." Accident Analysis & Prevention, 102, 165-180. http://dx.doi.org/10.1016/j.aap.2017.03.003 Author’s contribution: Participated in the analyses and the framework definition. Contributed to the paper writing.
Paper I — How do Drivers Negotiate Intersections with
Pedestrians? Fractional Factorial Design in an Open-source
Driving Simulator
Introduction
Intelligent safety systems still need improvement to intervene at the right time; a compromise has to be found between degrading driver acceptance of the system (by intervening too early) and degrading the system’s safety benefits (by intervening too late). The influence of factors such as lane width or pedestrian speed on the intervention timing of ISS for pedestrian crash avoidance is unknown.
Aim
The paper evaluated the influence on the driver response process of seven factors (crossing side, car speed, pedestrian speed, crossing angle, pedestrian size, zebra presence, and lane width) in a driving simulator study, applying a fractional factorial design.
Method
Ninety-four volunteers participated in the study and drove through an intersection in a fixed-base driving simulator. The levels of studied factors followed a fractional factorial design. Several parameters describing the driver response process, such as time-to-arrival or driver response time, were calculated.
Results
Results of linear mixed-effect models show that the driver response process was mainly based on pedestrian time-to-arrival and visibility. The other factors did not have a significant influence. Some longitudinal effects were present; more experienced drivers were more susceptible to changing their approach strategy to minimize driving effort than less experienced drivers were. Nevertheless, all participants behaved similarly.
Discussion
Greater understanding of pedestrian visibility and pedestrian time-to-arrival will facilitate the design of more precise and acceptable activation timings for FCW and AEB systems. The fractional factorial design was helpful in reducing the number of trials while retaining the ability to study the factors’ main effects. However, this design did not allow in-depth analyses; post-hoc
24
analyses would be required. Finally, this study may guide future design and evaluation of FCW and AEB (perhaps with counterfactual analyses) by highlighting which factors deserve further investigation.
Paper II — Modelling how drivers respond to bicyclists crossing
their path at intersections: How do test-track and driving
simulator experiments compare?
Introduction
Bicyclist fatalities are a great concern in the European Union. Most of them are due to crashes between motorized vehicles and bicyclists at unsignalised intersections. One countermeasure that has been introduced to reduce the number of crashes is ISS. These safety systems require a good understanding of driver behaviour in order to assist drivers without becoming a source of annoyance.
Aim
This study was undertaken to provide new knowledge on driver-bicycle interactions in intersections, to inform the design of test scenarios for assessment programmes such as Euro NCAP.
Method
The study investigated how drivers responded to bicyclists crossing their path at an intersection. The influences of car speed and cyclist speed on the driver response process were assessed for three different crossing configurations. The same experimental protocol was tested in a fixed-base driving simulator and on a test track. A virtual model of the test track was used in the driving simulator to keep the experimental protocol as consistent as possible across testing environments.
Results
Results show that car speed and bicycle speed did not directly influence the response process, and neither did crossing configuration—although the configuration did influence the strategy chosen by the drivers to approach the intersection. Bicycle visibility, the point in time when the bicycle became visible (which depended on the car speed, the bicycle speed, and the crossing configuration), had the most important effect on the driver response process. Dissimilarities between the test-track and driving-simulator studies were found; however, there were also interesting similarities, especially for driver braking behaviour. Results from both protocols show that drivers followed the same strategy to initiate braking and regulate their approach towards the intersection independent of the test environment. On the other hand, the
26
participants did not follow the same strategy in both environments when it came to releasing the gas pedal.
Discussion
These findings suggest that bicyclist visibility should be integrated in the threat assessment algorithms of ISS, since it is such a predominant factor in the driver response process. Additionally, the driver model based on these findings suggests that it is acceptable for a frontal collision warning (FCW) to be activated before an autonomous emergency braking system. It is, therefore, suggested that Euro NCAP consider test scenarios utilising FCW in bicyclist crossing interactions as part of their test protocol.
Paper III — Counterfactual simulations applied to SHRP2
crashes: The effect of driver behaviour models on safety benefit
estimations of intelligent safety systems
Introduction
Counterfactual simulations are a recently developed methodology for evaluating safety benefits of ISS. They were primarily developed to evaluate ISSs before the systems’ introduction on the market. The simulations implement models from the joint driver-vehicle-environment system. However, so far, the inclusion of driver models in counterfactual simulations has been very limited.
Aim
The aims of the paper were, firstly, to demonstrate and highlight how important the choice of driver model is when evaluating two specific ISSs (forward collision warning and autonomous emergency braking systems). Secondly, the paper shows how sensitivity analyses on the settings of driver models or ISS models can be performed using counterfactual analyses. The final aim of the paper was to evaluate how the choice of driver glance distribution influenced the safety benefit estimation.
Method
For the demonstrations, the SHRP2 NDS dataset was used. Thirty-four rear-end crashes were used to provide pre-crash kinematics and driver behaviour. A counterfactual simulation framework was devised and compared with another counterfactual framework. Sensitivity analyses were done to evaluate the impacts of various driver models on the results of the evaluation framework. Additionally, the devised framework estimated the safety benefits of a FCW with different settings, to demonstrate how counterfactual simulations can be used to tweak an ISS.
Results
The results show that the percentage of crashes avoided, thanks to FCW, was largely dependent on driver model; there was a large difference between the conceptually different models, while differences were small for conceptually similar models. On the other hand, the AEB safety benefit was not influenced much by the driver model. The results of the FCW tuning using the devised framework showed the influence of the settings on the system’s efficiency.
28
Discussion
The findings show that the choice of driver models greatly influence the results of the simulation. Researchers and others who use counterfactual simulations to evaluate ISS with driver models are therefore advised to choose driver models carefully. Additionally, the framework demonstrated its potential for fine-tuning a FCW; clearly, it can be used in the future to improve ISSs in the early development stage.
8
Discussion
8.1
Driver response process in interaction with VRUs
The exploratory study undertaken in Paper I demonstrated that the crossing side (i.e. far- and near-side entry), which was related to the pedestrian visibility, had a strong influence on the driver response process. In line with this result, Paper II showed that bicycle visibility was the most predominant of the influential factors on the driver braking response (both in the simulator and on the test track). These results, which corroborate the studies of Bella and Silvestri (2016) and Iwaki et al. (2015), extend the knowledge about driver behaviour in interactions with VRUs beyond what was previously reported in the literature (Chapter 3.1).
In terms of driver response process steps, brake onset was found to be consistent across the studies in Papers I and II, suggesting that in fact it is the crossing scenario, and not the VRU type, which directs the initial driver response. In contrast, gas pedal release was not consistent across the two studies (for the simulator experiments). It may be that the different virtual environments in the two studies led the drivers to behave differently; or it may be that the different control interfaces played a role (the pedals’ springs were different in the two experiments).
Paper II devised a driver braking model based on the data gathered in driving-simulator and test-track experiments. Chapter 3.3 reported how few models for driver behaviour in crossing interactions with cyclists existed in the literature. The modelled process presented in Paper II started to address this lack. However, this driver model describes only one part of the driver response in this type of scenario; further work should extend the model to cover the whole response process.
8.2
Test environments
Simulators and test tracks are always criticised because of their artificial setups; they do not represent natural driving, as in an NDS (see Chapter 4.4). They remain, nonetheless, of high utility because of their advantages (repeatability, low cost, and fast implementation). Test tracks are expected to be more valid physically (e.g. vehicle dynamics) and ecologically than driving simulators (Mullen et al., 2011). Nevertheless, the ecological validity
30
of test tracks needs to be carefully evaluated, because the environment is not the same as real traffic.
Setting up a test-rack study requires a lot of effort (human resources, time, funding, etc.) compared to fixed-base driving simulators. Therefore, as Paper I suggests, researchers do not have to use only one type of environment; they can use a combination. For instance, Paper I demonstrated that a low-cost driving simulator can be used to run an exploratory analysis by showing which of seven factors was the most predominant, thanks to a fractional factorial experimental design. In the study in Paper II, the most predominant factor was then analysed further in a test-track experiment to evaluate the factor’s influence in a more ecologically and physically valid environment. Comparing driving simulators and on-road studies is also important, to show to what extent driver behaviour in a simulator relates to natural driver behaviour; Mullen et al. (2011) present an extensive discussion of these two setups. The study presented in Paper II was partly undertaken to address a related question: To what extent does driver behaviour exhibited in an inexpensive, open-source driving simulator relate to a test-track setup? However, the results do not validate the driving simulator. Rather, they provide a comparison of the driver response process between a fixed-base simulator experiment and a test-track experiment. It was demonstrated that the brake onset behaviours in the simulator and the test track were similar. This is consistent with other studies, such as that of Hoffman, Lee, Brown, and McGehee (2002), which compared the driver response process in a high-fidelity driving simulator with the process in a test-track experiment. Their results suggest that brake onset is stable between the simulator and the test track— strongly corroborating the suggestion made in Paper I that the use of a driving simulator as an exploratory technique (before investigating driver behaviour on test tracks) is legitimate.
8.3
Safety system design
The results from Paper I and Paper II pinpointed that visibility, i.e. the time taken by the car to reach the intersection after the VRU appears, was the most predominant factor influencing driver response process. This important result indicates that the ISS designer should consider integrating visibility into the ISS decision-making algorithm. More specifically, it was shown in Paper II that almost all drivers (97.5%) initiated braking before their time-to-arrival was equal to 1.8s at high visibility. For shorter visibilities, the brake initiation was linearly correlated with visibility, resulting in shorter brake reaction
times (the time from the moment when the bicycle started to be visible to the brake onset). This result, which remains to be validated with data from NDS, highlights the possible relevance of implementing a frontal collision warning in crossing scenarios with bicyclists, as suggested in Paper II.
The framework developed in Paper III demonstrated that counterfactual analyses are a viable technique for fine-tuning the ISS: the output of the counterfactual simulation can be used to optimise the parameters of the ISS. For instance, for drivers known to have a longer reaction time (e.g. elderly people), the ISS could issue warnings earlier to maximise the performances/safety benefits of the system. As shown in Chapter 5.3, counterfactual simulations can be used at an early stage of product development to design better ISSs and maximise safety benefits. However, to be as valid as possible the simulations need to implement detailed driver models, Papers I and II provide new knowledge which is a first step towards creating driver models for interactions with VRUs.
8.4
Safety system evaluations
Euro NCAP, the European assessment programme, recently introduced new test scenarios to assess ISSs interactions with VRUs (Euro NCAP, 2017a, 2017b). The scenarios were designed to rate the performance of a pedestrian autonomous braking system (AEB), a pedestrian frontal collision warning system (FCW), and a bicycle AEB. The results of Paper II suggest that it is possible to design a FCW that could be triggered before an AEB; therefore, it is suggested that Euro NCAP consider evaluating this possibility in the future. Additionally, Paper I and Paper II showed that Euro NCAP’s required activation time for AEB systems is appropriate because it corresponds to moments when drivers would be in their discomfort zone.
Paper III compared different configurations of counterfactual simulations using different types of driver models. The results show that the
methodology of counterfactual simulation is a viable tool for estimating safety benefits. In addition to what has been done previously (see Chapter 5.3), Paper III implemented a much more detailed driver model which included glance behaviour. A comparison of the safety benefit estimation for different levels of detail of driver model showed that the estimation depends strongly on the type of driver models. Thus it is clear that the choice of driver model to be used in counterfactual simulations should always be well-grounded.
9
Conclusions
9.1
Driver response process in interaction with VRU
The studies presented in Paper I and Paper II investigated additional factors not previously explored in the literature. Both studies demonstrated a predominant factor which influences driver behaviour in interactions with pedestrians and bicyclists: the visibility of the VRU, i.e. the point in time when the pedestrian or the bicycle becomes visible to the driver. Additionally, brake onset was shown to be a consistent indicator, describing the driver braking process in both studies. Furthermore, the results from Paper II detailed the relation between the driver brake onset response and bicycle visibility. As a result, a driver brake onset response model was devised.
9.2
Simulators and test-tracks in the era of naturalistic driving
studies
While the results from Paper I and II may not be considered ecologically valid until they are verified against NDD, they show that 1) driving simulators and test tracks may be equivalent for some research questions and 2) test-track experiments can leverage on simulator experiments to decrease costs and narrow down research objectives. Paper I showed that a simple fixed-base simulator with a fractional factorial design could be used for exploratory analyses. Paper II compared the results from a fixed-base simulator with those from a test-track and showed that the brake onset behaviour was not significantly different, while the other response characteristics (accelerations, start of gas pedal release, etc.) were. This suggests that brake onset may be a stable indicator for describing driver response processes in both test-track and simulator protocols. The behavioural validity of brake onset will be further investigated with NDS data in the future.
9.3
Safety systems design
As stated in the previous paragraphs, it has been highlighted that visibility of the VRU plays an important role in the driver response process (Paper I, Paper II). This finding suggests that the decision-making algorithm of safety systems should consider the time at which the VRU starts to be visible as an important variable for decreasing annoying activations (false positives). Some numerical models of activation times were given in Paper II for the design of a bicyclist FCW. However, the results from Paper II should be validated with NDS data to confirm the estimated values. This validation will
34
be done in future as part of the PhD project. Paper III demonstrated how counterfactual simulations, with a sufficiently detailed driver model, could be used to fine-tune ISS at an early stage of development. This possibility demonstrates that counterfactual methodology has significant potential in the future.
9.4
Recommendations for Euro NCAP
Papers I and II demonstrated that, for both pedestrian and bicyclist interactions, Euro NCAP’s required activation time for AEB systems was appropriate because they correspond to moments when drivers would be in their discomfort zone. However, it has also been demonstrated that Euro NCAP’s activation times happen later than drivers’ brake onset. Therefore activating AEB earlier or issuing a warning (such as FCW) earlier would be possible without creating nuisance to drivers. Hence, Paper II suggests that FCW systems not be excluded from test scenarios in crossing interactions with cyclists.
9.5
Evaluation of safety system performances with
counterfactual simulations
A framework for safety systems evaluation was developed and presented in Paper III. It was shown that not only could the framework estimate the safety benefits of ISS, but it could also be used to tune the ISS. It was pointed out that the results of the evaluations were highly dependent on the type of driver model. The design of the driver model is thus crucial when using counterfactual simulations; the model should be detailed enough to capture most of the driver behaviour process. Paper II introduced a driver model that strives to detail further driver behaviour in crossing interactions with cyclists, which will be further developed in this Ph.D. project as part of counterfactual simulations.
10
Future work
To fulfill the next objectives of this PhD project (see Chapter 6), the following work will be undertaken:
- Investigate driver behaviour in overtaking interactions with pedestrians and bicyclists. Test track experiments will be conducted to investigate driver behaviour in such scenarios.
- Further develop the driver model presented in Paper II using naturalistic driving data. Analyses of naturalistic driving data will be done to adjust the driver model with more ecologically valid data. - Model the driver control process when drivers overtake
pedestrians and bicyclists. The knowledge gathered by the future driver behaviour studies (i.e. test-track and NDS) will be used to devise a detailed driver model.
- Verify the driver models using naturalistic driving data. All the devised driver models (lateral and crossing interactions with both cyclists and pedestrians) will be evaluated against data extracted from naturalistic driving studies.
11
References
Alizadeh, V., & Dehzangi, O. (2016, 1-4 Nov. 2016). The impact of secondary tasks on drivers during naturalistic driving: Analysis of EEG dynamics. Paper presented at the 2016 IEEE 19th International Conference on Intelligent Transportation Systems (ITSC).
Aoki, H., Aga, M., Miichi, Y., Matsuo, Y., & Tanaka, S. (2010). Safety impact methodology (SIM) for effectiveness estimation of a pre-collision system (PCS) by utilizing driving simulator test and EDR data analysis. Retrieved from http://papers.sae.org/2010-01-1003/
Balk, S. A., Tyrrell, R. A., Brooks, J. O., & Carpenter, T. L. (2008). Highlighting Human Form and Motion Information Enhances the Conspicuity of Pedestrians at Night. Perception, 37(8), 1276-1284. doi:doi:10.1068/p6017
Barrett, G. V., Kobayashi, M., & Fox, B. H. (1968). Feasibility of Studying Driver Reaction to Sudden Pedestrian Emergencies in an Automobile Simulator. Human Factors: The Journal of the Human Factors and
Ergonomics Society, 10(1), 19-26.
doi:10.1177/001872086801000104
Bella, F., & Silvestri, M. (2015). Effects of safety measures on driver's speed behavior at pedestrian crossings. Accident Analysis & Prevention, 83, 111-124. doi:http://dx.doi.org/10.1016/j.aap.2015.07.016
Bella, F., & Silvestri, M. (2016). Driver's braking behavior approaching pedestrian crossings: a parametric duration model of the speed reduction times. Journal of Advanced Transportation, 50(4), 630-646. doi:10.1002/atr.1366
Benmimoun, M., Pütz, A., Zlocki, A., & Eckstein, L. (2013). euroFOT: Field Operational Test and Impact Assessment of Advanced Driver Assistance Systems: Final Results Proceedings of the FISITA 2012 World Automotive Congress: Volume 9: Automotive Safety Technology (pp. 537-547). Berlin, Heidelberg: Springer Berlin Heidelberg.
Bromberg, S., Oron-Gilad, T., Ronen, A., Borowsky, A., & Parmet, Y. (2012). The perception of pedestrians from the perspective of elderly experienced and experienced drivers. Accident Analysis &
Prevention, 44(1), 48-55.
38
Bullough, J., & Skinner, N. (2009). Predicting stopping distances under different types of headlamp illumination. Paper presented at the Proceedings of the 8th International Symposium on Automotive Lighting.
Cacciabue, P. C., Carsten, O., & Tango, F. (2010). AE special issue on “driver modelling in automotive systems”. Applied Ergonomics, 41(2), 177-178. doi:http://dx.doi.org/10.1016/j.apergo.2009.03.001
Carsten, O., Kircher, K., & Jamson, S. (2013). Vehicle-based studies of driving in the real world: The hard truth? Accident Analysis & Prevention, 58, 162-174.
Chapman, J., & Noyce, D. (2012). Observations of Driver Behavior During Overtaking of Bicycles on Rural Roads. Transportation Research Record: Journal of the Transportation Research Board, 2321, 38-45. doi:10.3141/2321-06
Costa, M., Bonetti, L., Bellelli, M., Lantieri, C., Vignali, V., & Simone, A. (2017). Reflective Tape Applied to Bicycle Frame and Conspicuity Enhancement at Night. Human Factors, 59(3), 485-500. doi:doi:10.1177/0018720816677145
Dozza, M., Schindler, R., Bianchi-Piccinini, G., & Karlsson, J. (2016). How do drivers overtake cyclists? Accident Analysis & Prevention, 88, 29-36. doi:http://dx.doi.org/10.1016/j.aap.2015.12.008
Engström, J., Bärgman, J., Nilsson, D., Seppelt, B., Markkula, G., Piccinini, G. B., & Victor, T. (2017). Great expectations: A predictive processing account of automobile driving. Theoretical Issues in Ergonomics Science, 1-39.
Euro NCAP. (2015). Euro NCAP AEB Test Protocol v1.1 Assessment Protocol. Euro NCAP. (2017a). Euro NCAP Assessment Protocol - PP v9.0. Assessment
Protocol.
Euro NCAP. (2017b). Euro NCAP Assessment Protocol AEB VRU Test Protocol v2.0. Assessment Protocol.
European Commission. (2016). Annual Accident Report European Commission. Retrieved from
European Parliament, C. o. t. E. U. (2010). Directive 2010/40/EU of the European Parliament and of the Council of 7 July 2010 on the framework for the deployment of Intelligent Transport Systems in the field of road transport and for interfaces with other modes of transport Text with EEA relevance. (2010/40/EU). Retrieved from
Fawcett, T. (2006). An introduction to ROC analysis. Pattern Recognition
Letters, 27(8), 861-874.
doi:http://dx.doi.org/10.1016/j.patrec.2005.10.010
Fildes, B., Keall, M., Bos, N., Lie, A., Page, Y., Pastor, C., . . . Tingvall, C. (2015). Effectiveness of low speed autonomous emergency braking in real-world rear-end crashes. Accident Analysis & Prevention, 81, 24-29. doi:https://doi.org/10.1016/j.aap.2015.03.029
Fuller, R. (1984). A conceptualization of driving behaviour as threat
avoidance. Ergonomics, 27(11), 1139-1155.
doi:10.1080/00140138408963596
Gerstenberg, T., Goodman, N., Lagnado, D., & Tenenbaum, J. (2014). From counterfactual simulation to causal judgment. Paper presented at the Proceedings of the Cognitive Science Society.
Gordon, T., Sardar, H., Blower, D., Ljung Aust, M., Bareket, Z., Barnes, M., . . . Juhas, B. (2010). Advanced crash avoidance technologies (ACAT) program–Final report of the Volvo-Ford-UMTRI project: safety impact methodology for lane departure warning–Method development and estimation of benefits. Retrieved from
Guéguen, N., Eyssartier, C., & Meineri, S. (2016). A pedestrian's smile and drivers' behavior: When a smile increases careful driving. Journal of
Safety Research, 56, 83-88.
doi:http://dx.doi.org/10.1016/j.jsr.2015.12.005
Guéguen, N., Meineri, S., & Eyssartier, C. (2015). A pedestrian’s stare and drivers’ stopping behavior: A field experiment at the pedestrian
crossing. Safety Science, 75, 87-89.
doi:http://dx.doi.org/10.1016/j.ssci.2015.01.018
Hayashi, H., Inomata, R., Fujishiro, R., Ouchi, Y., Suzuki, K., & Nanami, T. (2013). Development of pre-crash safety system with pedestrian collision avoidance assist. Paper presented at the Proceedings of the 23rd International Technical Conference on the Enhanced Safety of Vehicles (ESV), 13.
Hoffman, J., Lee, J., Brown, T., & McGehee, D. (2002). Comparison of Driver Braking Responses in a High-Fidelity Simulator and on a Test Track.
Transportation Research Record: Journal of the Transportation Research Board, 1803, 59-65. doi:10.3141/1803-09
Hulshof, W., Knight, I., Edwards, A., Avery, M., & Grover, C. (2013).
Autonomous emergency braking test results. Paper presented at the Proceedings of the 23rd International Technical Conference on the Enhanced Safety of Vehicles (ESV).
40
Iasmin, H., Kojima, A., & Kubota, H. (2015). Yielding behavior of left turning driver towards pedestrian/cyclist: Impact of intersection angle.
Journal of the Eastern Asia Society for Transportation Studies, 11, 2146-2158.
Iwaki, R., Sato, K., Wakasugi, T., & Uchida, N. (2015). Analysis and modeling of driver behavior on pedestrian crossing road situation (1st report: Modeling driver's response). Paper presented at the FAST-zero'15: 3rd International Symposium on Future Active Safety Technology Toward zero traffic accidents, 2015.
K. Caird, J., & J. Horrey, W. (2011). Twelve Practical and Useful Questions About Driving Simulation Handbook of Driving Simulation for Engineering, Medicine, and Psychology: CRC Press.
Katz, A., Zaidel, D., & Elgrishi, A. (1975). An Experimental Study of Driver and Pedestrian Interaction during the Crossing Conflict. Human Factors: The Journal of the Human Factors and Ergonomics Society, 17(5), 514-527. doi:10.1177/001872087501700510
Kay, J. J., Savolainen, P. T., Gates, T. J., & Datta, T. K. (2014). Driver behavior during bicycle passing maneuvers in response to a Share the Road sign treatment. Accident Analysis & Prevention, 70, 92-99. doi:http://dx.doi.org/10.1016/j.aap.2014.03.009
Kiefer, R., LeBlanc, D., Palmer, M., Salinger, J., Deering, R., & Shulman, M. (1999). Development and validation of functional definitions and evaluation procedures for collision warning/avoidance systems. Retrieved from http://trid.trb.org/view.aspx?id=724278
http://ntl.bts.gov/lib/jpodocs/repts_te/87l01!.pdf
Kroll, B., & Ramey, M. (1977). Effects of bike lanes on driver and bicyclist behavior. Transportation engineering journal of the American Society of Civil Engineers, 103(2), 243-256.
Kusano, K. D., & Gabler, H. C. (2012). Safety Benefits of Forward Collision Warning, Brake Assist, and Autonomous Braking Systems in Rear-End Collisions. Intelligent Transportation Systems, IEEE Transactions on, 13(4), 1546-1555. doi:10.1109/TITS.2012.2191542
Langham, M., & Moberly, N. (2003). Pedestrian conspicuity research: a
review. Ergonomics, 46(4), 345-363.
doi:10.1080/0014013021000039574
Lindman, M., Ödblom, A., Bergvall, E., Eidehall, A., Svanberg, B., & Lukaszewicz, T. (2010). Benefit estimation model for