A Cost-Benefit Analysis of Electronic Medical
Records in Primary Care
Samuel J. Wang, MD, PhD, Blackford Middleton, MD, MPH, MSc, Lisa A. Prosser, PhD,
Christiana G. Bardon, MD, Cynthia D. Spurr, RN, MBA, Patricia J. Carchidi, RN, MSN,
Anne F. Kittler, Robert C. Goldszer, MD, MBA, David G. Fairchild, MD, MPH,
Andrew J. Sussman, MD, MBA, Gilad J. Kuperman, MD, PhD, David W. Bates, MD, MSc
PURPOSE: Electronic medical record systems improve the quality of patient care and decrease medical errors, but their financial effects have not been as well documented. The purpose of this study was to estimate the net financial benefit or cost of implementing electronic medical record systems in primary care.
METHODS: We performed a cost-benefit study to analyze the financial effects of electronic medical record systems in ambu-latory primary care settings from the perspective of the health care organization. Data were obtained from studies at our insti-tution and from the published literature. The reference strategy for comparisons was the traditional paper-based medical record. The primary outcome measure was the net financial benefit or cost per primary care physician for a 5-year period. RESULTS: The estimated net benefit from using an electronic
medical record for a 5-year period was $86,400 per provider. Benefits accrue primarily from savings in drug expenditures, improved utilization of radiology tests, better capture of charges, and decreased billing errors. In one-way sensitivity analyses, the model was most sensitive to the proportion of patients whose care was capitated; the net benefit varied from a low of $8400 to a high of $140,100. A five-way sensitivity anal-ysis with the most pessimistic and optimistic assumptions showed results ranging from a $2300 net cost to a $330,900 net benefit.
CONCLUSION: Implementation of an electronic medical record system in primary care can result in a positive financial return on investment to the health care organization. The mag-nitude of the return is sensitive to several key factors. Am J Med. 2003;114:397– 403.©2003 by Excerpta Medica Inc.
E
lectronic medical record systems have the potential to provide substantial benefits to physicians, clinic practices, and health care organizations. These sys-tems can facilitate workflow and improve the quality of patient care and patient safety (1– 4). Application of in-formation technology has been identified by the Institute of Medicine as one of the principal ways to improve the quality of health care (5). Because of these benefits, the Leapfrog Group (6), a coalition of the nation’s largest employers, is considering making use of outpatient elec-tronic medical records its next standard for health care purchasing contracts.In several other countries, use of electronic medical records ranges from 50% to 90% (7–9). In the United States, however, adoption of electronic medical records has been slow, and only about 7% of physicians use them (10). The cost of implementation is often cited as a barrier to their use. Although there are anecdotal reports
sug-gesting that electronic medical records provide financial benefits by helping to reduce costs and improve revenues (11–26), few formal cost-benefit analyses have been done. Because their widespread adoption will depend in part on the ability to make a business case for financial benefits to the health care organization, we performed a formal cost-benefit analysis of implementing an elec-tronic medical record system.
METHODS
Study Design
We performed a cost-benefit analysis of electronic med-ical record usage by primary care physicians in an ambu-latory-care setting. The primary outcome measure was net financial costs or benefits per provider during a 5-year period. The model was framed from the perspective of the health care organization, and the reference strategy was the traditional paper-based medical record. All costs and benefits were converted to 2002 U.S. dollars (27).
Data on costs and benefits came from primary data collected from our electronic medical record system, from other published studies, and from expert opinion. When data were not available, expert opinion was ob-tained using a modified Delphi (28) technique to arrive at group consensus with a 7-member expert panel. Primary data were obtained from several internal medicine clinics using our internally developed electronic medical record
From the Department of Information Systems (SJW, BM, CDS, PJC, AFK, GJK, DWB), Partners HealthCare System, Boston, Massachusetts; Division of General Medicine and Primary Care (BM, CGB, RCG, DGF, AJS, GJK, DWB), Brigham and Women’s Hospital, Boston, Massachu-setts; and Department of Ambulatory Care and Prevention (LAP), Har-vard Medical School and HarHar-vard Pilgrim Health Care, Boston, Massa-chusetts.
Requests for reprints should be addressed to Samuel J. Wang, MD, PhD, Partners HealthCare System, 93 Worcester Street, Wellesley, Mas-sachusetts 02481, or [email protected].
Manuscript submitted May 13, 2002, and accepted in revised form December 3, 2002.
system (29) at Partners HealthCare System, an integrated delivery network formed in 1994 by the Brigham and Women’s Hospital and the Massachusetts General Hos-pital.
We constructed a hypothetical primary care provider patient panel using average statistics from our institution. This panel included 2500 patients, 75% of whom were under 65 years of age; 17% of patients under 65 years old belonged to capitated plans. In sensitivity analyses, panel size was varied from 2000 to 3000 patients, and the pro-portion of patients under the age of 65 years whose cases were capitated was varied from 0% to 28.7%. According to industry estimates, health maintenance organization enrollment was 28.7% of the U.S. population in 2000 (30,31).
Costs
There are two categories of costs associated with elec-tronic medical record implementation: system costs and induced costs (Table 1). System costs include the cost of the software and hardware, training, implementation, and ongoing maintenance and support. Induced costs are those involved in the transition from a paper to electronic system, such as the temporary decrease in provider pro-ductivity after implementation.
The software costs of $1600 per provider per year were based on the costs for our electronic medical record sys-tem at Partners HealthCare on an annual per-provider basis (as an“application service provider”model); this
figure includes the costs of the design and development of the system, interfaces to other systems (e.g., registration, scheduling, laboratory), periodic upgrades, and costs of user accounts for support staff. Although these software costs were based on our internally developed system, they are consistent with license fees for commercially available systems, which have been estimated at between $2500 and $3500 per provider for the initial software purchase, plus annual maintenance and support fees of 12% to 18% (K. MacDonald, First Consulting Group, Lexington, Massachusetts, written communication, 1999). In
sensi-tivity analyses, software costs were varied from 50% to 200% of the base value.
Implementation costs, estimated at $3400 per provider in the first year, included workflow process redesign, training, and historical paper chart abstracting. Ongoing annual maintenance and support costs were estimated to be $1500 per provider per year and included the costs of additional technical support staff and system/network administration.
Hardware costs were calculated to be $6600 per pro-vider for three desktop computers, a printer, and network installation. We assumed that hardware would be re-placed every 3 years.
Based on our experience, we modeled the induced costs of temporary loss of productivity using a decreasing stepwise approach, assuming an initial productivity loss of 20% in the first month, 10% in the second month, and 5% in the third month, with a subsequent return to baseline productivity levels. Using the average annual provider revenues for our model patient panel, this amounted to a revenue loss of $11,200 in thefirst year.
Benefits
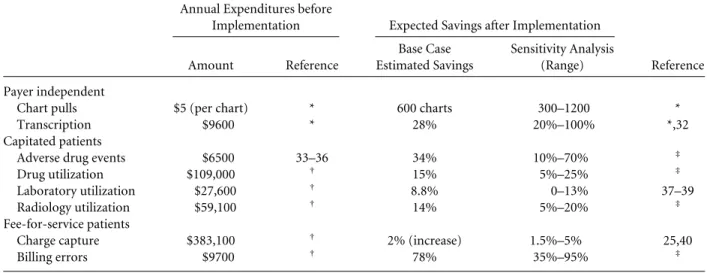
Financial benefits included averted costs and increased revenues. We obtainedfigures for average annual expen-ditures for a primary care provider at our institution be-fore the implementation of an electronic medical record, and applied to this the estimated percentage cost savings after implementation (Table 2). For each item, the esti-mated savings was varied across the indicated range of values in the sensitivity analysis. Benefits were divided into three categories: payer-independent benefits,
bene-fits under capitated reimbursement, and benefits under fee-for-service reimbursement (32–40).
Payer-independent benefits, which apply to both capi-tated and fee-for-service patients, come from reductions in paper chart pulls and transcription. The average cost of a chart pull at our institution is approximately $5, ac-counting for the time and cost of medical records person-nel to retrieve and then re-file a paper chart. After
con-Table 1. Costs of Electronic Medical Record System Used in the Model (Per Provider in 2002 U.S. Dollars)
Base Case
Sensitivity Analysis
(Range) Reference System costs
Software (annual license) $1600 $ 800–$3200 *
Implementation $3400 †
Support and maintenance $1500 $ 750–$3000 * Hardware (3 computers1network) $6600 $3300–$9900 * Induced costs
Temporary productivity loss $11,200 $5500–$16,500 * * Data from Partners HealthCare System, Boston, Massachusetts.
version to the electronic medical record system, chart pulls can be reduced by 600 charts (range, 300 to 1200) per year, based on the experience at one Partners Health-Care clinic. Transcription costs were reduced by 28% from partial elimination of dictation. In the sensitivity analysis, we varied the savings from 20% to 100% based on the experiences from other implementations (32).
Benefits under capitated reimbursement accrue to the practice and health care organization primarily from averted costs as a result of decreased utilization. Clinical decision support alerts and reminders can decrease utili-zation by reducing adverse drug events, offering alterna-tives to expensive medications, and reducing the use of laboratory and radiology tests (37–39,41–44). The expert panel consensus was that adverse drug events would be reduced by approximately 34% (range, 10% to 70%) as a result of basic medication decision support. We used standardfinancial benchmarks (33–35) to assign baseline costs for adverse drug events, which took into account additional outpatient visits, prescriptions, and admis-sions due to adverse drug events (36).
The expert panel estimated that alternative drug sug-gestion reminders would save 15% (range, 5% to 25%) of total drug costs per year, and this was applied to the base-line annual drug expenditures for the capitated patients in the panel. We estimated that laboratory charges could be reduced by 8.8% (range, 0 to 13%) using decision sup-port (37–39). Based on information from other studies, the expert panel estimated that decision support for radi-ology ordering would achieve average savings of 14% (range, 5% to 20%).
Benefits under fee-for-service reimbursement in-cluded increased revenue and reduced losses.
Computer-izing the encounter form process can improve the cap-ture of in-office procedures that were performed but not documented. Based on other studies (25,40), we pro-jected a 2% improvement in billing capture (range, 1.5% to 5%). By using an electronic medical record system that either supplies or prompts for certain requiredfields, bill-ing error losses can be reduced. The expert panel esti-mated that computerizing the encounter form could de-crease these errors by 78% (range, 35% to 95%).
Statistical Analysis
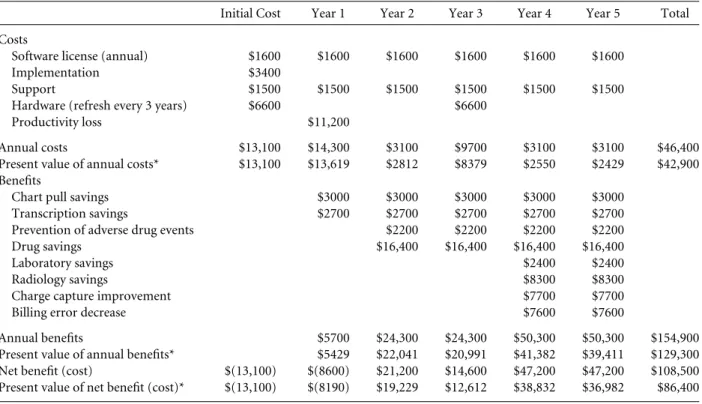
We assumed that initial costs would be paid at the begin-ning of year 1 and that benefits would accrue at the end of each year (Table 3). We assumed a phased implementa-tion, in which only basic electronic medical record fea-tures were available in thefirst years (e.g., medication-related decision support), and more advanced features were added in subsequent years (e.g., laboratory, radiol-ogy, and billing benefits). The primary outcome measure was net benefit or cost per primary care provider. A dis-count rate of 5% was used in the base case and varied from 0% to 10% in the sensitivity analysis.
One-way and two-way sensitivity analyses were per-formed using the ranges shown in Tables 1 and 2. Two-way sensitivity analyses were performed using all combi-nations of thefive most important variables identified in the one-way sensitivity analysis, and with pairwise com-binations of one benefit variable with each of the three primary cost variables (software, hardware, and support). Afive-way sensitivity analysis was performed using the most and least favorable conditions for thefive variables. The time horizon was also varied from 2 to 10 years.
Table 2. Annual Expenditures Per Provider (in 2002 U.S. Dollars) before Electronic Medical Record System Implementation and Expected Savings after Implementation
Annual Expenditures before
Implementation Expected Savings after Implementation Amount Reference Base Case Estimated Savings Sensitivity Analysis (Range) Reference Payer independent
Chart pulls $5 (per chart) * 600 charts 300–1200 * Transcription $9600 * 28% 20%–100% *,32 Capitated patients
Adverse drug events $6500 33–36 34% 10%–70% ‡ Drug utilization $109,000 † 15% 5%–25% ‡ Laboratory utilization $27,600 † 8.8% 0–13% 37–39 Radiology utilization $59,100 † 14% 5%–20% ‡ Fee-for-service patients
Charge capture $383,100 † 2% (increase) 1.5%–5% 25,40
Billing errors $9700 † 78% 35%–95% ‡
* Primary data from the Partners HealthCare Electronic Medical Record System, Boston, Massachusetts.
†From the Department of Finance, Brigham and Women
’s Hospital, Partners HealthCare System.
‡Expert panel consensus.
To account for variations in functionality among dif-ferent systems, we constructed two additional models in which only subsets of the full functionality were included (Table 4). The“light” electronic medical record system included savings from chart pulls and transcriptions only, whereas the“medium”system also included
bene-fits from electronic prescribing (adverse drug event pre-vention and drug expenditure savings).
RESULTS
In the 5-year cost-benefit model (Table 3), the net benefit of implementing a full electronic medical record system was $86,400 per provider. Of this amount, savings in drug
expenditures made up the largest proportion of the ben-efits (33% of the total). Of the remaining categories, al-most half of the total savings came from decreased radi-ology utilization (17%), decreased billing errors (15%), and improvements in charge capture (15%).
Sensitivity Analyses
The model was most sensitive to variations in the propor-tion of patients in capitated health plans; the net benefit varied from $8400 to $140,100 (Figure). The model was least sensitive to variations in laboratory savings, in which the net benefit ranged from $82,500 to $88,300.
In two-way sensitivity analyses, the pair of input vari-ables that yielded the least favorable outcome was a low proportion of capitated patients and a high discount rate;
Table 3. 5-Year Return on Investment Per Provider for Electronic Medical Record Implementation
Initial Cost Year 1 Year 2 Year 3 Year 4 Year 5 Total Costs
Software license (annual) $1600 $1600 $1600 $1600 $1600 $1600 Implementation $3400
Support $1500 $1500 $1500 $1500 $1500 $1500 Hardware (refresh every 3 years) $6600 $6600
Productivity loss $11,200
Annual costs $13,100 $14,300 $3100 $9700 $3100 $3100 $46,400 Present value of annual costs* $13,100 $13,619 $2812 $8379 $2550 $2429 $42,900 Benefits
Chart pull savings $3000 $3000 $3000 $3000 $3000 Transcription savings $2700 $2700 $2700 $2700 $2700 Prevention of adverse drug events $2200 $2200 $2200 $2200 Drug savings $16,400 $16,400 $16,400 $16,400
Laboratory savings $2400 $2400
Radiology savings $8300 $8300
Charge capture improvement $7700 $7700
Billing error decrease $7600 $7600
Annual benefits $5700 $24,300 $24,300 $50,300 $50,300 $154,900 Present value of annual benefits* $5429 $22,041 $20,991 $41,382 $39,411 $129,300 Net benefit (cost) $(13,100) $(8600) $21,200 $14,600 $47,200 $47,200 $108,500 Present value of net benefit (cost)* $(13,100) $(8190) $19,229 $12,612 $38,832 $36,982 $86,400 * Assumes a 5% discount rate.
Table 4. Effect of Electronic Medical Record Feature Set Variations on Net Benefits
Feature Benefit Light EMR Medium EMR Full EMR Online patient charts Chart pull savings 1 1 1
Transcription savings 1 1 1
Electronic prescribing Adverse drug event prevention 1 1
Alternative drug suggestions 1 1
Laboratory order entry Appropriate testing guidance 1
Radiology order entry Appropriate testing guidance 1
Electronic charge capture Increased billing capture 1
Decreased billing errors 1
Net benefits (costs): ($18,200) $44,600 $86,400 EMR5Electronic Medical Record.
the net benefit range was as low as $3000 per provider. The pair that had the most favorable outcome was a high proportion of capitated patients and greater savings from drug suggestions; the net benefit was as high as $202,200 per provider. For the two-way sensitivity analyses per-formed with the three primary cost variables, the pair of variables that yielded the least favorable outcome was a low proportion of capitated patients and a high annual software license (net cost of $200 per provider), and the pair with the most favorable outcome was a high propor-tion of capitated patients and a low hardware cost (net benefit of $146,200 per provider).
In thefive-way sensitivity analyses, when the most pes-simistic assumptions were made, the model showed a net cost of $2300 per provider. When the most optimistic assumptions were used, this analysis yielded a net benefit of $330,900 per provider.
When the time horizon was reduced to 2 years instead of 5 years, the net cost was $2100 per provider, and when the time horizon was lengthened to 10 years, the net ben-efit was $237,300 per provider.
For the“light”electronic medical record, in which the system is used only to reduce paper chart pulls and tran-scription costs, the net cost was $18,200 per provider (Ta-ble 4). For the“medium”electronic medical record, in which benefits from electronic prescribing are added, the net benefit was $44,600 per provider.
DISCUSSION
Our analysis indicates that the netfinancial return to a health care organization from using an ambulatory elec-tronic medical record system is positive across a wide
range of assumptions. The primary areas of benefit are from reductions in drug expenditures, improved utiliza-tion of radiology tests, improvements in charge capture, and decreased billing errors. Benefits increase as more features are used and as the time horizon is lengthened. In sensitivity analyses, the net return was positive except when the most pessimistic assumptions were used.
Savings to the health care organization are obtained under both capitated and fee-for-service reimbursement, but these savings depend on the reimbursement mix: the greater the proportion of capitated patients, the greater the total return. Among fee-for-service patients, a large portion of the savings from improved utilization may ac-crue to the payer instead of the provider organization. As a result, payers may be motivated to offer incentives to providers to use an electronic medical record to help con-trol costs. In addition, although full capitation appears to be less prevalent now than several years ago, with the continued rise in health care expenditures, other types of risk-sharing arrangements are likely to become more common in the future (45), such as partial capitation, risk pools, and pharmacy withholds.
We used conservative estimates of cost savings from an electronic medical record. For example, one clinic was able to reduce chart pulls by 60% to 70% and its medical records staff by 50%, for an annual savings of about $4000 per provider (15). Others have identified even larger sav-ings from the use of drug suggestions for certain classes of medications (46). In one outpatient clinic, display of for-mulary information at the time of ordering lowered drug costs by up to 26% (M. Overhage, MD, Regenstrief Insti-tute, Indianapolis, Indiana, written communication, 2001). Savings due to prevention of adverse drug events
Figure. Tornado diagram showing the one-way sensitivity analysis of net 5-year benefits per provider. Each bar depicts the overall effect on net benefits as that input is varied across the indicated range of values, while other input variables are held constant. The vertical line indicates the base case.
in the model did not include costs of malpractice settle-ments, injury to patients, or decreased quality of life for patients, so the actual savings may be higher. We may have also underestimated future cost savings because the model did not account for the annual growth rate of ex-penditures, which may outpace inflation in some catego-ries, such as in drug and radiology costs.
Other potential areas of savings were not included in the model because adequate data were not available. These include savings in malpractice premium costs (40), storage and supply costs (47), generic drug substitutions (48), increased provider productivity (19,23,24), de-creased staffing requirements (23,24,49), increased reim-bursement from more accurate evaluation and manage-ment coding, and decreased claims denials from inade-quate medical necessity documentation.
Although we accounted for a temporary (3-month) loss of productivity in our model, some providers may have a longer period of reduced productivity. To measure this effect, we performed a sensitivity analysis that in-cluded a prolonged 10% productivity loss for 12 months and found that there was still a 5-year net benefit of $57,500 per provider.
This study has several limitations. The cost-benefit model was based on primary data from our institution, estimates from published literature, and expert opinion. The effectiveness of some of these interventions has been demonstrated in the inpatient setting, but outpatient ef-fectiveness is less certain. There may be other costs asso-ciated with implementation of an electronic medical record. For example, system integration costs may be greater at other institutions, depending on the number and complexity of system interfaces that are required. However, the majority of benefits in this model can be obtained even with a minimal number of interfaces (i.e., registration, scheduling, and transcription). In addition, there may be other unforeseen expenses associated with clinic workflow process redesign, reassignment of clinic staff, or productivity loss during unscheduled computer system or network outages.
In most cases, clinical decision support features will decrease utilization by suggesting more appropriate test-ing. This leads to cost savings among capitated patients, but it could also have an adverse effect on revenues from fee-for-service patients that may offset billing improve-ments. The overall net effect would depend on the mix of capitated versus fee-for-service patients.
Our cost-benefit model was geared toward primary care providers. Diagnostic test utilization may be higher for specialists, so there may be more opportunities for cost-saving interventions. On the other hand, specialists may be less likely to comply with computer reminders recommending alternative medications or tests.
This study was framed from the perspective of the health care organization to aid in making decisions about
implementation of an electronic medical record. It may also be worthwhile to take the societal perspective, which would include benefits to payers and patients. For exam-ple, despite the trend away from global risk capitation, payers are moving toward patient cost-sharing ap-proaches, such as differential co-payments, high deduct-ible options, and health savings accounts. With these types of arrangements, patients may prefer to seek care with providers who use electronic medical records to control costs and improve quality of care.
Not all benefits of an electronic medical record are measurable infinancial terms; other benefits include im-proved quality of care, reduced medical errors, and better access to information (2,3,50–54). A cost-benefit analysis is only one part of a complete analysis of the effects of implementing an electronic medical record system. At our institution, the electronic medical record is a key component of a strategic goal of clinical system integra-tion to allow providers to move between sites in the net-work to deliver seamless care at the most appropriate pri-mary, secondary, or tertiary care location.
Based on a combination of savings data from our in-stitution and projections from other published studies, we conclude that implementing an ambulatory electronic medical record system can yield a positive return on in-vestment to health care organizations. The magnitude and timing of thisfinancial return varies, but is positive in the long run across a wide range of assumptions. Because of their quality and cost benefits, electronic medical records should be used in primary care, and incentives to accelerate their adoption should be considered at the na-tional level.
ACKNOWLEDGMENT
We would like to thank Marc Overhage, MD, Homer Chin, MD, Barry Blumenfeld, MD, and Tejal Gandhi, MD, who joined three of the coinvestigators to serve on our expert panel.
REFERENCES
1. Elson RB, Connelly DP. Computerized patient records in primary care. Their role in mediating guideline-driven physician behavior change.Arch Fam Med.1995;4:698–705.
2. Shea S, DuMouchel W, Bahamonde L. A meta-analysis of 16 ran-domized controlled trials to evaluate computer-based clinical re-minder systems for preventive care in the ambulatory setting.J Am Med Inform Assoc.1996;3:399–409.
3. Hunt DL, Haynes RB, Hanna SE, et al. Effects of computer-based clinical decision support systems on physician performance and patient outcomes: a systematic review. JAMA. 1998;280:1339–
1346.
4. Bates DW. Medication errors. How common are they and what can be done to prevent them?Drug Saf.1996;15:303–310.
5. Institute of Medicine Committee on Quality of Health Care in America.Crossing the Quality Chasm: A New Health System for the 21st Century.Washington, DC: National Academy Press; 2001.
6. The Leapfrog Group for Patient Safety; Rewarding Higher Stan-dards. Available at: http://www.leapfroggroup.org. Accessed April 23, 2002.
7. Heard S, Grivel T, Schloeffel P, Doust J. The benefits and difficulties of introducing a national approach to electronic health records in Australia. Available at: http://www.health.gov.au/healthonline/ ehr_apxb.pdf. Accessed May 6, 2002.
8. Jones N. Telematics systems in primary care. Available at: http:// www.eihms.surrey.ac.uk/abbott/IT-EDUCTRA/html/p415_h.htm. Accessed April 23, 2002.
9. The Royal College of General Practitioners—information sheet, general practice computerisation. Available at: http://www.rcgp. org.uk/rcgp/information/publications/information/rcf0007/Rcf0007. asp. Accessed April 23, 2002.
10. Taking the Pulse: Physicians and the Internet. New York: Deloitte & Touche; 2000.
11. Hammond KW, Prather RJ, Date VV, et al. A provider-interactive medical record system can favorably influence costs and quality of medical care.Comput Biol Med.1990;20:267–279.
12. Rawitz JG, Cowan WY, Paige BM. Justifying costs of computer software purchases.Healthc Financ Manage.1990;44:46–51. 13. Davis MW. Reaping the benefits of electronic medical record
sys-tems.Healthc Financ Manage.1993;47:60–62.
14. Renner K. Electronic medical records in the outpatient setting (part 1).Med Group Manage J.1996;43:52–5754,56.
15. Renner K. Electronic medical records in the outpatient setting (part 2).Med Group Manage J.1996;43:60–65.
16. Pliskin N, Glezerman M, Modai I, et al. Spreadsheet evaluation of computerized medical records: the impact on quality, time, and money.J Med Syst.1996;20:85–100.
17. Khoury A. Finding value in EMRs (electronic medical records).
Health Manag Technol.1997;18:34–36.
18. Mohr DN. Benefits of an electronic clinical information system.
Healthc Inf Manage.1997;11:49–57.
19. Bingham A. Computerized patient records benefit physician
of-fices.Healthc Financ Manage.1997;51:68–70.
20. Nelson R. Computerized patient records improve practice effi -ciency and patient care.Healthc Financ Manage.1998;52:86–88. 21. Sandrick K. Calculating ROI for CPRs.Health Manag Technol.
1998;19:16–20.
22. Didear K, Kalata M. CPR success stories.J AHIMA.1998;69:54–57. 23. Zdon L, Middleton B. Ambulatory electronic medical records im-plementation cost benefit: An enterprise case study.Healthc Inform Manage and Syst Soc.1999;4:97–117.
24. Ury A. The business case for an electronic medical record system.
Group Pract J.2000;49:1–6.
25. Pifer EA, Smith S, Keever GW. EMR to the rescue. An ambulatory care pilot project shows that data sharing equals cost shaving.
Healthc Inform.2001;18:111–114.
26. Mildon J, Cohen T. Drivers in the electronic medical records mar-ket.Health Manag Technol.2001;22:14–1618.
27. Gross domestic product deflator inflation calculator. Available at: http://www.jsc.nasa.gov/bu2/inflateGDP.html. Accessed October 5, 2002.
28. Snyder-Halpern R, Thompson CB, Schaffer J. Comparison of mailed vs. Internet applications of the Delphi technique in clinical informatics research.Proc AMIA Symp.2000:809–813.
29. Spurr CD, Wang SJ, Kuperman GJ, et al. Confirming and delivering the benefits of an ambulatory electronic medical record for an integrated delivery system. TEPR 2001 Conference Proceedings.
Newton, Massachusetts: Medical Records Institute; 2001. 30. The Competitive Edge: HMO Industry Report 10.2. St. Paul, MN:
Interstudy Publications; 2000.
31. United States Census 2000.Ranking Tables for States. Population in 2000 and Population Change from 1990 to 2000 (PHC-T-2). Wash-ington, DC: U.S. Census Bureau; 2000.
32. Ambulatory EMR. Establishing a business case. Available at: http:// www.medicalogic.com/emr/business_benefits/index.html. Accessed April 20, 2002.
33. Medicare RBRVS Physician Fee Schedule 2002. Washington, DC: Centers for Medicare and Medicaid Services; 2001.
34. Prescription Drug Expenditures in 2001. Washington, DC: National Institute for Health Care Management; 2002.
35. Jha AK, Kuperman GJ, Rittenberg E, et al. Identifying hospital ad-missions due to adverse drug events using a computer-based mon-itor.Pharmacoepidemiol Drug Saf.2001;10:113–119.
36. Honigman B, Lee J, Rothschild J, et al. Using computerized data to identify adverse drug events in outpatients.J Am Med Inform Assoc.
2001;8:254–266.
37. Tierney WM, Miller ME, McDonald CJ. The effect on test ordering of informing physicians of the charges for outpatient diagnostic tests.N Engl J Med.1990;322:1499–1504.
38. Tierney WM, McDonald CJ, Martin DK, et al. Computerized dis-play of past test results. Effect on outpatient testing.Ann Intern Med.1987;107:569–574.
39. Tierney WM, McDonald CJ, Hui SL, et al. Computer predictions of abnormal test results. Effects on outpatient testing.JAMA.1988; 259:1194–1198.
40. Renner K. Cost-justifying electronic medical records.Healthc Fi-nanc Manage.1996;50:63–64.
41. Bates DW, Boyle DL, Rittenberg E, et al. What proportion of com-mon diagnostic tests appear redundant?Am J Med.1998;104:361–
368.
42. Bates DW, Kuperman GJ, Rittenberg E, et al. A randomized trial of a computer-based intervention to reduce utilization of redundant laboratory tests.Am J Med.1999;106:144–150.
43. Harpole LH, Khorasani R, Fiskio J, et al. Automated evidence-based critiquing of orders for abdominal radiographs: impact on utiliza-tion and appropriateness.J Am Med Inform Assoc.1997;4:511–521. 44. Rothschild JM, Khorasani R, Bates DW. Guidelines and decision support help improve image utilization.Diagn Imaging.2000;22: 95–9799,101.
45. Reinhardt UE. Reforming American healthcare: an interim report.
J Rheumatol.1999;26(suppl):6–10.
46. Jones DL, Kroenke K, Landry FJ, et al. Cost savings using a stepped-care prescribing protocol for nonsteroidal anti-inflammatory drugs.JAMA.1996;275:926–930.
47. Evans JC, Hayashi AM. Implementing on-line medical records.Doc Manage.1994;Sep/Oct:12–17.
48. The quantum experience: a case study from Ernst & Young. Available at: http://www.allscripts.com/ahcs/news_2.asp?S5 2000&ID52. Accessed April 10, 2002.
49. Kian LA, Stewart MW, Bagby C, et al. Justifying the cost of a com-puter-based patient record.Healthc Financ Manage.1995;49:58–
60.
50. Essex D. Skip the song & dance.Healthc Inform.1999;16:49–52 54,56.
51. Balas EA, Weingarten S, Garb CT, et al. Improving preventive care by prompting physicians.Arch Intern Med.2000;160:301–308. 52. Bates DW, Teich JM, Lee J, et al. The impact of computerized
phy-sician order entry on medication error prevention.J Am Med In-form Assoc.1999;6:313–321.
53. McDonald CJ, Hui SL, Smith DM, et al. Reminders to physicians from an introspective computer medical record. A two-year ran-domized trial.Ann Intern Med.1984;100:130–138.
54. McDonald CJ, Overhage JM, Tierney WM, et al. The Regenstrief Medical Record System: a quarter century experience.Int J Med Inf.
1999;54:225–253.