C
a r d i f f
U N I V E R S I T Y P R I F Y S G O L
C
ae
RD
y
S>
N ature-inspired O ptim isation: Im provem ents to the
Particle Swarm O ptim isation A lgorithm and the Bees
Algorithm
A thesis su b m itted to C ard iff U niversity,
for the degree o f
D octor o f Philosophy
By
M ichael O. Sholedolu,
B.Sc., M.Sc.C a r d iff S ch ool o f E ngineering
M an u factu rin g E ngineering C entre
C a r d iff U niversity
U nited K ingdom
UMI Number: U585402
All rights reserved
INFORMATION TO ALL USERS
The quality of this reproduction is dependent upon the quality of the copy submitted.
In the unlikely event that the author did not send a complete manuscript and there are missing pages, these will be noted. Also, if material had to be removed,
a note will indicate the deletion.
Dissertation Publishing
UMI U585402
Published by ProQuest LLC 2013. Copyright in the Dissertation held by the Author. Microform Edition © ProQuest LLC.
All rights reserved. This work is protected against unauthorized copying under Title 17, United States Code.
ProQuest LLC
789 East Eisenhower Parkway P.O. Box 1346
DECLARATION
This work has not previously been accepted in substance for any degree and is not being concurrently submitted in candidature for any degree.
Signed... (Michael Sholedolu-Candidate)
...
STATEM ENT 1
This thesis is the result of my own investigations, except where otherwise stated. Other sources are acknowledged by footnotes giving explicit references. A bibliography is appended.
Signed... (Michael Sholedolu-Candidate)
Date...
STATEM ENT 2
I hereby give consent for my thesis, if accepted, to be available for photocopying and for inter-library loan, and for the title and summary to be made available to outside organisations.
Signed... (Michael Sholedolu-Candidate)
Abstract
This research focuses on nature-inspired optimisation algorithms, in particular, the Particle Swarm Optimisation (PSO) Algorithm and the Bees Algorithm. The PSO Algorithm is a population-based stochastic optimisation technique first invented in 1995. It was inspired by the social behaviour o f birds flocking or a school o f fish. The Bees Algorithm is a population-based search algorithm initially proposed in 2005. It mimics the food foraging behaviour o f swarms o f honey bees.
The thesis presents three algorithms. The first algorithm called the PSO-Bees Algorithm is a cross between the PSO Algorithm and the Bees Algorithm. The PSO-Bees Algorithm enhanced the PSO Algorithm with techniques derived from the Bees Algorithm. The
second algorithm called the improved Bees Algorithm is a version of the Bees Algorithm
that incorporates techniques derived from the PSO Algorithm. The third algorithm called the SNTO-Bees Algorithm enhanced the Bees Algorithm using techniques derived from the Sequential Number-Theoretic Optimisation (SNTO) Algorithm.
To demonstrate the capability o f the proposed algorithms, they were applied to different optimisation problems. The PSO-Bees Algorithm is used to train neural networks for two problems, Control Chart Pattern Recognition and Wood Defect Classification. The results obtained and those from tests on well known benchmark functions provide an indication o f the performance o f the algorithm relative to that o f other swarm-based stochastic optimisation algorithms.
The improved Bees Algorithm was applied to mechanical design optimisation problems (design o f welded beams and coil springs) and the mathematical benchmark problems used previously to test the PSO-Bees Algorithm. The algorithm incorporates cooperation and communication between different neighbourhoods. The results obtained show that the proposed cooperation and communication strategies adopted enhanced the performance and convergence o f the algorithm.
The SNTO-Bees Algorithm was applied to a set of mechanical design optimisation problems (design o f welded beams, coil springs and pressure vessel) and mathematical
benchmark functions used previously to test the PSO-Bees Algorithm and the improved
Bees Algorithm. In addition, the algorithm was tested with a number of deceptive multi modal benchmark functions. The results obtained help to validate the SNTO-Bees Algorithm as an effective global optimiser capable o f handling problems that are deceptive in nature with high dimensions.
Acknowledgement
As a devoted Christian, I would like to thank Jehovah Lord God o f Host for His Mercy, Grace, Protection, Guidance and Favour in abundance (despite all difficulties) from the very moment I came out o f my mother’s womb unto this present day and for listening & answering my prayers.
The Biography o f my life will not be complete without Professor Due Truong Pham. I am
GREATLY indebted to my supervisor, Professor Due Truong Pham for many things. I thank him for accepting me to be one o f his students at the Manufacturing Engineering Centre (MEC) in Cardiff University; for his suggestion o f this research area to work on (from Robotics to Optimisation), and for his numerous contributions and direct supervision. I would also like to thank him for his continual and invaluable suggestions, insight, motivation and support throughout this research. I owe special thanks to Prof. D.
T. Pham for carefully reading and correcting the draft manuscripts o f this thesis. M ost
important o f all, for being a father to me is PRICELESS and I really do not know what words to use to express my profound GRATITUDE and APPRECIATION. Special recognition to Mrs. Paulette Pham and Kim Pham for their kindheartedness.
I would like to thank Celia Rees (Mam) for her motherly love and support throughout my research work especially the many reminder emails. I also want to thank Dr. R.I. Grosvenor and Mr. Paul Prickett for giving me the references used in pursuit o f this PhD research. Special thanks to Dr. Michael S. Packianather & Dr. Eldaw Eldukhri for their help and contributions at the CIRP ICME ’06 conference in Ischia, Italy; the members
and staff of the MEC, the Cardiff Bay Bees research group, the MEC Robotics research group, my colleagues whom has contributed in one way or another. Special thanks again to the MEC for the high quality scientific ambiance and equipment they provided throughout my research work especially when I was building my team o f flying robots for which I almost ended up flying myself as a replacement for the robots (laugh).
Furthermore, I would also like to thank Dr. Jan Beutler for his assistance; Ms. Pauline
Richards for her love, sincerity and understanding; Mrs. Lynn Murrell & David Harrison o f INSRV for their understanding when I urgently had to leave temporarily with short notice; Mrs. Rhian Williams for her assistance and the IT Administrators in the MEC for maintaining the computer system used throughout my research work.
I want to thank and acknowledge the contributions of the following people: Professor Andries P. Engelbrecht, the author o f “Fundamentals o f Computational Swarm Intelligence” and John Wiley & Sons, Ltd; Thomas Weise, the author o f “Global Optimisation Algorithms - Theory and Applications”; Karin Zielinski and Rainer Laur, the authors o f the Paper titled “Stopping Criteria for a Constrained Single-Objective Particle Swarm Optimisation Algorithm” and finally; Yamille del Valle, Ganesh Kumar Venayagamoorthy, Salman Mohagheghi, Jean-Carlos Hernandez and Ronald G. Harley, the authors o f the Paper titled “Particle Swarm Optimisation: Basic Concepts, Variants and Applications in Power Systems” and the Institute of Electrical and Electronic Engineers, Inc (IEEE).
Last but not least, I would like to express deep gratitude and admiration to my parents Overseer & Deaconess H. A. Sholedolu for their prayers, love, support and care - I hold
Kindness is a language which the d e a f can hear and the blind can read.
—Mark TwainWithout the kindness I received, this research
work would not have been possible.
Table of Contents
D eclaration... i D edication... ii A b stract... iii Acknowledgem ent... v Table o f C ontents... ix List o f Figures... xv List o f T a b le s... xxC hapter 1: In tro d u ctio n ... 1
1.1 M otivation... 1
1.2 Aim and O bjectives... 4
1.3 M ethodology... 6
1.4 Thesis o u tlin e ... 8
C hapter 2: Background - Literature R e v ie w ... 10
2.1 O ptim isation... 10
2.1.1 Optimisation Problem C lassification... 14
2.1.2 Optimality C on d itio n s... 15
2.1.2.1 Local Optimisation (L O )... 15
2.1.2.2 Global Optimisation (G O )... 17
2.1.3 Problems in O ptim isation... 17
2.1.3.2 Ruggedness and Weak C ausality... 22
2.1.3.3 D eceptiveness... 23
2.1.3.4 Neutrality and R edundancy... 24
2.1.3.5 E p istasis... 27
2.1.3.6 Overfitting and Oversimplification... 28
2.1.3.7 Robustness and N o ise ... 32
2.1.3.8 Dynamically Changing Fitness Landscape... 33
2.1.3.9 No Free Lunch T heorem ... 34
2.2 The Bees Algorithm (B A )... 34
2.3 Particle Swarm Optimisation (P S O )... 41
2.3.1 Particle Swarm Optimisation vs. Evolutionary Com putation 48 2.3.1.1 Search P ro ce ss... 49 2.3.1.2 R epresentation... 50 2.3.1.3 Fitness F un ctio n... 51 2.3.1.4 R ecom bination... 51 2.3.1.5 M utation... 52 2.3.1.6 S electio n ... 52 2.4 Sum m ary... 54
C hapter 3: PSO-Bees A lg o r ith m ... 56
3.1 PSO-Bees A lgorithm ... 56
3.2 Operation o f the PSO-Bees A lgorithm ... 61
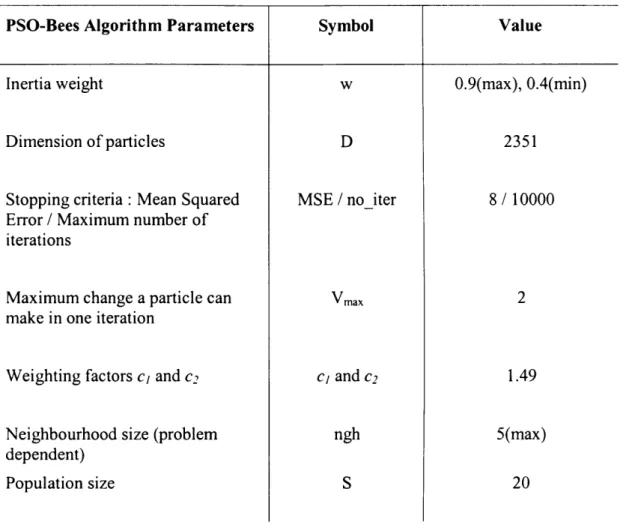
3.3.1 Velocity C lam p in g... 65 3.3.2 Inertia W eig h t... 67 3.3.3 Constriction C oefficient... 68 3.3.4 Swarm S iz e ... 70 3.3.5 Neighbourhood S iz e ... 71 3.3.6 Number o f Iteratio n... 71 3.3.7 Acceleration C o efficien t... 72
3.4 PSO / PSO-Bees Stopping C rite ria ... 72
3.5 Performance M easures... 76 3.5.1 A ccuracy... 76 3.5.2 R eliability... 77 3.5.3 R obustness... 77 3.5.4 Efficiency... 78 3.5.5 D iversity... 78 3.5.6 C oherence... 79 3.6 R esu lts... 80
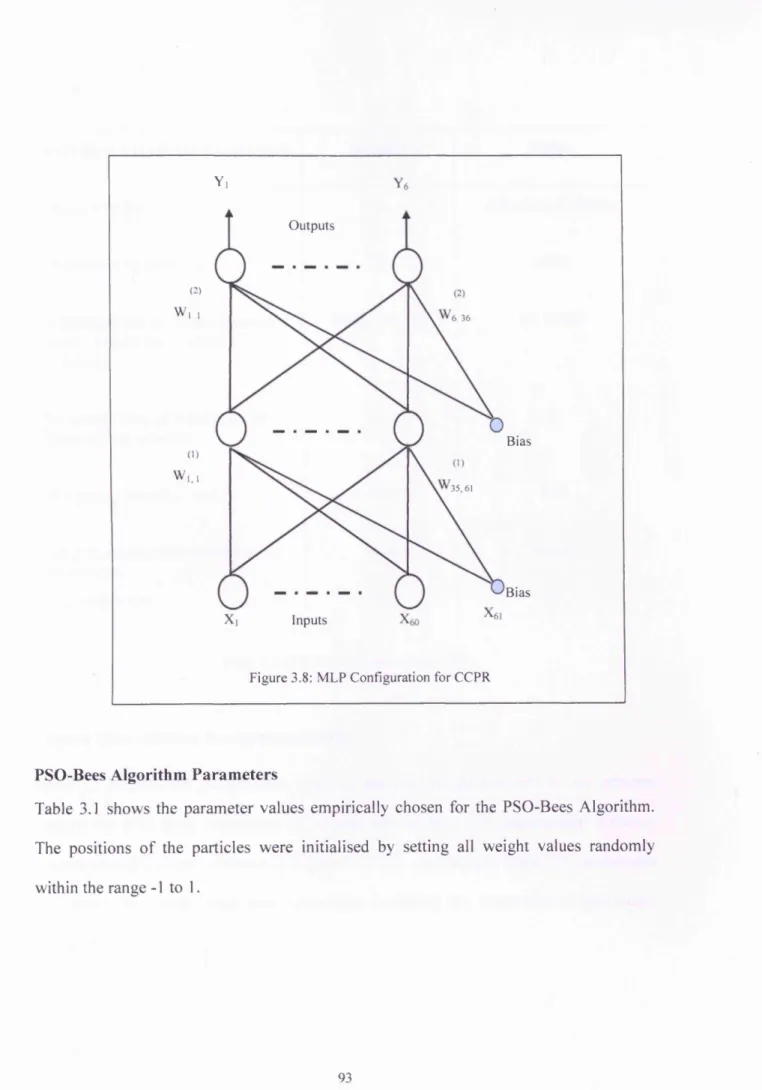
3.6.1 Neural Network T rain in g ... 80
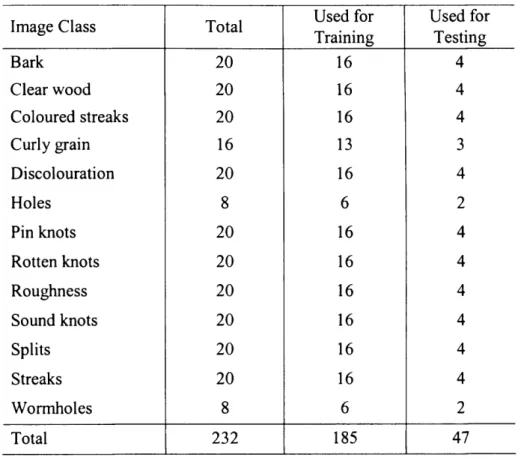
3.6.2 Application to Control Chart Pattern Recognition P ro blem 86 3.6.3 Application to Wood Defect Classification Problem ... 102
3.6.4 Tests on Benchmark Functions / Comparison with Other Global Optimisation A lgorithm s... I l l 3.7 Sum m ary... 116
Chapter 4: Im proving the Bees A lgorithm with the Particle Swarm
Optimisation A lgorithm - Im proved Bees A lg o rith m ... 118
4.1 The improved Bees A lgorithm ... 118
4.2 Operation o f the improved Bees A lgorithm ... 123
4.3 R esu lts... 128
4.3.1 Application to Mechanical Design Optimisation - Welded Beam Design P ro b lem ... 129
4.3.2 Application to Multi-Objective Optimisation - Welded Beam Design P rob lem ... 140
4.3.3 Application to Mechanical Design Optimisation - Coiled Spring P ro b lem ... 146
4.3.4 Tests on Mathematical Benchmark Functions / Comparison with Other Global Optimisation A lgorithm s... 155
4.4 Sum m ary... 158
Chapter 5: Novel SNTO -Bees A lg o r ith m ... 160
5.1 Pream ble... 161
5.2 Sequential Number-Theoretic Optimisation (SNTO) A lgorithm ... 164
5.3 Sequential Number-Theoretic Optimisation (SNTO)-Bees A lgorithm 166 5.4 R esults... 170
5.4.1 Application to Mechanical Design Optimisation - Welded Beam Design P ro b lem ... 171
5.4.2 Application to Multi-Objective Optimisation - Welded Beam
Design P ro b lem ... 175
5.4.3 Application to Mechanical Design Optimisation - Coiled Spring P rob lem ... 176
5.4.4 Application to Mechanical Design Optimisation - Design o f a Pressure Vessel P ro b lem ... 181
5.4.5 Application to Multi-modal Deceptive functions (MCastellani 1 - 1 0 ) ... 183
5.4.6 Application to Mathematical Benchmark Problem s... 187
5.4 Sum m ary... 190 C hapter 6: C o n c lu sio n ... 192 6.1 C ontributions... 192 6.2 C onclusions... 193 6.3 Further W o rk ... 196 B ib liograp h y ... 198 A p p en d ices... 217 Appendix A - G lossary... 218 Appendix B - Definition of S y m b o ls... 231 Appendix C - A bbreviations... 239
Appendix E - Function Landscapes... 252
Appendix F - Routine for glp s e t ... 273
Appendix G - Modifications to the PSO A lgorithm ... 274
List of Figures
Figure 2.1: The Optimisation P ro ce ss... 11
Figure 2.2: Types o f Optima for Unconstrained problem s... 16
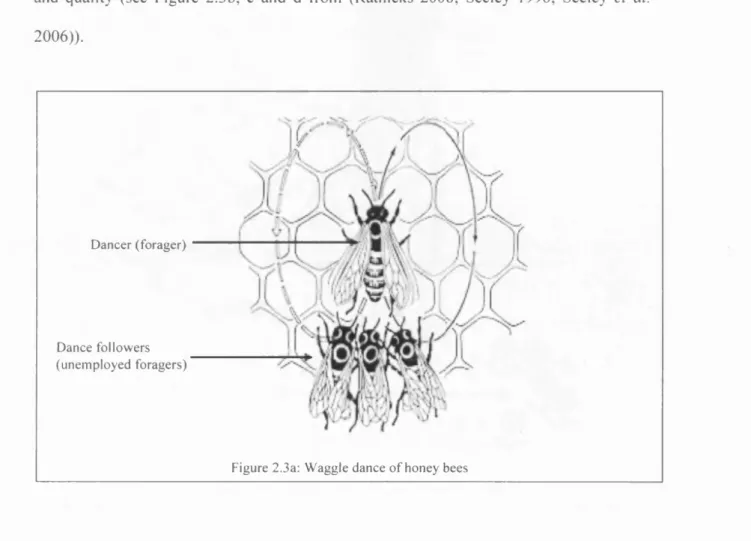
Figure 2.3a: Waggle dance o f honey b e e s ... 35
Figure 2.3b: Waggle dance - angle o f dancing bee to v ertical... 36
Figure 2.3c: Waggle dance - angle o f flowers to S u n ... 36
Figure 2.3d: Waggle dance duration encodes distance... 37
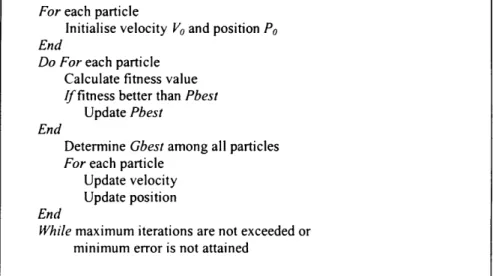
Figure 2.4: Pseudo code o f the basic Bees A lgorithm ... 40
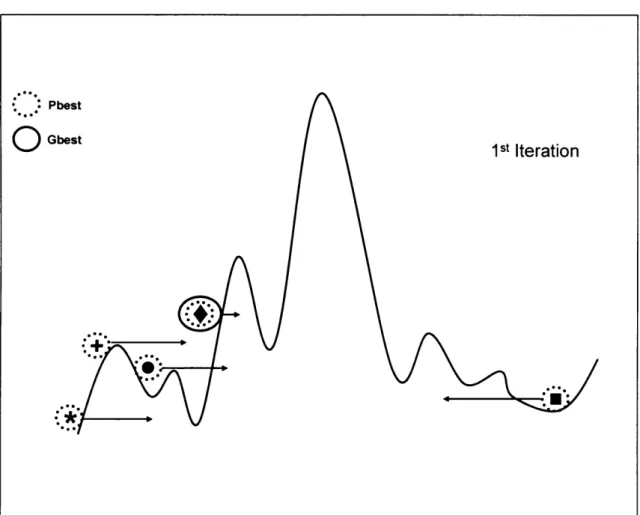
Figure 2.5: Pseudo code o f the Particle Swarm Optimisation A lgorithm 44 Figure 2.6: An example o f the operations o f the PSO A lgorithm ... 46
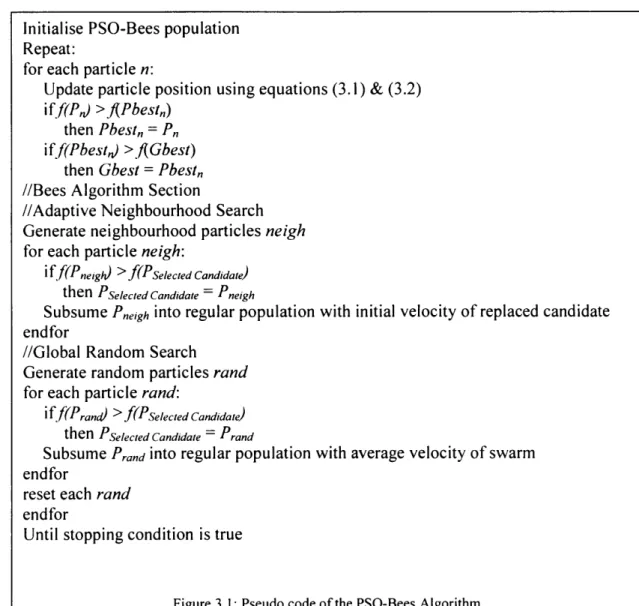
Figure 3.1: Pseudo code o f the PSO-Bees A lgorithm ... 59
Figure 3.2: Operations o f the PSO-Bees A lgorithm ... 62
Figure 3.3: Process in and out o f Statistical C o n tro l... 87
Figure 3.4: Increasing and Decreasing T ren d s... 89
Figure 3.5: Upwards and Downward S h ifts... 89
Figure 3.6: Cyclic P a tte rn ... 89
Figure 3.7: Systematic P a tte rn ... 90
Figure 3.8: MLP Configuration for Control Chart Pattern R ecognition 93 Figure 3.9: A typical plot o f how accuracy evolves with train in g... 95
Figure 3.10: Idealised distributions for treated and comparison group post-test v a lu es... 98
Figure 3.12: Formula for the t-test and how the numerator and denominator
are related to the distributions... 100
Figure 3.13: Plot o f test accuracies obtained by the PSO-Bees Algorithm and the original Bees Algorithm for C C P R ... 102
Figure 3.14: Categories o f Veneer wood im ages... 103
Figure 3.15: MLP Configuration for Wood Defect Classification... 106
Figure 3.16: Plot of test accuracies obtained by the PSO-Bees Algorithm and the original Particle Swarm Optimisation Algorithm for WDC .... I l l Figure 4.1: Swarm o f B e e s ... 119
Figure 4.2: Swarm o f Bees (Zoomed i n ) ... 120
Figure 4.3: Swarm o f Bees (Zoomed in) with momentum equation attracted to the region o f best so lu tio n ... 122
Figure 4.4: Pseudo code o f the improved Bees A lgorithm ... 122
Figure 4.5: Operations o f the improved Bees A lgorithm ... 124
Figure 4.6: A Welded b e a m ... 130
Figure 4.7: Evolution o f lowest cost in each iteration... 134
Figure 4.8: Plot o f the minimum cost obtained by the improved Bees Algorithm and the original Bees Algorithm for welded beam design p ro b lem ... 139
Figure 4.9: Non-dominated solutions obtained using the improved Bees A lgorithm ... 144
Figure 4 .10a: Non-dominated solutions obtained using the novel Bees
A lgorithm s... 145
Figure 4.10b: Non-dominated solutions obtained using the two different versions o f the genetic algorithm s... 145
Figure 4.11: A coil sp rin g ... 147
Figure 4.12: Evolution o f the minimum mass in each iteratio n ... 151
Figure 4.13: Plot o f the minimum mass produced by the improved Bees Algorithm and the original Bees Algorithm for the design o f coil spring p ro b lem ... 154
Figure 5.1a: A random number distribution... 165
Figure 5.1b: An NT-net distribution... 165
Figure 5.2: Operation o f the SNTO technique... 166
Figure 5.3: Evolution o f lowest cost in each iteration... 173
Figure 5.4: Plot o f the minimum cost produced by the improved Bees Algorithm and the SNTO-Bees Algorithm for the welded beam design p ro b lem ... 175
Figure 5.5: Non-dominated solutions obtained using the SNTO-Bees A lgorithm ... 176
Figure 5.6: Evolution o f the minimum mass in each iteration ... 178
Figure 5.7: Plot o f the minimum mass produced by the improved Bees Algorithm and the SNTO-Bees Algorithm for the design o f coil spring p ro b lem ... 180
181 244 245 246 247 248 249 250 251 252 253 253 254 254 255 255 256 256 257 258 A Pressure Vessel
Graphical representation o f the Star neighbourhood topology... Graphical representation o f the Ring neighbourhood topology... Graphical representation o f the randomised Ring neighbourhood topology... Graphical representation o f the Wheel neighbourhood topology ... Graphical representation of the randomised Wheel topology... Graphical representation o f the four Clusters topology... Graphical representation o f the Von Neumann topology... Graphical representation o f the Pyramid topology...
Visualisation o f De Jong’s function... Visualisation o f Goldstein-Price function... Visualisation o f Branin function... Visualisation o f Martin & Gaddy function... Visualisation o f Rosenbrock - 1 function... Visualisation o f Griewangk function (definition area -500 to 500) Visualisation o f Griewangk function (inner area -50 to 5 0 ) ... Visualisation o f Griewangk function (area from -8 to 8 around the optimum at [0, 0 ] ) ... Visualisation o f Ackley fun ctio n... Visualisation o f Schwefel function... Visualisation o f MCastellani Test Function 1 ...
259 260 260 261 262 263 263 264 265 266 266 267 268 269 269 270 271 272 272 Contour plot o f MCastellani Test Function 1 ..
Visualisation o f MCastellani Test Function 2 . Contour plot o f MCastellani Test Function 2 .. Visualisation o f MCastellani Test Function 3 . Contour plot o f MCastellani Test Function 3 .. Visualisation o f MCastellani Test Function 4 . Contour plot o f MCastellani Test Function 4 Visualisation o f MCastellani Test Function 5 . Contour plot o f MCastellani Test Function 5 .. Visualisation o f MCastellani Test Function 6 . Contour plot o f MCastellani Test Function 6 .. Visualisation o f MCastellani Test Function 7 . Contour plot o f MCastellani Test Function 7 .. Visualisation o f MCastellani Test Function 8 . Contour plot o f MCastellani Test Function 8 .. Visualisation o f MCastellani Test Function 9 . Contour plot o f MCastellani Test Function 9 .. Visualisation o f MCastellani Test Function 10 Contour plot o f MCastellani Test Function 10
List of Tables
Table 3.1: PSO-Bees Parameters for the Control Chart Pattern Recognition (CCPR) 94
Table 3.2: Classification results obtained with PSO-Bees A lgorithm ... 95
Table 3.3: Results for different MLP pattern recognisers... 96
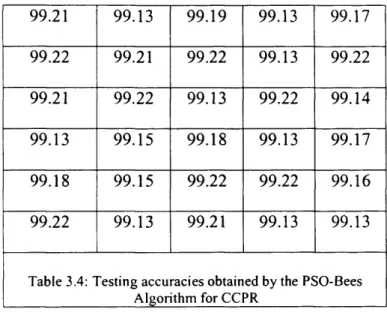
Table 3.4: Testing accuracies obtained by the PSO-Bees Algorithm for C C P R 101 Table 3.5: Testing accuracies obtained by the original Bees Algorithm for C C P R 101 Table 3.6: Training and test sets for Wood Defect Classification (W D C )... 107
Table 3.7: PSO-Bees Algorithm Parameters for Wood Defect C lassification... 108
Table 3.8: Results o f wood defect identification... 108
Table 3.9: Testing accuracies obtained by the PSO-Bees Algorithm for W DC 110 Table 3.10: Testing accuracies obtained by the original Particle Swarm Optimisation Algorithm for W D C ... 110
Table 3.11: Mathematical Benchmark Test Functions... 114
Table 3.12:. Results o f test functions... 115
Table 4.1: Properties o f constraints g\ to g g ... 132
Table 4.2: Parameters o f the improved Bees Algorithm for welded beam design p ro b lem ... 133
Table 4.3: Comparison of results o f the improved Bees Algorithm on welded beam design problem with other optim isers... 137
Table 4.4: Minimum cost obtained by the improved Bees Algorithm for the welded beam design p ro b lem ... 138
Table 4.5: Minimum cost obtained by the original Bees Algorithm for the welded
beam design p ro b lem ... 139
Table 4.6: Parameters o f the improved Bees Algorithm for multi-objective welded
beam design p ro b le m ... 143
Table 4.7: Notations used to formulate the problem o f designing the coil sp rin g 148
Table 4.8: Properties o f constraints... 149
Table 4.9: The improved Bees Algorithm param eters... 150
Table 4.10: Comparison o f the improved Bees Algorithm results with other optimisers 152
Table 4.11: Minimum mass produced by the improved Bees Algorithm for the design
o f coil spring p ro b le m ... 153 Table 4.12: Minimum mass produced by the original Bees Algorithm for the design o f
coil spring p ro b lem ... 154
Table 4.13: Mathematical Benchmark Test Functions... 156
Table 4.14: Results o f test functions... 157
Table 5.1: Pseudo code o f the SNTO-Bees A lgorithm ... 168
Table 5.2: Comparison o f results o f the SNTO-Bees Algorithm on welded beam
design problem with other optim isers... 172
Table 5.3: Minimum cost produced by the improved Bees Algorithm for the welded
beam design p ro b lem ... 174
Table 5.4: Minimum cost produced by the SNTO-Bees Algorithm for the welded
Table 5.5: Comparison o f the SNTO-Bees Algorithm results on coiled spring design
with other optim isers ... 177
Table 5.6: Minimum mass produced by the improved Bees Algorithm for the design
of coil spring p ro b le m ... 179
Table 5.7: Minimum mass produced by the SNTO-Bees Algorithm for the design o f
coil spring p ro b lem ... 180
Table 5.8: Comparison o f the SNTO-Bees Algorithm results on pressure vessel
design with other o p tim isers... 183
Table 5.9: Properties o f test functions used for the SNTO-Bees A lgorithm ... 185
Table 5.10: Performance o f SNTO-Bees Algorithm on MCastellani TF 1 through 10 .. 186
Table 5.11: Mathematical Benchmark Test Functions... 188
C hapter 1: Introduction
Courage is you r greatest presen t need. I t ’s all in the mind, you know.
In a competitive world, only the best (fittest, safest, cheapest, fastest, etc) is good enough. This is why optimisation (local & global) is very frequent in applications. Optimisation is
concerned with finding the best solution to a problem, where best refers to an acceptable
(or satisfactory) solution, which can be the absolute best over a set o f candidate solutions, or any other candidate solutions.
Optimisation techniques are employed in diverse fields such as engineering, manufacturing, finance, medicine, computing art and music, chemistry, physics and economics. The task o f optimisation is that of determining the values o f a set of parameters so that some measure o f optimality is satisfied subject to certain constraints.
This research focuses on the Particle Swarm Optimisation Algorithm, an algorithm belonging to the population-based stochastic optimisation technique inspired by the social behaviour o f birds flocking or a school o f fish and the Bees Algorithm, a population- based search algorithm based on the food foraging behaviour o f swarms o f honey bees.
1.1 M otivation
The Particle Swarm Optimisation Algorithm is based on the swarm intelligence concept,
which is the property o f a system, whereby the collective behaviour o f unsophisticated agents that are interacting locally with their environment to create coherent global functional patterns. In contrast to other global optimisers, the Particle Swarm
Optimisation Algorithm focuses on social interaction and the existence o f cooperation amongst individuals purposely to exchange knowledge about the search space that makes it a robust, flexible and effective optimisation algorithm.
However, the Particle Swarm Optimisation Algorithm is known to suffer from the problem o f premature convergence. This is well documented in the literature. The process o f trying to find a solution to this problem lead to the development o f the PSO-Bees Algorithm. The algorithm combines the fast convergence property o f the Particle Swarm Optimisation Algorithm and the inherent ability o f the original Bees Algorithm to avoid being trapped in local optima.
The Bees Algorithm is a nature-inspired population-based search algorithm that mimics the food foraging behaviour o f swarms o f honey bees. The algorithm performs a kind of neighbourhood search combined with global random search and can be used for both continuous and discrete optimisation problems.
Observations o f the aerial view o f the operation o f the Bees Algorithm show a swarm of bees flying across the search space. However, on zooming in into the algorithm, it can be seen that there are independent patches o f bees searching the problem space with no communication or cooperation amongst these patches to help and make the search
process better as in the case o f the Particle Swarm Optimisation Algorithm. The improved
Bees Algorithm integrates cooperation and communication between different neighbourhoods in the original Bees Algorithm to find the global optimum. The proposed strategies enhanced the performance and convergence o f the algorithm. These ensure the algorithm search only the promising areas o f the search space and avoid the need for
‘killing’ bees as previously employed in other variants o f the Bees Algorithm. This approach also reduces the number o f function evaluations o f the algorithm in finding the global optimum o f functions.
The Sequential Number-Theoretic Optimisation (SNTO) Algorithm is a global
optimisation technique where many points are generated in a multi-dimensional domain,
the optimum point is selected and the domain is contracted around the neighbourhood of the optimum. This technique o f generating points in all dimensions is incorporated into the Bees Algorithm to enhance its exploration capabilities from initialisation and to improve its ability to handle high dimensional problems.
The SNTO technique is attractive because o f its impressive features, such as simplicity, ease o f implementation, effective optimisation performance, ability to handle general optimisation problems and the fact that no calculation o f the derivatives o f the objective functions is required. Furthermore, the implementation of the SNTO technique in the Bees Algorithm resulted in
• a robust method (evenly distributed in all dimensions from initialisation);
• faster convergence to the global optimum o f the objective functions;
• smaller number o f function evaluations;
• eliminating the need for ‘killing’ bees as employed in some variants o f the Bees
Algorithm;
• avoidance o f being trapped in local optima;
• a wide exploration across all dimensions and later an exploitative local search to
The SNTO-Bees Algorithm resolves the limitations of the Bees Algorithm when dealing with high dimension problems.
1.2 Aim and Objectives
The general aim o f this research is to prove the hypothesis that improved nature-inspired optimisation algorithms will result from hybridisation. In particular, the ability o f the Bees Algorithm to avoid being trapped in local optima will be exploited to solve the problem o f premature convergence in the PSO Algorithm. Cooperation and communication between different neighbourhoods, which are features o f the PSO Algorithm, will be introduced to enhance the performance and convergence o f the Bees Algorithm. Finally, the SNTO technique o f generating points in a multi-dimensional capacity will be incorporated to Bees Algorithm.
The main objectives o f this research are as follows:
1. To perform a detailed analysis o f existing global optimisation algorithms,
especially swarm-based optimisation algorithms with a view to improving the PSO Algorithm and the Bees Algorithm.
2. To solve the problem o f premature convergence in the PSO Algorithm.
3. To improve the ability o f the PSO Algorithm to converge onto the global optima.
4. To develop a robust, flexible and effective PSO Algorithm able to train neural
networks to recognise difficult patterns in control chart data and to be excellent in the classification o f wood defects in a more effectual manner.
5. To develop and test the proposed algorithms on the well-known mathematical benchmark functions and obtain empirical results for comparison with other global optimisers including the deterministic simplex method (SIMPSA), the stochastic simulated annealing (NESIMPSA), the Genetic Algorithm (GA), the Ant Algorithm (ANT), the original Bees Algorithm and the original PSO Algorithm.
6. To develop and test the performance o f the SNTO-Bees Algorithm on a number
of deceptive multi-modal functions.
7. To improve the ability o f the original Bees Algorithm to converge onto the global
optima o f functions with high dimensions.
8. To develop and test the second and third proposed algorithms on certain
mechanical design optimisation problems, namely the designs o f welded beams (single-objective and multi-objective), coil springs. To obtain empirical results for comparison with other well-known global optimisers.
9. To develop and test the performance o f SNTO-Bees Algorithm on mechanical
design optimisation problem, the design of pressure vessel. To obtain empirical results for comparison with other well-known global optimisers including the APPROX method, the DAVID technique, the Geometric Programming (GP), the Genetic Algorithm (GA), the improved Genetic Algorithm, the SIMPLEX method and the RANDOM technique.
1.3 M ethodology
• Review o f previous work: an extensive survey was performed on the state o f the
art in intelligent optimisation techniques, focusing on nature-inspired algorithms, to identify research trends and potential solutions.
• Algorithm development and evaluation: The standard PSO Algorithm was
extended by adding adaptive neighbourhood search and global random search. The PSO-Bees Algorithm combines the fast convergence property o f the PSO Algorithm and the inherent ability o f the Bees Algorithm to avoid been trapped in local optima. The performance o f the new algorithm was evaluated by computer simulation to solve a number o f benchmark problems. The results obtained were compared with those o f other optimisation techniques including the deterministic simplex method (SIMPSA), the stochastic simulated annealing (NESIMPSA), the Genetic Algorithm (GA), the Ant Algorithm (ANT), the original Bees Algorithm and the original PSO Algorithm to assess the effectiveness o f the proposed methods.
The standard Bees Algorithm was extended by adding cooperation and communication between different neighbourhoods. The performance o f the new
version o f the algorithm called the improved Bees Algorithm was evaluated by
computer simulation to solve a number of benchmark problems. The results obtained were compared with those o f other optimisation techniques including the deterministic simplex method (SIMPSA), the stochastic simulated annealing (NESIMPSA), the Genetic Algorithm (GA), the Ant Algorithm (ANT), the
original Bees Algorithm and the original PSO Algorithm to assess the effectiveness o f the proposed methods.
The standard Bees Algorithm was extended by adding multi-dimensional point generation. The performance o f the new version of the algorithm called the SNTO-Bees Algorithm was evaluated by computer simulation to solve a number o f benchmark problems. The results obtained were compared with those o f other optimisation techniques including the deterministic simplex method (SIMPSA), the stochastic simulated annealing (NESIMPSA), the Genetic Algorithm (GA), the Ant Algorithm (ANT), the original Bees Algorithm and the original PSO Algorithm to assess the success o f the proposed methods.
Each new algorithm was theoretically analysed using the results to show whether it converges on either a local or global minima, depending on the nature of the problem.
Empirical result was obtained using many synthetic benchmark functions with well-known characteristics. These results are used as supporting evidence for the performance o f the algorithms. It was possible to see whether the algorithm is still making progress towards its goal, or whether it has become trapped in local minima.
The task o f training both summation and product unit neural networks was selected as an example o f real-life optimisation problem. On these problems, the results o f the PSO-Bees Algorithm were compared to those o f the Bees Algorithm, the PSO Algorithm and the well established back-propagation method.
• The task o f solving mechanical design optimisation problems was selected as a
real-life problem. On these problems, the results of the improved Bees Algorithm
and the SNTO-Bees Algorithm were compared to those of the APPROX method, the Geometric Programming (GP), the Genetic Algorithm (GA), the Improved Genetic Algorithm and the SIMPLEX method.
1.4 Thesis Outline
In view o f the fact that this research is about optimisation algorithms, Chapter 2 starts
with a detailed introduction to the concept of optimisation. This is followed by a
comprehensive assessment o f the causes o f problems in optimisation and optimality conditions. An in-depth evaluation o f two nature-inspired optimisation algorithms is discussed: the novel Bees Algorithm and the Particle Swarm Optimisation Algorithm. A comparison between the Particle Swarm Optimisation Algorithm and Evolutionary Computation concludes the chapter.
Chapter 3 starts with an introduction to the PSO-Bees Algorithm. The parameters o f the algorithm are explained. This is followed by a description o f a number o f stopping criterion that can be used on the PSO-Bees Algorithm. The performance measures used to compare the robustness, flexibility and effectiveness o f the algorithm are also presented. The results obtained from training neural networks for control chart pattern recognition and wood defect classification problems are presented, inclusive o f the results obtained by the algorithm on well-known mathematical benchmark test functions.
Chapter 4 describes the improved Bees Algorithm and its application to mechanical design optimisation problems, welded beams (single-objective and multi-objective) and coil springs with the results shown. The presentation o f the results obtained from a number o f mathematical benchmark problem concludes the chapter.
Chapter 5 presents the SNTO-Bees Algorithm. The algorithm is applied to mechanical design problems (design o f welded beams, coil springs and pressure vessel), well-known mathematical benchmark functions and a number o f deceptive multi-modal benchmark functions. The results obtained are presented.
Chapter 6 summarises the main contributions of this research and the conclusions reached. It also provides suggestions for future research.
Chapter 2: Background & Literature Review
Optimisation is one o f the oldest o f sciences, p a rt o f the art o f successful living.
This chapter reviews the principle o f Optimisation with attention focused on optimisation problem classification, optimality conditions and causes o f problems affecting the performance of optimisation algorithms in general. The origin o f the Bees Algorithm and the Particle Swarm Optimisation Algorithm is discussed. The chapter concludes with a comparison between the PSO Algorithm and Evolutionary Computation.
2.1 Optimisation
In a competitive world, only the best (fittest, safest, cheapest, fastest, etc) is good enough. This is why optimisation (local & global) is very frequent in applications. Optimisation is
concerned with finding the best solution to a problem, where best refers to an acceptable
(or satisfactory) solution, which can be the absolute best over a set of candidate solutions,
or any other candidate solutions - this is explained in detail in the section on 'The Method
o f Inequalities by (Weise 2008). Optimisation techniques are employed in diverse fields such as engineering, manufacturing, finance, medicine, computational art and music, chemistry, physics and economics. The task o f optimisation is that o f determining the values o f a set of parameters so that some measure o f optimality is satisfied subject to certain constraints.
v a lid a tio n , se n s itiv ity a n a ly sis a n a ly sis n u m erical m e th o d s v erific a tio n real w o rld p roblem
a lg o r ith m , m o d e l, so lu tio n tech n iq u e
c o m p u te r im p lem en ta tio n
F ig u re 2 .1 : T h e o p tim isa tio n p ro c ess
From Figure 2.1, there is an unavoidable loss of realism as one moves down the diagram,
from real w orld problem to algorithm, model or solution technique and finally to
computer implementation while the arrows indicate the normal process o f the
optimisation cycle. Moving from the real w orld problem to the algorithm, model or
solution technique is known as analysis. Here, the main work of abstracting away irrelevant details and focusing on important elements takes place.
Moving from the algorithm, model, solution techniqueto the computer implementation is
called numerical methods. Moving back from computer implementation to the
problem involves validation and sensitivity analysis. Here the obtained results are compared with the real world and an attempt is made to satisfy such queries as:
• Are the results appropriate? • Do they make sense?
• Does the model need to be modified, or another solution technique need to be
chosen?
Most o f these problems involve linear models resulting in linear optimisation problems
solved using linear programming (Greig 1980) while others are non-linear in nature that are difficult and tricky to solve. The term optimisation refers to problems in which one seeks to minimise or maximise a real function by systematically choosing values o f real or integer variables from within an allowed set which is formally defined as:
Given:
a function f \ A —> R from some set A to the real numbers
Sought:
an element xo in A such that
f i xo) < fix) for all x in A ("minimisation")
fixo) > fix) for all x in A ("maximisation")
Typically, A is some subset o f the Euclidean space R", often specified by a set of:
• equalities or
• inequalities
that the members o f A have to satisfy. The elements of A are called feasible solutions.
The function / is called an objective function. A feasible solution that minimises (or
maximises) the objective function is called an optimal solution. The domain A o f / is
called the search space, while the elements o f A are called candidate solutionsor feasible
solutions.
Generally, when the feasible region or the objective function of the problem does not
present convexity, there may be several local minima and maxima, where a local
minimum x*is defined as a point for which there exists some 6 > 0 such that for all x
|| x - x* || < 5 (2.1)
and
f{x*) < /(x) (2.2)
holds. This means that in some region around x*, all of the function values are greater
than or equal to the value at that point. A local maxima is defined similarly.
The following section highlights the classification of optimisation problems (Engelbrecht 2005) based on a number o f characteristics: the number o f variables, type o f variables, the degree of nonlinearity o f the objective function, constraints used, number o f optima and the number of optimisation criteria.
2.1.1 Optimisation Problem Classification (OPC)
This section identifies the following characteristics used to classify optimisation problems (Engelbrecht 2005):
• The num ber o f variables that influences the objective function: A problem having
a single variable to be optimised is referred to as a univariate problem. If more than
one variable is considered, the problem is called a multivariate problem.
• The type o f variables: By default, a continuous problem has continuous-valued variables, i.e. xj e R, for all j = \,...,n x. I fx t e Z, the problem is referred to as an integer or discrete optimisation problem. A mixed integer problem has both continuous-valued and integer-valued variables. Problems where solutions are
permutations of integer-valued variables are classified as combinatorial
optimisation problems.
• The degree o f nonlinearity o f the objective function: Linear problems have objective functions with linear variables. Quadratic problems use quadratic functions and when other non-linear objective functions are used, the problem is classified as a nonlinear problem.
• The constraints used: A problem using just boundary constraints is categorised as an unconstrained problem while constrained problems have additional equality and / or inequality constraints.
• The num ber o f optima: If there is only one clear solution, the problem is
unimodal. On the other hand, when more than one optimum exists, the problem is
multi-modal. Some other problems may have false optima in which case the
• The num ber o f optim isation criteria: A problem is categorised as a uni-objective
(single objective) when the quantity to be optimised is expressed using only one objective function. A multi-objective problem has more than one sub-objective that must be optimised simultaneously.
The optimisation techniques used to solve the optimisation problem classifications
defined above can be placed into two categories: Local and Global optimisation
algorithms.
2.1.2 Optim ality C onditions (OC)
The solutions found by optimisation algorithms are typically categorised by the quality o f the solution. The main types o f solutions are referred to as local optima or global optima (Bergh 2001; Engelbrecht 2005).
2.1.2.1 Local Optim isation (LO)
A local minimiser, x \ , of the region B, is defined as:
J{Xb) < J ( X ) , Vx z B (2-3)
where 5 c 5 c R n, and S denotes the search space when dealing with unconstrained
problems S = Rn. Note that B is a proper subset o f S. A search space S can contain
multiple regions Bt such that Bjf)Bj = 0 when i * j. It then follows that x*Bi * x*BJ, so that
the minimiser o f each region Bi is unique. Any o f the x*Bi can be considered a minimiser
function can assume in the minimiser, so thaty(x*W)) = J{x*Hl) is allowed. The v a lu e ^ x ^ ,)
is called the local minimum.
While most optimisation algorithms require a starting point zoeS, a local optimisation
algorithm needs to guarantee that it will be able to find the minimiser x*H o f the set B if
roe B. Some selected algorithms satisfy a slightly weaker constraint in that they guarantee
to find a minimiser x 'H/ o f some set B„ not necessarily the one closest to z0 as shown in
Figure 2.2 (Engelbrecht 2005).
W eak lo ca l m in im u m
S tro n g lo ca l m in im u m
G lo b a l m in im u m
W eak local minimum: The solution x*B e B c S, is a weak local minimum of / if
<J{X), Vjc e B (2.4)
Where B c S is a set of feasible points in the neighbourhood o f x*B .
2.1.2.2 Global Optimisation (GO)
The solution x* e S, is a global optimum o f the objective function,/ if
A x ) < f [ x ) , g S (2.5)
where B a. S.
The global optimum is the best o f a set o f candidate solutions as shown in Figure 2.2 for a minimisation problem. This global algorithm starts by choosing an initial starting position
z0 e S.
The copious factors identified by (Weise 2008, 2009) that impinge negatively on the performance o f optimisation algorithms are discussed next - Problems in Optimisation.
2.1.3 Problems in Optim isation
In section 2.1.1, the classifications o f optimisation problems are highlighted. It is therefore worth mentioning the reasons for these varied classifications. A probable cause can be attributed to numerous kinds o f optimisation tasks. These tasks present varied impediments in the paths o f the optimisers and also each task has its own characteristic complexity and difficulties. This mostly concerns global optimisation in general (e.g.
multi-modality, overfitting); others apply especially to nature-inspired approaches like genetic algorithms (e.g. epistasis, neutrality). As a result, neglecting even a single issue in
sections 2.1.3.1 through section 2.1.3.9 during the design / process of optimisation can render the whole effort invested futile, even if the most efficient optimisation techniques are applied. These include (Weise 2008, 2009):
2.1.3.1 Premature C onvergence (PC)
Convergence: An optimisation algorithm has converged if it keeps on producing solutions from a “small” subset o f the problem space or if it cannot reach new solution
candidates anymore (Schaffer et al. 1990).
As a standard, global optimisation algorithms need to converge at a moment in time. However, one o f the most important problems in global optimisation is we generally cannot determine whether the best solution currently known is a local or a global optimum and there is also the dilemma whether its convergence is acceptable or not. In other words, we are not able to say whether we can stop the optimisation process, or we should concentrate on refining our current optimum, or whether we should examine and explore other areas o f the search space. Furthermore, premature convergence can also occur when there are multiple (local) optima in which case it is a multi-modal problem.
Multimodality: A set o f objective functions / i s multi-modal, if it has multiple local or global optima (Shekel 1971).
Premature Convergence: An optimisation process has prematurely converged to a local optimum if it is no longer able to explore other parts o f the search space than the currently examined area and there exists another region that contains a solution superior
to the currently exploited one (Schaffer et al. 1990).
Premature convergence can occur when an optimisation algorithm passes by several local optima in the objective space before reaching a good solution. As a result, it is most likely to get stuck on such an intermediate solution and would not be able to proceed to search other areas in the solution space. Each optimisation algorithm has features and parameter settings that help to influence its convergence behavior (Rudolph 1997). Some algorithms are capable o f self-adaptation, allowing them to change their strategies or to modify their parameters depending on its current state and environment. Such behavior is often implemented in order to speed up the optimisation process, but may lead to premature convergence onto local optima (Rudolph 1999, 2001). A possible resolution would be to randomly restart the optimisation process at some chosen points in time. Although crude, it is sometimes an effective measure against premature convergence. Also worth mentioning is domino convergence.
Dom ino Convergence (DC): Domino convergence occurs when the solution candidates have features which contribute to significantly different degrees of the total fitness. When these features are encoded in separate genes (or building blocks) in the genotypes, there is likelihood that they will be treated with different priorities in randomised or heuristic optimisation methods. The building blocks having a very strong positive influence and stimulus on the objective values will most likely be adopted first by the optimisation
process (“converge”) while at the same time, the alleles o f genes, having smaller contributions, play no role. This is because the alleles o f genes, having smaller contributions, do not come into play until the more “important” blocks have been accumulated. Rudnick (Rudnick 1992) called this sequential convergence phenomenon “domino convergence” due to its resemblance with a row o f falling domino stones
(Thierens et al. 1998). Also worth mentioning is that the relationship between exploration
and exploitation influences convergence.
Exploration vs. Exploitation: From (Eshelman and Schaffer 1991; Smith 2004), the procedure that creates new solutions from existing ones has a very large impact on the balance between exploration and exploitation. For instance, the “step size” setting influences how an optimisation algorithm solves the balancing problem between exploration and exploitation.
(Eiben and Schippers 1998; Muttil and Liong 2004) researched the trade-off between exploration and exploitation that optimisation algorithms have to face.
Exploration: in terms o f optimisation it means finding new points in areas of the search space which have not yet been investigated.
Exploration is the only means to finding a new or an even better solution. Until the algorithm finds a better solution - which is not guaranteed - the performance o f the optimisation process degenerates because we are evaluating solution candidates inferior to the ones we already know.
Exploitation: in terms o f optimisation it means trying to improve the currently known solution(s) by performing small changes which lead to new individuals which are very close to them.
The process o f exploitation often results in performance improvements since the chance o f finding better solutions which are similar to the already known individuals is often good. Conversely, better solutions located in distant areas o f the solution space, would not be discovered by minor refinements. Occasionally, some parts of optimisation strategies can be used either for increasing exploitation or in favour o f exploration. For instance, unary search operations can be built to improve an existing solution in small steps, hence being exploitation operators. On the other hand, it can also be implemented in a way that introduces much randomness into the individuals, thus performing exploration operations.
Generally, the algorithms that favour exploitation have high convergence speed but run the risk o f not finding the optimal solution and can get stuck at a local optimum. On the other hand, algorithms that perform excessive exploration may find the global optimum but it will take them a very long time to do so.
Diversity: Exploitation and exploration are directly linked with diversity: exploration increases the diversity whereas exploitation works against it. As a result, diversity preservation is a major concern in optimisation. The loss o f diversity can lead to premature convergence onto a local optimum. Because o f its effect and consequence, this has been widely studied by researchers; in Genetic Algorithms (Ronald 1996), in
Evolutionary Algorithms (Singh and Deb 2006), in Genetic Programming (Burke et al.
2002b) and in Particle Swarm Optimisation (Wilke et al. 2007).
2.1.3.2 Ruggedness and W eak Causality
Ruggedness: Most optimisation algorithms depend on some form of gradient in the objective or fitness space. Occasionally, the objective function is continuous and exhibits low total variation to enable the optimiser to descend the gradient easily. On the other hand, if the objective function fluctuates up and down, it becomes more difficult for the optimiser to find the right direction to proceed in. In short, the more rugged a function gets, the harder it is to optimise (ruggedness is multi-modality plus steep ascents and descents in the fitness landscape).
Strong Causality: The principle o f strong causality (locality) proposed by Rechenberg (Rechenberg 1994) states that small changes in an object lead to small changes in its behaviour.
During an optimisation process, new points in the search space are found by the search operations. Generally it can be assumed that the genotypes are the input o f the search operations corresponding to the phenotypes which have previously been selected. The chance o f being selected for further investigation is usually the higher the better or the more promising an individual is. This statement implies that individuals which are passed to the search operations are likely to have a good fitness. As the fitness o f a solution candidate depends on its properties, it is assumed that their properties were not so bad
either. It is thus possible for the optimiser to perform slight changes to these properties in order to find out whether they can be improved further.
On the other hand, if we consider fitness landscapes with weak (low) causality, small changes in the solution candidates often lead to large changes in the objective values, i.e. ruggedness. This makes it very difficult to come to a decision as to what area o f the solution space to explore, thereby making it impossible for the optimiser to consistently find any reliable gradient information to follow. Consequently, small modifications of a very bad solution candidate will most likely lead to a new local optimum and the best solution candidate currently known may be surrounded by points that are inferior to all other tested individuals.
2.1.3.3 Deceptiveness
Deceptiveness is one of the upsetting features of the fitness landscapes. As the name implies, the gradient o f the deceptive objective function leads the optimiser away from the global optima.
The deceptiveness idiom is employed frequently in the Genetic Algorithm community in the context o f the Schema Theorem where schemas describe particular areas (hyper planes) in the search space. When an optimisation algorithm has discovered an area with a superior average fitness in contrast to other regions, logically it focuses on exploring this area with certainty to converge on the true optimum. Dissimilar objective functions are said to be deceptive (Liepins and Vose 1991).
2.1.3.4 Neutrality and Redundancy
Neutrality: The outcome o f a search operation to a solution candidate is neutral if it yields no change in the objective values (Bamett 1998).
For all optimisation algorithms, it is problematic when the best solution candidate currently found is located on a plane o f the fitness landscape. This implies that all other adjacent solution candidates have the same objective values. Thus, there is neither gradient information nor direction into which the optimisation algorithm can proceed in a systematic manner. As a result, each search operation will yield identical individuals. The possible solution to this is for optimisation algorithms to maintain a list o f the best candidates found, which will sooner or later overflow and require pruning.
Evolvability: is a metaphor in global optimisation taken from biological systems (Dawkins 1987). According to Wagner (Wagner 2005), this word has two uses in biology. A biological system is evolvable if it is able to generate heritable, selectable phenotypic variations (Kirschner and Gerhart 1998). Such properties can then evolve and change through natural selection. In the second meaning, a system is evolvable if it can acquire new characteristics via genetic change that help the organism(s) to survive and to reproduce. (Weise 2008) adopted the idea of evolvability for global optimisation as follows:
The evolvability o f an optimisation process in its current state defines how likely the search operations will lead to solution candidates with new (and eventually, better) objectives values.
The direct probability o f success (Beyer 1994) - the chance that search operators produce offspring that are fitter than their parents, is also sometimes referred to as evolvability in the context o f evolutionary algorithms (Altenberg 1994).
Many researchers disagree and argue the converse concerning this suggested link between evolvability and neutrality, maintaining that the evolvability of neutral parts o f a fitness landscape is dependent on the optimisation algorithm used. For hill climbing and similar approaches, this dependence is low because the search operations cannot provide improvements (or even changes). The optimisation process is then reduced to a random walk.
Neutral Networks
The concept o f neutral networks was derived from the idea o f neutral bridges between
different parts o f the search space as sketched by (Smith et al. 2002).
By definition, neutral networks are equivalence classes K o f elements of the search space G which map to elements o f the problem space X with the same objective values and are connected by chains o f applications o f the search operators (Barnett 1998). According to Barnett (Bamett 1998), a neutral network has the property o f constant innovation if:
• the rate o f discovery o f innovations keeps constant for a reasonably large amount
o f applications o f the search operations (Huynen 1996).
Stewart (Stewart 2001) utilised neutral networks and the idea o f punctuated equilibria in his extrema selection, where a Genetic Algorithm variant focusing on exploring individuals has good objective values that are located further away from the centroid o f the set o f the currently investigated solution candidates.
Bomberg-Bauer and Chan (Bomberg-Bauer and Chan 1999), van Nimwegen (Nimwegen
et al. 1999), and Wilke (Wilke 2001) studied the convergence of neutral networks. The outcome o f their results illustrate that the topology o f neutral networks strongly
determines the distribution o f genotypes, while from (Beaudoin et al. 2006) the
genotypes are “drawn” to the solutions with the highest degree o f neutrality on the neutral network.
Redundancy: is defined in the context o f global optimisation as a feature of the genotype-phenotype mapping. It means that multiple genotypes map to the same phenotype (the genotype-phenotype mapping is not injective, which means a one-to-one function). Mathematically, this is written as:
3 gi,g2 : gi * g2 a gpm(gi) = gpm(g2) (2.6)
Where g l, g2 are the genotype (elements o f the search space) and ‘gpm’ is the genotype- phenotype mapping.
The role of redundancy in the genome is as controversial as that of neutrality. There are numerous accounts o f its positive influence on the optimisation process. Shipman
(Shipman et al. 2000) and Huynen (Huynen et al. 1996) developed redundant genotype-
phenotype mapping using:
• voting
• cellular automata
• random Boolean networks (Kauffman 1993)
All four mappings produced neutral networks which proved beneficial for exploring the
problem space. One o f the possibly converse effects is epistasis.
Redundancy has significant impact on the explorability of the search space. In a one-to- one mapping, the translation o f a slightly modified genotype often results in a different phenotype. Conversely, if there exists a many-to-one mapping between genotypes and phenotypes, the search operations can create offspring genotypes different from the parent, which still translate to the same phenotype. The effect will cause the optimiser to stride along a path through this neutral network. In this case, when many genotypes along this path are modified to different offspring, it often results in many new solution
candidates being reached (Shipman et al. 2000).
2.1.3.5 Epistasis
From biology, epistasis is described as a form of relations or interactions between
different genes (Phillips 1998). The term was originally invented by Bateson (Bateson 1909), meaning that one gene suppresses the phenotypical expression of another gene.
Fisher (Fisher 1918) called epistasis “epistacy” in the context o f statistical genetics. From
(Lush 1935), the interaction between genes is epistatic if the effect on the fitness from altering one gene depends on the allelic state o f other genes. The knowledge and perception o f epistasis comes very close to another biological expression: pleiotropy, which means a single gene influences multiple phenotypic traits (Williams 1957). In global optimisation, there is no such fine-grained distinction.
Epistasis (Davidor 1990; Naudts and Verschoren 1996) in global optimisation means that a change in one gene o f a genotype, introduced by a search operation for instance, leads to changes in multiple, otherwise unrelated, phenotypical properties. A minimal epistasis occurs when every gene is independent o f every other gene. A maximal epistasis arises
when no proper subset o f genes is independent o f any other gene (Naudts et al. 2000).
For a genome with high epistasis, a modification in a genotype will alter multiple properties o f the corresponding phenotype. Naudts and Verschoren (Naudts and Verschoren 1999) showed that deceptiveness does not occur in situations with low epistasis and also that the objective functions with high epistasis are not necessarily deceptive on the example o f length-two binary string genomes.
2.1.3.6 Overfitting and O versim plification
In circumstances where optimisers appraise some o f the objective values of the solution candidates by using training data, two phenomena with negative influence have been
detected: Overfitting and Oversimplification.
Overfitting is defined as the emergence o f an overly-complicated model (solution candidate) in an optimisation process resulting from the effort to provide the best possible results for as much o f the available training data as possible (Dietterich 1995; Sarle
1997).
A model (solution candidate) m e X that is produced with a finite set o f training data is considered to be overfitted if a less complicated, alternative model m ’ e X , m ’ * m exists which has a smaller error for the set o f all possible producible data samples. The
model m' may have a larger error in the training data. Yet again, the phenomenon of Overfitting is encountered in the field o f artificial neural networks (ANN) or in curve
fitting (Lawrence and Giles 2000; Ling 1995; Sarle 1995; Tetko et al. 1995). The latter
imply that we have a set A of n training data samples (jc„ yj) and we need to find a
function/ that represents these samples as well as possible, that is:
f i x l) = y i V (x,, y,) e A (2.7)
To be precise, there is one polynomial o f degree n - 1 that fits to such training data and
goes through all its points. When it is restricted to polynomial regression, there is one
global optimum, single perfect fit. On other occasion there is the likelihood o f having an
infinite number o f polynomials with a higher degree than n - 1 that also matches the
sample data perfectly - this is considered as overfitted. A very common cause for
Overfitting is noise present in the sample data for which there is no measurement device for physical processes that delivers perfect results without error. Additionally, in opinion surveys o f people working in various fields or with randomised simulations reveal variations from the true interdependencies o f the observed entities. Hence, the data
samples A based on measurements will always contain some noise.
The major problem resulting from overfitted solutions is the loss o f generality.
Generality: by definition, the solution o f an optimisation process is “general” if it is not only valid for the sample inputs x\, X2, . . . , x n which were used for training during the optimisation process but also for different inputs x * Xj V : 0 < i < n if such inputs x
Overfitting Prevention
There are multiple techniques used to prevent overfitting to a certain degree. It is most effective to apply multiples o f such techniques together in order to achieve the best results. The following as identified by (Weise 2008) are known to be helpful in preventing overfitting:
1. Restriction o f the Problem Space: restricting the problem space X in a way that
only solutions up to a given maximum complexity can be found.
2. Additional Optimisation Criteria: the functional objective function that solely
concentrates on the error o f the solution candidates needs to be augmented by penalty terms and the secondary objective functions need to put pressure into the direction of small and simple models (Dietterich 1995).
3. Training Large Data Sets: although this slows down the optimisation process, at
times it may improve the generalisation capabilities of the solutions derived.
4. Changing Training Data / Simulation