prototype-based classification
Bassam Mokbel, Benjamin Paassen, and Barbara Hammer
∗CITEC centre of excellence, Bielefeld University, Germany
(This is a preprint of the publication [13], as provided by the authors.)
Abstract
More complex data formats and dedicated structure metrics have spurred the development of intuitive machine learning techniques which directly deal with dissimilarity data, such as relational learning vector quantiza-tion (RLVQ). The adjustment of metric parameters like relevance weights for basic structural elements constitutes a crucial issue therein, and first methods to automatically learn metric parameters from given data were proposed recently. In this contribution, we investigate a robust learning scheme to adapt metric parameters such as the scoring matrix in sequence alignment in conjunction with prototype learning, and we investigate the suitability of efficient approximations thereof.
1
Introduction
An ever increasing availability of problem-specific data formats and a rapidly growing data complexity raises the issue that data are often no longer vectorial, rather data structures such as sequences, trees, graphs, or similar have to be dealt with [3]. One prominent approach which enables machine learning for structures is based on a dissimilarity representation [14]: data are described by pairwise dissimilarities given by some problem-specific dissimilarity measure such as sequence alignment, structure alignment, graph or tree kernels. Then any machine learning technique which is capable of processing proximity data can be applied.
Facing such data, one particular problem with classical learning techniques is the inherent discrete nature of structured data, hence smooth model updates become difficult. For dissimilarity data we can rely on an implicit embedding of data in an underlying pseudo-Euclidean vector space or more general Krein space [14]. Mimicking the popular kernel trick, it is possible to extend many vectorial, distance-based methods to such an embedding, resulting in so-called ∗Funding by the DFG priority programme 1527“autonomous learning”under grant
num-ber HA 2719/6-1, and by the CITEC centre of excellence is gratefully acknowledged.
relational methods. Popular examples include unsupervised models such as
relational self-organising maps and relational generative topographic mapping, or supervised counterparts such as learning vector quantization (LVQ) based schemes. [7, 4, 6]. Here we will exemplarily address prototype-based LVQ.
Specifically, we will considerrelational generalized LVQ(RGLVQ) as an ex-tension ofgeneralized LVQ (GLVQ) to dissimilarity data [7]. GLVQ constitutes a popular and mathematically well-founded LVQ scheme with successful appli-cations ranging from bioinformatics to robotics [15, 10, 16]. One interesting extension is its combination with metric learning, which not only enhances the representational power but also facilitates model interpretability [16]. While relational variants also yield a robust prototype-based model, their metric pa-rameters are usually fixed, failing in situations where these papa-rameters are un-suitable. We address the challenge to adapt metric parameters in RGLVQ, extending upon a well-proven concept of smooth metric learning in vectorial GLVQ [16].
More specifically, we consider symbolic sequences and sequence alignment as one relevant type of structured representation. Alignment heavily depends on the underlying scoring matrix which assigns scores to local symbolic comparisons and gaps. In bioinformatics, these can be inferred from evolutionary models, but in general their choice is based on a-priori assumptions about the domain or data space [17]. A few promising approaches how to infer scores from exem-plary alignments have been proposed [5, 18, 1, 2]. One approach proposes to adapt scores for a discriminative classification task in conjunction with RGLVQ training, leading to first promising results [12]. The goal of this contribution is to extend this approach to a more robust adaptation suitable for realistic problems, and to test how it can be approximated to increase computational efficiency.
2
Learning vector quantization for sequence
align-ments
LVQ models represent vectorial data~aiby prototypesw~jwith labelsc(w~j) [16].
Classification uses a winner-takes-all rule: a data point is classified according to its closest prototype. Given labeled data (~ai, c(~ai)), GLVQ minimizes the cost
N X i=1 Φ d+(~ai)−d−(~ai) d+(~ai) +d−(~ai)
where Φ is a monotonic function,d+is the distance of~aito the closest prototype
with a matching label,d− refers to a non-matching label [16].
For dissimilarity data described by a symmetric matrix D with entries dij,
an extension to relational LVQ is possible [14, 7]: a pseudo-Euclidean space and vectors ~ai exist which induce d
ij [14]. Prototypes are given as convex
combinations w~j = P iα j i~ai with P iα j i = 1 inducing d(~ai, ~wj) = P lα j ldil− 0.5P ll′α j lα j
l′dll′. This can be computed based on the coefficients~αj and
actual data entities (e.g. string sequences), see [7]. We can adapt the coefficients ~
α+ orα~− of the closest correct or incorrect prototype, by a stochastic gradient
descent.
For sequence data, we can choose dissimilarities D according to pairwise alignments. We denote sequences over an alphabet Σ as ¯a= (a1, . . . , aI, . . . , a|¯a|)
withai∈Σ and length|¯a|. Assume a symmetric dissimilarity measuredλ(ai, aj) =
λij is fixed on (Σ∪ {−})2 withdλ(ai, ai) = 0 anddλ(ai, bj)≥0 for ai 6=bj ∈
Σ∪ {−}. A (global)alignment of sequences ¯aand ¯bconsists of extensions (¯a∗,
¯b∗)∈((Σ∪ {−})∗)2 by gaps such that|¯a∗|=|¯b∗|. Alignment costs are
d∗(¯a,¯b) = min |¯a∗| X i=1 dλ(a∗i, b ∗ i) (¯a∗,¯b∗) is alignment of (¯a,¯b) .
Setting ¯a(I) = (a1, . . . , aI) and ¯b(J) = (b1, . . . , bJ), alignment costs can be
computed by dynamic programming (DP) using the recursion d∗(¯a(0),¯b(0)) = 0, d∗(¯a(0),¯b(J)) =P j≤Jdλ(−, bj), d∗(¯a(I),¯b(0)) =P i≤Idλ(ai,−), d∗(¯a(I+ 1),¯b(J+ 1)) = min{ A1:=d∗(¯a(I),¯b(J)) +dλ(aI+1, bJ+1), A2:=d∗(¯a(I+ 1),¯b(J)) +dλ(−, bJ+1), A3:=d∗(¯a(I),¯b(J+ 1)) +dλ(aI+1,−)} .
3
Adaptive scoring for alignments
Sequence alignment crucially depends on the scores λ of dλ. Similar to [12],
we propose an adaptation ofλbased on the RGLVQ costs. Derivatives of the summand corresponding to a sequence ¯ai with respect toλ
km yield Φ′· 2d −(¯ai) (d+(¯ai) +d−(¯ai))2 · ∂d+(¯ai) ∂λkm −Φ′· 2d +(¯ai) (d+(¯ai) +d−(¯ai))2 · ∂d−(¯ai) ∂λkm with∂d(¯ai,w¯j)/∂λ km =Plα j l∂d∗il/∂λkm−0.5Pll′α j lα j l′∂d ∗ ll′/∂λkm where d∗il
refers to the alignment of sequencesiandl. Alignmentd∗(¯a,¯b) is not
differen-tiable, but an approximation is, substituting min by
softmin(x1, . . . , xn) =Pixi·exp(−βxi) Pjexp(−βxj) with the derivative
softmin′(xi) = (1−β·(xi−softmin))·exp(−βxi)/Pjexp(−βxj). The derivative
∂d∗(¯a,¯b)/∂λ
km can be computed in a DP scheme analog to the alignment: ∂d∗(¯a(I+1),¯b(J+1)) ∂λkm = softmin ′ (A1)· ∂d∗(¯a(I),¯b(J)) ∂λkm +δk(aI+1)δm(bJ+1) + softmin′(A2)· ∂d∗(¯a(I+1),¯b(J)) ∂λkm +δk(−)δm(bJ+1) + softmin′(A3)· ∂d∗(¯a(I),¯b(J+1)) ∂λkm +δk(aI+1)δm(−)
whereδk(ai) tests whether the symbolai is element kin Σ.
We will investigate the role of the parameter β and efficient approxima-tions of the computation in the experiments. For β → ∞ the derivative ∂d∗(¯a,¯b)/∂λ
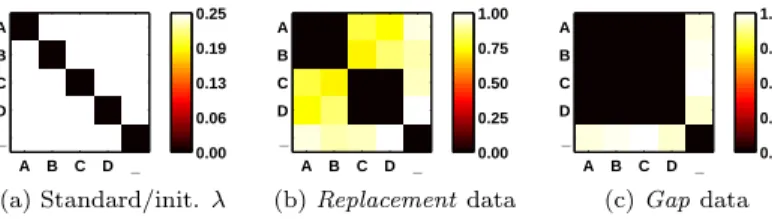
A B C D _ A B C D _ 0.00 0.06 0.13 0.19 0.25 (a) Standard/init. λ A B C D _ A B C D _ 0.00 0.25 0.50 0.75 1.00 (b)Replacementdata A B C D _ A B C D _ 0.00 0.25 0.50 0.75 1.00 (c)Gapdata
Figure 1: Visualizations of the scoring matrixλ, where color/intensity encodes the values. On the left is a standard choice ofλ which also serves as the ini-tial state for the training, the middle and right show the final state of λafter adaptation.
are paired in the alignment (¯a,¯b). Forβ →0, all three possible choicesA1,A2,
andA3are taken into account and no alignment paths stand out for the
adapta-tion, resulting in homogeneous valuesλkm. It is expected that optimal choices
lie in between these extremes, corresponding to a good balance of exploitation of optimal alignment paths and exploration of competing alignment paths with similar quality. The latter is particularly relevant at the beginning of training and for large|Σ|. Because of the computational complexity, experiments have been reduced to the crisp case β → ∞only in [12]. Here, we will investigate different choices β, and will rely on the following two approximations for effi-ciency:
Approximation of prototypes by closest exemplars: ∂d(¯ai,w¯j)/∂λ
kmrefers to two
sums with all coefficientsαjl of ¯wj. We use a
k-approximation of the prototype which restricts to the closest k exemplars [7]. For the particularly interesting casek= 1, the derivative becomes∂dil/∂λkm, where ¯al is the closest exemplar.
Dropping alignment paths with small contribution: In the limit β → ∞, con-tributions restrict to the best alignment path, hence derivatives∂d∗(¯a,¯b)/∂λ
km
for all λkm can be computed in time O(|¯a|+|¯b|) based on the alignment
ma-trix. In general, derivatives are weighted sums corresponding to alignments of the symbols m and l at some position (I, J) of the matrix. Weighting takes into account all possible paths which include this pair according to the path eligibility measured by softmin′(Ai) for actions Ai on the path; the worst case
complexity isO(|a¯| · |¯b| · |Σ|2) using backtracing in the alignment matrix. We
propose an approximation based on the observation that a small softmin′(Ai)
leads to a small weight of paths includingAi. Hence, we store the 3 termsA1,
A2, A3 together with the distances softmin(A1, A2, A3) in the matrix, and we
cut all values softmin′(Ai) < θ for fixed θ ≥ 0. Backtracing depends on the
nonzero values only, so that a speed-up to linear complexity is possible in the best case.
4
Experiments
We investigate the performance characteristics of RGLVQ using a fixed scoring matrix λ in comparison to adaptive scores λ based on the proposed approx-imations. First, we discuss the influence of the ‘crispness’ parameter β, and
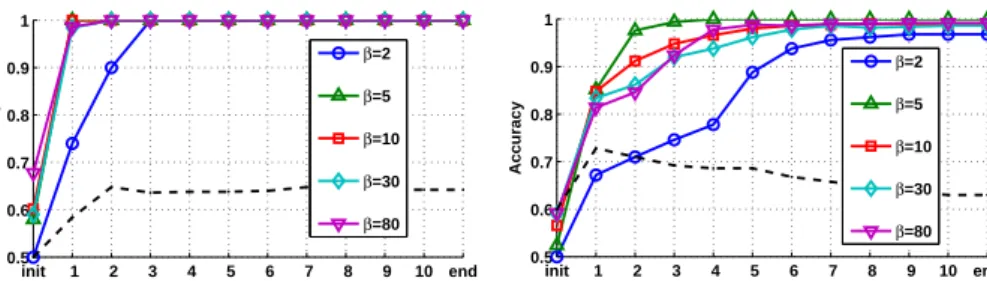
init 1 2 3 4 5 6 7 8 9 10 end 0.5 0.6 0.7 0.8 0.9 1 Training epochs Accuracy β=2 β=5 β=10 β=30 β=80
(a) DifferentβforReplacement data
init 1 2 3 4 5 6 7 8 9 10 end 0.5 0.6 0.7 0.8 0.9 1 Training epochs Accuracy β=2 β=5 β=10 β=30 β=80
(b) DifferentβforGapdata
Figure 2: The figures show how the crispnessβ affects the adaptation of λand convergence of RGLVQ training. For differentβ, the mean test accuracy over all cross-validation runs is given in every learning epoch. The dashed black line represents RGLVQ training without adaptingλand serves as a baseline.
thereafter, the applicability and efficiency regarding real-world classification sce-narios.
4.1
Artificial data
Replacement data: In this data set, all strings have 12 symbols randomly
generated from the alphabet Σ ={A,B,C,D} according to the regular expres-sions: (A|B)5
(A|B) (C|D) (C|D)5
for the first class, and (A|B)5
(C|D) (A|B) (C|D)5 for the second. Hence, replacements of A or B by C or D are discriminative, while replacementsAwithB, andCwithDare not. After the training ofλ, we expect high costs for discriminative replacements, while other replacement costs are close to zero. Also, we expect positive gap costs, since gaps could otherwise circumvent the alignment of the discriminative middle parts.
Gap data: The second data set focuses on gap scoring. Strings in the first
class are random sequences ¯ai ∈ Σ10 of length 10, whereas strings ¯al ∈ Σ12
in the second class are longer by 2 symbols. Therefore, replacements of letters are not discriminative, while the introduction of any gaps discriminates classes. Thus, gap costs should be high, while any symbol replacements should cost less.
Evaluation: For each data set, we created N= 100 sequences and evaluated
the average classifier performance in a 5-fold cross-validation with 5 repeats. RGLVQ was trained using one prototype per class for 10 epochs. The learning rate for the adaptation ofλkmwas set toη= 1/Nfor replacement as well as gap
scores. As initialization, we use a standard choice ofλkm= 1/|Σ| ∀(k, m)∈(Σ∪ {−})2, k6=m, and add small random noise to break ties in the initial alignments.
All self-replacement scores remain fixedλkk = 0. During the adaptation, small
or negative values λkm < ǫ = 0.005 are reset to ǫ in order to keep D
non-negative.
The experimental results in Fig. 2 show the increased accuracy when adapt-ingλ, e.g. forβ = 5 a test accuracy of 100% (with 0 deviation) was achieved after the 4th epoch. Respectively, the adaptedλrepresent ideal scoring matrices
for both data sets, which exactly fulfill our previously described expectations, see Fig. 1. In contrast, training RGLVQ with a fixed standard scoringλremained close to a random guess throughout the learning epochs, see the baseline in Fig. 2.
We further evaluated how the ‘crispness’ parameterβinfluences the classifier and the training progress. In Fig. 2, we can see how a lower crispness (e.g. for β = 2) generally slows down the adaptation, while higher values seem to facilitate a faster convergence, sometimes at the expense of robustness (seeβ = 80 in Fig. 2b). Generally, we can observe thatβdirectly affects the convergence characteristics, with an optimal value lying in a medium range.
4.2
Applicability and efficiency for real-world data sets
Chromosomes data: The sequences in this set represent band patterns from
the Copenhagen Chromosomes database [11]. Every sequence encodes the dif-ferential succession of density levels observed in gray-scale images of a human chromosome. Since 7 levels of density are distinguished, a 13-letter alphabet Σ ={f, . . . ,a,=,A, . . . ,F}represents a difference coding of successive positions, where upper and lower case letters mark positive and negative changes respec-tively, and “=” means no change1. From the database, we use a common
bench-mark set for binary classification, containing class 4 and 5, with 200 sequences each (N= 400). To handle the full 22-class data set, a local scoring matrixλj
for every prototypew~j would be necessary, which is ongoing work, see Sec. 5.
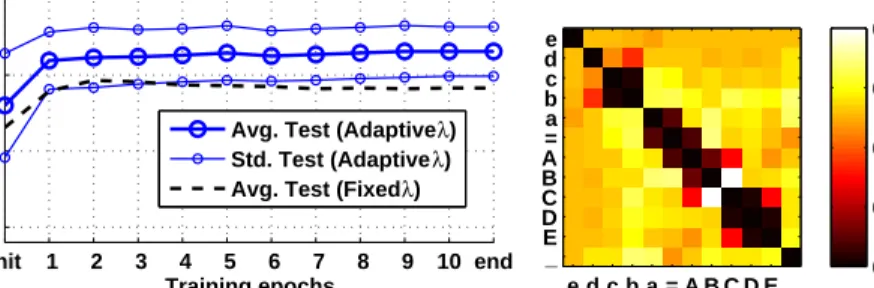
The initial setup ofλwas analog to the previous experiment, and one proto-type per class was trained in a 5-fold cross-validation with 5 repeats. Crispness β= 35 was chosen, andηRep= 0.6·(1/N) was set for learning replacement costs
λkm and ηGap = 0.4·(1/N) for gaps λk−. The results in Fig. 3 show an
im-provement of the average test accuracy by 3% after adaptation ofλ. The ratio of mean intra-class distance to mean inter-class distance dropped from 0.94 to 0.91 in the adapted metric. Interestingly, λ shows a semantically meaningful pattern, with rather low values in the 1st and 2nd off-diagonals, which resembles the fact that density differences on neighboring scales are exchangeable within classes. (Note, that symbols f,Fdid not occur in the data and were thus not considered.)
1For details, seehttp://algoval.essex.ac.uk/data/sequence/copchrom/
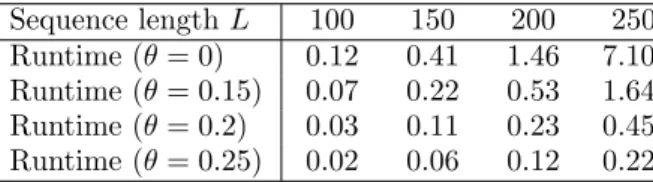
Table 1: Runtimes (in minutes) to calculate the alignment derivative for all pairs of random strings ¯ai ∈ΣL, i∈ {1. . .10}, using different thresholdsθand
β=10. Sequence lengthL 100 150 200 250 Runtime (θ= 0) 0.12 0.41 1.46 7.10 Runtime (θ= 0.15) 0.07 0.22 0.53 1.64 Runtime (θ= 0.2) 0.03 0.11 0.23 0.45 Runtime (θ= 0.25) 0.02 0.06 0.12 0.22
init 1 2 3 4 5 6 7 8 9 10 end 0.85 0.9 0.95 1 Training epochs Accuracy
Avg. Test (Adaptive λ) Std. Test (Adaptive λ) Avg. Test (Fixed λ)
(a) Classification accuracies
e d c b a = A B C D E _ e d c b a = A B C D E _ 0.00 0.04 0.07 0.11 0.14 (b) Adaptedλ
Figure 3: Results for theChromosomes data set, where the (semantically sound) adaptation ofλ(right) yields an improvement of 3% in test accuracy (left).
Protein data: The sequences in this set are taken from a subset of the
SwissProtdatabase (release 37), which originally consists of 10,988 protein se-quences in 32 classes. This subset was previously used in the context of RGLVQ classification, see [8]. For efficient testing of binary classification, we restrict here to the two classes with the lowest mean sequence lengths, using 617 sequences in total (class4FE4S FERREDOXINwith 289 sequences, andADH SHORTwith 323). RGLVQ training with 3 prototypes per class and distances based on the fixed standard scoring λresulted in a test accuracy of 92%. Although the adaptation ofλlead to a slightly decreased 90% accuracy, it also produced a rather sparse scoring model: many values inλare close toǫand only a smaller portion of the parameters influence the align-ment with significant positive costs, namely
{(k, m)|λkm> ǫ+ 0.01} = 488 out of 650 = (Σ∪{−})2
possible pairs. Looking at low-dimensional embeddings of the
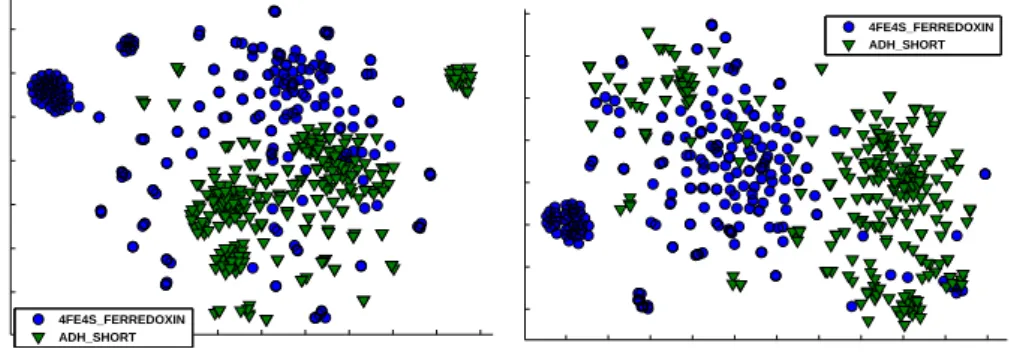
stan-dard vs. the adapted distances (embedded by the t-SNE technique [19], see Fig. 4), we can observe that the main clusters of each class become more clearly distinguished by the adaptation. This is substantiated by the fact that the ratio of mean intra-class dis-tance to mean inter-class disdis-tance decreases from 1.02 to 0.88. A detailed investigation about the semantic value of the sparse scoring model and increased class-separation is ongoing work.
Approximated alignment derivative for computational speedup: Since
the calculation speed of derivatives∂d∗(¯a,¯b)/∂λ
kmseverely affects the overall runtime,
we empirically evaluate the speedup by the approximation proposed in the end of Section 3. The thresholdθ determines that values softmin′(A
i) < θ are ignored in
the backtracing of alignment paths. Since the impact ofθ depends on the alphabet size and sequence length, it should be tuned according to good classification results for the given data set. Typical values areθ∈ (0.01,0.2). As a simple test scenario, we created several sets of random sequences, each consisting of 10 sequences ¯ai∈ΣL
with Σ ={A,B,C,D}, for different choices of length L. For different thresholdsθ, we tracked the runtime of calculating alignment derivatives for all 100 sequence pairs on a standard laptop computer with anIntel Core i7 processor (4 cores, and calculations
done in parallel). The results in Tab. 1 clearly show how increasing θ drastically reduces the computational effort, especially for longer sequences. At the same time, approximation to a certain extent does not reduce classifier performance: average test accuracy on theChromosomes data remained at 97% for θ = 0.02, decreasing the mean runtime by 7%.
5
Discussion
We presented a technique to integrate the supervised adaptation of metric parameters (in this case the scoring pattern for sequence alignments) into a LVQ-based classifier framework. Specifically, we utilized RGLVQ as an overarching learning regime, which is able to process (dis)similarity data [7]. The goal is to facilitate class discrimination in the adapted dissimilarities, while the training of prototypes yields a sparse classi-fication model for the data. Unlike in [9], we do not assume differentiability of the dissimilarity measure with respect to the data structures itself, but differentiability with respect to the metric parameters only. Therefore, our approach could serve as a generic foundation for metric adaptation schemes using dissimilarity measures for discrete structures such as sequences or, as a generalization, trees or graph structures. In addition to an improved class separation in adapted distances, the learned scoring could highlight the importance of structural replacement operations, and thus give further insight into the classification model. In the experiments, we demonstrated the viability of our method, and evaluated the influence of the crispnessβ, along with the computational speedup by an approximation technique. The adaptation ofλrevealed semantically interesting symbolic scoring patterns, a more detailed analysis being the subject of future work. Since one parameter set λ affects the global metric in the data space, it could be beneficial to use class-specific scoring matricesλj, e.g. for
ev-ery LVQ prototype, similar to local metric learning for vectorial data [16]. In terms of efficiency, a current limitation is the inherent dependency of RLVQ on the entire dissimilarity matrixD, which changes entirely ifλ is adapted. Therefore, one could refer to low-rank techniques to approximateDbased on a small number of landmark sequences.
References
[1] M. Bernard, L. Boyer, A. Habrard, and M. Sebban. Learning probabilistic models of tree edit distance. Pattern Recognition, 41(8):2611–2629, 2008.
[2] L. Boyer, Y. Esposito, A. Habrard, J. Oncina, and M. Sebban. Sedil: Software for edit distance learning. Lect. Notes Comput. Sci., 5212 LNAI(2):672–677, 2008.
4FE4S_FERREDOXIN ADH_SHORT
(a) Distances with standard scoring
4FE4S_FERREDOXIN ADH_SHORT
(b) Distances with adapted scoring
Figure 4: t-SNE visualizations of pairwise distances from theProtein data set: the adapted scoring (right) yields more class separation than standard scoring (left).
[3] T. G¨artner, G. Garriga, and T. Meinl, editors. Proc. of The Workshop on Mining and Learning with Graphs, 2006.
[4] A. Gisbrecht, B. Mokbel, and B. Hammer. Relational generative topographic mapping.
Neurocomputing, 74(9):1359–1371, 2011.
[5] A. Habrard, J. I˜nesta, D. Rizo, and M. Sebban. Melody recognition with learned edit distances.Lect. Notes Comput. Sci., 5342 LNCS:86–96, 2008.
[6] B. Hammer and A. Hasenfuss. Topographic mapping of large dissimilarity data sets.
Neural Computation, 22(9):2229–2284, 2010.
[7] B. Hammer, D. Hofmann, F.-M. Schleif, and X. Zhu. Learning vector quantization for (dis-)similarities. Neurocomputing, 2013. In Press.
[8] B. Hammer, B. Mokbel, F.-M. Schleif, and X. Zhu. White box classification of dissimi-larity data. InHAIS, volume 7208 ofLNCS, pages 309–321. Springer, 2012.
[9] M. K¨astner, D. Nebel, M. Riedel, M. Biehl, and T. Villmann. Differentiable kernels in generalized matrix learning vector quantization. InICMLA, p. 132-137, 2012.
[10] S. Kirstein, A. Denecke, S. Hasler, H. Wersing, H.-M. Gross, and E. K¨orner. A vision architecture for unconstrained and incremental learning of multiple categories.Memetic Computing, 1(4):291–304, 2009.
[11] C. Lundsteen, J. Phillip, and E. Granum. Quantitative analysis of 6985 digitized trypsin G-banded human metaphase chromosomes. Clin. Genet., 18:355–370, 1980.
[12] B. Mokbel, B. Paassen, and B. Hammer. Adaptive distance measures for sequential data. In M. Verleysen, editor,ESANN, pages 265–270. i6doc.com, 2014.
[13] B. Mokbel, B. Paassen, and B. Hammer. Efficient adaptation of structure metrics in prototype-based classification. In S. Wermter, C. Weber, W. Duch, T. Honkela, P. D. Koprinkova-Hristova, S. Magg, G. Palm, and A. E. P. Villa, editors, Artificial Neural Networks and Machine Learning - ICANN - 24th International Conference on Artificial Neural Networks, Hamburg, Germany, September 15-19, 2014, volume 8681 ofLecture Notes in Computer Science, pages 571–578. Springer, 2014.
[14] E. Pekalska and B. Duin. The Dissimilarity Representation for Pattern Recognition. Foundations and Applications. World Scientific, 2005.
[15] F.-M. Schleif, B. Hammer, M. Kostrzewa, and T. Villmann. Exploration of mass-spectrometric data in clinical proteomics using learning vector quantization methods.
Briefings in Bioinformatics, 9(2):129–143, 2008.
[16] P. Schneider, M. Biehl, and B. Hammer. Adaptive relevance matrices in learning vector quantization.Neural Computation, 21(12):3532–3561, 2009.
[17] V. Sperschneider. Bioinformatics. Springer, 2008.
[18] A. Takasu, D. Fukagawa, and T. Akutsu. Statistical learning algorithm for tree similarity. InIEEE Int. Conf. on Data Mining, ICDM, pages 667–672, 2007.
[19] L. van der Maaten and G. Hinton. Visualizing high-dimensional data using t-sne.Journal of Machine Learning Research, 9:2579–2605, 2008.