Scholarship@Western
Scholarship@Western
Electronic Thesis and Dissertation Repository 1-31-2020 10:00 AM
A Visual Analytics System for Making Sense of Real-Time Twitter
A Visual Analytics System for Making Sense of Real-Time Twitter
Streams
Streams
Amir HaghighatiMaleki
The University of Western Ontario
Supervisor Sedig, Kamran
The University of Western Ontario Co-Supervisor Haque, Anwar
The University of Western Ontario Graduate Program in Computer Science
A thesis submitted in partial fulfillment of the requirements for the degree in Master of Science © Amir HaghighatiMaleki 2020
Follow this and additional works at: https://ir.lib.uwo.ca/etd
Part of the Artificial Intelligence and Robotics Commons, Computer and Systems Architecture
Commons, Databases and Information Systems Commons, Numerical Analysis and Scientific Computing Commons, Other Computer Engineering Commons, Science and Technology Studies Commons, Social Statistics Commons, Software Engineering Commons, and the Systems Architecture Commons Recommended Citation
Recommended Citation
HaghighatiMaleki, Amir, "A Visual Analytics System for Making Sense of Real-Time Twitter Streams" (2020). Electronic Thesis and Dissertation Repository. 6809.
https://ir.lib.uwo.ca/etd/6809
This Dissertation/Thesis is brought to you for free and open access by Scholarship@Western. It has been accepted for inclusion in Electronic Thesis and Dissertation Repository by an authorized administrator of
ii
Through social media platforms, massive amounts of data are being produced. Twitter, as one such platform, enables users to post “tweets” on an unprecedented scale. Once analyzed by machine learning (ML) techniques and in aggregate, Twitter data can be an invaluable resource for gaining insight. However, when applied to real-time data streams, due to covariate shifts in the data (i.e., changes in the distributions of the inputs of ML algorithms), existing ML approaches result in different types of biases and provide uncertain outputs. This thesis describes a visual analytics system (i.e., a tool that combines data visualization, human-data interaction, and ML) to help users make sense of the real-time streams on Twitter. As proofs of concept, public-health and political discussions were analyzed. The system not only provides categorized and aggregate results but also enables the stakeholders to diagnose and to heuristically suggest fixes for the errors in the outcome.
Keywords
Visual Analytics, Stream Processing, Real-Time Twitter Analysis, Human-Information Interaction
iii
Summary for Lay Audience
Through social media platforms, massive amounts of data are being produced. Twitter, as a microblogging social media platform, enables users to post short updates as “tweets” on an unprecedented scale. Once analyzed by using machine learning (ML) techniques and in aggregate, Twitter data can be an invaluable resource for gaining insight. However, when applied to real-time data streams, due to covariate shifts in the data (i.e., changes in the distributions of the inputs of ML algorithms), existing ML approaches result in different types of biases and provide uncertain outputs. This thesis describes a visual analytics system (i.e., a tool that combines data visualization, human-data interaction, and ML) to help users monitor, analyze, and make sense of the streams of discussions on Twitter in a real-time manner. This system helps the users to understand “who” is talking about “what” and “how” and/or “why” a tweet is posted. As case-studies, we use public-health and election discussions to demonstrate the capabilities enabled by the system. The system then not only provides categorized and aggregate results of such discussions but also enables the stakeholders to diagnose and to heuristically suggest fixes for the errors in the outcome, resulting in a more detailed understanding of the discussions.
iv
Acknowledgments
Words cannot describe my gratefulness to my wonderful supervisors, Dr. Kamran Sedig and Dr. Anwar Haque.
I would like to specifically express my sincerest gratitude to Dr. Sedig without whose exemplary, sound advice this work would not have been possible. I am truly indebted to your dedication, life-lessons, and fatherly mentorship. No one can hope for a better supervisor. I am also thankful to Wenjun Chen for her generous help during the initial course of this project.
Finally, I offer my deepest gratitude to my parents, Rahele and Akbar, without whose sacrifices and vision of the future, I could not even be where I am today.
v
Table of Contents
Abstract ... ii
Summary for Lay Audience ... iii
Acknowledgments... iv
Table of Contents ... v
List of Tables ... vii
List of Figures ... viii
List of Appendices ... x
Chapter 1 ... 1
1 Introduction ... 1
1.1 Twitter: a Microblogging Platform ... 2
1.2 Usages and Challenges ... 4
1.2.1 Twitter for Health Research ... 6
1.2.2 Twitter for Election Campaigns ... 7
1.3 Constraints on Data Collection ... 8
1.4 Research Questions ... 10
Chapter 2 ... 12
2 Background ... 12
2.1 Approaches for Twitter Data Analysis ... 12
2.1.1 Assessing “who” ... 13 2.1.2 Assessing “what” ... 14 2.1.3 Assessing “how” ... 14 2.1.4 Assessing “why” ... 15 2.2 Stream Processing ... 16 2.2.1 Covariate Shift ... 19
vi
2.3 Visual Analytics ... 20
2.3.1 Computational Tools and Techniques ... 21
2.3.2 Visualizations ... 21
2.3.3 Interactions ... 22
2.3.4 Human-Information Interaction ... 22
Chapter 3 ... 23
3 System Design ... 23
3.1 Data Flow Design: Pipeline Architecture ... 24
3.1.1 Pre-Processor ... 26
3.1.2 Sentiment Analyzer ... 27
3.1.3 Label Predictor (Classifier) ... 27
3.2 Interface Design ... 30
3.2.1 A Progressive Web Application... 30
3.2.2 Analytics Page ... 32 3.2.3 Compare Page ... 34 3.2.4 Shuffler Page ... 36 3.3 Case Studies ... 43 3.3.1 Public-Health Research ... 44 3.3.2 Political Debates ... 49 Chapter 4 ... 52 4 Conclusion ... 52 4.1 Discussion ... 52 4.2 Future Research ... 53 References ... 55 Appendices ... 61
vii
List of Tables
Table 1: A taxonomy of approaches for Twitter usage as a data source for health research
[12] ... 7
Table 2: Eight Rules for Real-Time Stream Processing Systems [41]. ... 17
Table 3: Implemented rules for the pre-processing component. ... 26
Table 4: Implemented sentiment analysis techniques ... 27
Table 5: Initial list of content themes gathered from a previous health-related research ... 29
Table 6: Initial list of content themes gathered from a previous health-related research ... 29
viii
List of Figures
Figure 1: A typical stream processing system viewed from systems perspective [33] ... 16
Figure 2: Data flow design from a source to an interface ... 25
Figure 3: An example of using multiple methods for data processing at each stage ... 25
Figure 4: Lifecycle of a Vue.js component [58] ... 31
Figure 5: The top portion of page Analytics ... 32
Figure 6: The bottom portion of page Analytics ... 32
Figure 7: A sample configuration of heat-map for hybrid analysis ... 33
Figure 8: Scroll bar for determining the number of comparisons ... 35
Figure 9: Side-by-side compare and contrast... 35
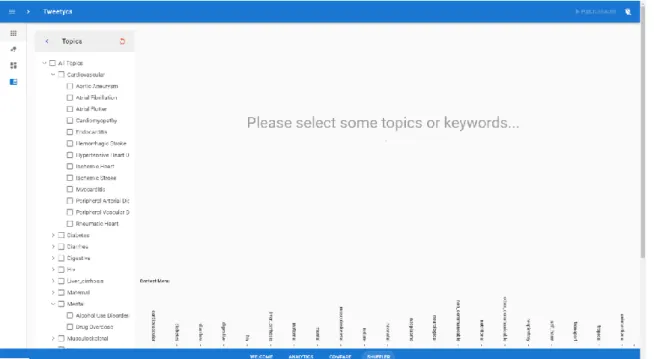
Figure 10: Initial configuration of shuffler page ... 36
Figure 11: Selective filtering of topics/sub-topics ... 37
Figure 12: An example track of tweets ... 37
Figure 13: Drilling down a tweet to view the already performed analyses (sentiment and classification) ... 38
Figure 14: Tweet selection mechanism for a more detailed exploration ... 39
Figure 15: Focused compare and contrast using the context map ... 40
Figure 16: Error-correction mechanism on the interface ... 41
Figure 17: Custom labeling process as a sub-component of the label-predictor component . 42 Figure 18: Menus for performing case-studies ... 43
ix
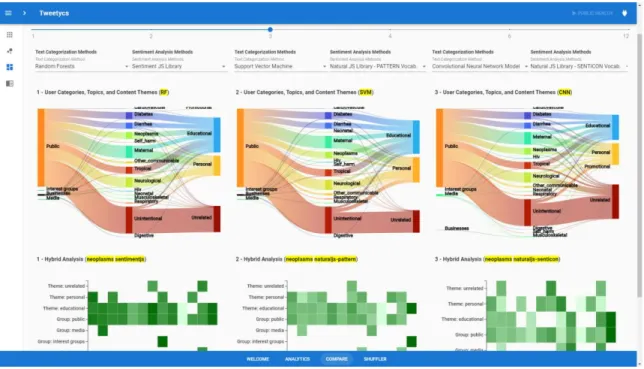
Figure 19: Different configurations of the Sankey diagram are caused by the the different
chosen analytical approaches ... 45
Figure 20: Highlighting a user group on the Sankey diagram by hovering the mouse pointer over it ... 45
Figure 21: Highlighting a content theme and the related topics associated with it ... 46
Figure 22: Highlighting a topic and the user groups and the content themes that are associated with it ... 46
Figure 23: Hybrid analysis using a heat map ... 47
Figure 24: Identifying the most influential user and their recent tweets ... 48
Figure 25: Compare page, providing the existing functionalities along with the ability to juxtapose the results ... 48
Figure 26: Track structure for tweet collections ... 49
Figure 27: Drilling down a tweet to see the more detailed information ... 50
Figure 28: Further filtering the tweets using a context map ... 50
Figure 29: Tweet label editing dialogue and the consequent changes as a result of custom labeling ... 51
x
List of Appendices
Chapter 1
1
Introduction
Social media platforms allow users to be both active consumers (readers) and producers (authors or editors) of data, at the same time. Users of such platforms (individuals, businesses, news agencies, academics, governments, etc.) can express their viewpoints and comments on topics of interest. Meanwhile, they can also benefit from the existing discourses by analyzing the discussions, posts, and/or comments in order to identify important expressions of such discussions. Microblogging, provided by a variety of such platforms (e.g., Facebook, GNU social, Micro.blog, Tumblr, and Twitter), refers to the activity that users broadcast brief updates about various events and topics [1]. Depending on the features provided by the platforms, these updates may include various combinations of text and multimedia content (e.g., videos, images, hyperlinks).
Microblogging is used to achieve a wide variety of social purposes such as education, product/service review, everyday communications, and news broadcasting [1-3]. Moreover it has been quickly gaining popularity as an option for online social networking. This new style of communication has shown unprecedented levels of uptake and growth. For example, in the first quarter of 2018, the number of monthly active users on Twitter broke the 330 million threshold worldwide and the number of tweets published per day reached 500 million [4-5]; a number that is still growing. These characteristics turn Twitter into a platform that provides instant access to public opinions on almost any topic of interest at a global scale.
Research has shown that Twitter is a reliable source for tracking public opinion about various topics, ranging from political issues and journalism [6-10] to crises and emergencies [11], from public and personal health issues [12, 13] to even brand sentiments [3, 14]. This reliability makes the publicly available Twitter data an invaluable resource for mining interesting and actionable insights. Furthermore, literature suggests that computational mechanisms, such as machine learning (ML) techniques and algorithms, can enhance the ability of the analyst to have an overview of the data in aggregate form and
form a high-level mental-model of the underlying discussions [15]. However, should Twitter data be taken into account and get processed as batch datasets stored in files or databases during a specified period of time, the problem at hand would lose its real-time aspect and thus would not be applicable to real-world scenarios.
Using various ML algorithms and techniques will result in different accuracies for different datasets. Furthermore, analyzing the sheer number of tweets in bulk, using multiple ML techniques, will result in varying accuracies. Based on the characteristics of the content of tweets and also the complexity of models, when trained and tested against Twitter data, some ML models may show better accuracies compared to the other ones [16]. Also, if applied to a real-time data stream, due to changes in the distribution of the incoming data, some models might predict totally obsolete results after some time [17, 18].
In this chapter we will first discuss the importance of Twitter as a social media platform and will compare it to other traditional online discussion forums. Next, in Section 1.2 we will briefly have an overview on the usages and challenges of Twitter data streams. In Section 1.3 we will introduce the challenges of data collection and their implications on this research. Finally, in Section 1.4 we will introduce the concept of visual analytics systems and their importance in the context of this study and we will discuss the research questions that this thesis is trying to address.
In Chapter 2 we will examine the literature regarding each of the concepts introduced in the first chapter and extract the necessary requirements for our system. In Chapter 3 we will focus on the technical details of the system built using the requirements introduced in Chapter 2. Finally, in Chapter 4 we will discuss the novelty of this research and try to conclude by providing answers to each research question posed above.
1.1
Twitter: a Microblogging Platform
Microblogging refers to the activity of users broadcasting brief and summarized expressions, updates, and sentiments about various on-going events and/or discussions [1]. As mentioned in the above introduction, based on the features provided by such platforms, these expressions can include multimedia content. Video and audio files, images,
hyperlinks, emoticons (emotion icons), and other digital content types can be incorporated within these expressions and utterances. Microblogging is being used for a wide range of social purposes and as an option for online social networking, has been quickly gaining popularity [19].
Launched in 2006, Twitter is a microblogging website, which enables users to post messages, named “tweets”, of up to 280 characters in length (prior to 2017, the limit was 140 characters) [20]. Unlike social media platforms such as Facebook, Twitter’s friendship model is directed and unilateral. Users can follow whomever they want, but those they follow do not have to follow them back. “Timelines” are provided to view tweets posted by users: when one user follows another, the latter’s tweets will be visible in the former’s ‘timeline’. Accessing tweets, however, does not depend on following other users: Twitter is an open platform, therefore by default tweets are public and can be discovered through Twitter search tools. The one exception to this is the direct message (DM), which is private, and can be seen only by the user to whom it is sent. Direct reference/citation to other users can be done through the mention convention, where a username, prefixed with a ‘@’ character, is included anywhere within a tweet’s text content. Users, referenced as such, will be notified of the tweet that mentioned them. Users can also opt to make their account private, in which case they can selectively approve who would be able to access and view their tweets.
Similar to Twitter, traditional online forums also provide a platform for expressions and updates. Pendry et al. [21] argue that online discussion forums have benefits at individual and society level. They also note that due to the richness of the content of online discussion forums, these forums are of greater applied importance than has been realized. However, due to the manifold types of forum hosts, overlaps in the discussed topics, numerous varieties of rules and regulations, and multiplicity in forms and data structures of the available content, in order to analyze, understand, gain insight into, and make sense of the online discussions on a given topic, one has to traverse through heterogeneous webs of forums and online discussions [22]. Meanwhile, some comments might be outdated, some might be unrelated, credibility of the sources can be vague, and most importantly, having a comprehensive understanding of the overarching big picture of the discussions and
identifying the main role players in the discourses can be a time-consuming task to perform. On the other hand proliferation of smartphones has further pushed users to use mobile applications and thus, facilitated the use of social media in general, and Twitter in particular – a blessing that traditional forums seem to be deprived of. As a result, more users are communicating without the existing limitations on online discussion forums regarding time, location, or device of connectivity [10].
Tolmie et al. in a recent research article [23] indicate that although there are some similarities between Twitter discussions and discussions on existing traditional online forums, discussions on Twitter, are “a wholly distinct social phenomenon requiring an independent analysis that treats them as unique phenomena in their own right, rather than as another species of conversation that can be handled within the framework of existing conversation analysis.”
Given these differences, it seems that for a valid analysis of the content shared on Twitter, one must consider both the big volume of data originating from its only source, namely Twitter application programming interface (API), as well as the ever-changing and summarized aspect of the content (i.e., tweets).
1.2
Usages and Challenges
Being a publicly accessible social media platform, users can use Twitter for various ends. Individuals can express their opinions on different topics, ranging from everyday life issues to a popular discussion (i.e., a trend) in a locality (i.e., a community or a group of users being similar with regard to some aspects). Due to its widespread use, news agencies can reach out to a broader audience each day. Businesses and corporations can expand their consumer markets by promoting their products and services in novel forms. Content producers, authors, and researchers can promote their works to a wider range of people and in new formats. All of these usages focus on the ability of the users to write and “post” tweets to Twitter information space and contribute to the online discussions.
On the other hand, this vast space of information, which is being updated by many tweeters (i.e., contributors to the information space of Twitter) at an unprecedented scale, if
analyzed properly, can help to gain insights into “what is happening in the world” [4]. Social scientists, for example, can observe the discussions on a given topic and construct a lens through which they can better understand the public’s perception of the given issue. Brands and businesses can measure their customers’ satisfactions based on the on-going discussions. Politicians can observe the urgent needs of the people they represent and use this insight in their policy-making processes. Examples of these type rely on the ability of the users to “retrieve” and read tweets in bulk, through Twitter’s API.
However, the sheer number of tweets present challenges for the analysts as they seek to use Twitter to improve their knowledge and gain insight. Furthermore, observational studies on various topics on Twitter show an abundance of different kinds of discussions taking place on Twitter: they can be expressed in both formal and informal formats [24] (e.g., tweets posted by an individual versus a news agency). Also, intentions can sometimes be misguiding and the misunderstandings due to the short length of content can sometimes arise. Given the number of contributors and the complexity of discussions, while following a particular Twitter account may be beneficial for learning about a particular context, news trend or an event, for users who want to obtain a high-level understanding of a social discourse and a big-picture of the on-going discussion, challenges abound.
In order to gain a high-level understanding of a particular Twitter discussion, it seems useful to identify latent themes of the tweets and groups of users, understand the overall and particular sentiments, distinguish most relevant tweets, discern most important users, and recognize sub-topics being discussed under a given subject (topic) [8, 11-13]. The existing literature demonstrates that there are tools developed in order to enable their users to do a subset of the aforementioned tasks, but not all of them at once.
The complexity of data structures and data processing techniques can add to the complexity of such tools. Also, the brevity of the content of a tweet can result in its true meaning being distorted and possibly taken out of context [25]. In addition, due to the real-time nature, the quality of the input data is highly variable, and it is possible for ML models and data processing techniques to poorly act upon them. Furthermore, the identity and the
background of the tweeter (i.e., who is tweeting), which is an important clue in assessing information credibility, is not always known [26]. Therefore, besides the aforementioned tasks, in order to increase the accuracy and the validity of such an analysis, one has to take into account not only the content of tweets, but also other characteristics related to the authors of the tweets and their backgrounds in other discussions. In short, a more comprehensive analysis should take place.
In order to provide examples for such tasks and challenges and also further examine the shortcomings of the existing systems and approaches, in the following sections of this chapter we will briefly discuss two use-cases of Twitter: health research and election campaigns.
1.2.1
Twitter for Health Research
Assessment and monitoring of the health of communities and populations at risk to identify health problems and priorities have been one of the many research areas for public health researchers [27]. In recent years, researchers have recognized that social media platforms, such as Twitter can also provide data about population-level health and behavior. For Twitter to be an effective tool for health-related research, stakeholders (people, organizations, doctors, etc.) need to be equipped to understand and appraise health information on the platform [28].
In a systematic review on 137 peer-reviewed research studies that used Twitter to conduct health research, Sinnenberg et al. reported that Twitter API has been used primarily as a data source for further content analyses, as a platform for recruitment/intervention, or a combination of both [12]. They also reported that of the 137 peer-reviewed articles, 108 (78%) mainly were focused on analyzing tweets based on their content (the rest were studies that primarily utilized the Twitter platform for their research and did not focus on content analysis). Collectively, these 108 articles represented more than 5.1 billion analyzed tweets. Table 1 shows a taxonomy driven from this study.
Tweet content analysis, trend surveillance and prediction, engagement and impact factor review, and relationships and network analysis are generalized approaches of researchers
for using Twitter data. In up to 96% of such research articles, these approaches were carried out by implementing ML and NLP techniques. Such techniques were used to classify content and/or relationships, as well as to measure sentiments.
Table 1: A taxonomy of approaches for Twitter usage as a data source for health research [12]
Taxonomy Description Articles
No. (%) Content
Analysis
Assessment of body of tweets for themes and sentiments related
to a specific subject 77 (56)
Surveillance and Prediction
Monitoring Twitter traffic for mentions of a particular topic
and/or predicting future trends based on current discussions 36 (26)
Engagement
Assessing impact of discussions on Twitter by analyzing presence of an account, number of retweets, favorites, followers,
etc.
19 (14)
Network analysis
Assessing the relationship and interactions between Twitter users
about a certain topic 5 (4)
Total - 137 (100)
This study also shows that the number of Twitter-based health research is growing--approximately a two-fold increase in number of publications, each year. Furthermore, given their diverse funding sources, studies that examine Twitter’s role in public health are increasingly being encouraged by various organizations and institutes. However, it must be noted that most of such studies have used batch processing methods and discarded the real-time aspect of Twitter streams. Colditz et al. point out technical difficulties of combining the existing ML techniques with stream processing approaches and mention that methodological considerations must be taken into account when aiming towards real-time content analysis in public health [29].
1.2.2
Twitter for Election Campaigns
In their recent study, Yaqub et al. [10] have reported a strong correlation between citizen’s opinions on and sentiments towards Twitter discussions in political debates and the real world results of the 2016 presidential election in the United States of America. In a systematic literature review, Jungherr reviewed the existing literature regarding election campaigns and Twitter [8] and he observed that “the literature on various uses of Twitter in politics has become too numerous to cover all areas in one review.” Jungherr reviewed
127 peer-reviewed research publications examining the use of Twitter during election campaigns and related events. Elections in 26 countries have been subjects to such studies. It has been reported in this study that Twitter was mainly seen to be used in three forms: a) usage by parties and candidates to effect public opinions, b) usage by vocal, i.e., interested, public to express sentiments, and c) usage during or after major events, e.g., a debate, by any user. Within each of these categories, researchers have conducted different analyses and found out many interesting points. Similar to public health researchers, here too, ML and NLP techniques were used by researchers in order to process the content of tweets, summarize them and obtain computed features/statistics from them. Similar to public health, in 106 of the articles (83%) batch processing techniques were used and real-time aspect of Twitter was not greatly appreciated by the remaining 21 articles.
1.3
Constraints on Data Collection
Data collection is one of the key steps for Twitter analysis. The quality of the data acquired for analysis can have great effects on the results. Throughout the literature, noise has been regarded as a negative contributor to data quality. Moreover, the dynamic nature of the Twitter discussions provides a particular challenge with regards to their accuracy, consistency and reproducibility [30]. Most of the free APIs, including that of Twitter, do not provide the users with noise-less or quasi-high-quality data. Nevertheless, although it is possible to obtain high quality data by purchasing from commercial data vendors, the use of freely available Twitter API seems more suitable for research purposes [31]. Twitter’s public APIs allow extraction of both past messages and real-time data feed, but there are some constraints with both of the approaches:
- Twitter representational state transfer (REST) API can be used to extract past tweets and is 100% free of charge. Regarding the acquisition period they present certain limitations. API calls are limited to 350 queries every 15 minutes per user account, or 3500 total tweets per REST query, whichever comes more restrictive. It is through this API that developers query Twitter’s databases for data
corresponding to specific parameters, such as tweets containing specific keywords or hashtags, or tweets posted by particular users.
- Twitter streaming API provides the users with real-time access to tweets in sampled and filtered form. The streaming API delivers a non-representative sample of tweets posted on Twitter. The consequences of this skewed sample for research on the uses of Twitter in different discussions have not yet been examined thoroughly [11]. Nonetheless, the fact that there is a quality gap between real on-going discussions on Twitter and the publicly available data streams used for analyzing could serve as an indicator that the mode of access chosen for research might result in somewhat different datasets and, as a consequence, potentially in divergent findings.
Because of the high volume of tweets, the rate at which they are created, and the constantly digressing topics latent within each tweet, twitter data are best modeled as a data streams [32]. This suggests some challenges since many of the traditional batch processing methods fail when it comes to data stream processing. The stream of tweets is potentially unbounded in size: algorithms used in such an environment have restrictions on memory usage. The high volume of the incoming tweets requires the algorithms to process them in a single-pass and non-blocking manner. Thus, they must process each data instance quickly enough to avoid any blockage or congestion in the receiving buffer and accordingly, load balancing becomes another challenge.
A data-stream processing engine contains pipeline-like structures to increase efficiency and overcome some of these challenges [33]. It also, reverts the frame/paradigm of conventional database management systems. Instead of responding to and processing queries based on a static, bounded data set (just like any other typical database), a stream processing engine has to effectively process a static set of queries and procedures, usually incorporated within a pipeline structure, over continuous streams of data [34]. The high data rates of streaming data might outstrip processing resources (both CPU and memory); in addition, coupled with the need for real-time results, the need of having access to secondary (disk) storage becomes completely infeasible.
The existing literature suggest that Twitter data can be best modeled as the data stream model [32]. In this model, tweets as streams of data, arrive at high speeds and in large volumes, and data mining algorithms must be able to process/predict/analyze the incoming tweets in real time and under strict constraints of space and time. Processed and mined properly, these streams could make it possible to “know what is happening in the world” in real-time [4]; both at micro (individual, small regions, brief subtopics) and macro (group, diverse communities, extended social discourses) levels, regarding any potential subject matter.
Due to its ever-changing nature, changes in the distributions of the incoming data are inevitable. Therefore, dataset shift becomes a problem in designing such systems. In a machine learning configuration, dataset shift occurs when the testing (unseen) data experience a phenomenon that leads to a change in the distribution of a single feature, a combination of features, or the class boundaries. As a result the common assumption that the training and testing data follow the same distributions is often violated in real-world applications and scenarios [17].
1.4
Research Questions
Visual analytics systems (VASes) are computational tools that combine data processing and ML techniques, data visualization, and human-information interaction [35-37]. VASes allow their users to interactively control data processing methods and data visualizations to change how data is analyzed and presented to them, thus enabling them to enhance their understandings easily in complex scenarios. Otherwise the myriad types of data structures and complex data processing methods would not allow them to do so.
The research questions that this thesis examines are as follows:
1- Is it feasible to integrate machine learning algorithms and natural language processing (NLP) techniques, stream processing approaches, data visualizations, and human-data interaction in a real-time manner to develop a VAS?
2- Can such a VAS be scalable so as to plug-in different ML techniques and approaches?
3- Can such a VAS help with the surveillance and sense-making of the online discussions on Twitter without confining it to a pre-defined static topic?
Chapter 2
2
Background
Social media platforms enable users to perform a variety of tasks ranging from mainstream blogging to communication. Two types of research questions seem central to social media: a) those relating to social media use itself, and b) those that inform our understanding of social phenomena [38]. Reviewing the literature shows that the majority of the existing research related to Twitter, as a social media platform, have focused on questions relating Twitter itself. These studies examine the analysis of a curated collection of tweets on some topics of interest as batch datasets. These datasets are gathered after a specific occasion or during a period in the past and are regarded as historical data. In this chapter, in Section 2.1 we will review the details of such approaches and examine their advantages and disadvantages in various types of analyses. In Section 2.2 we will discuss the details of stream processing systems. In Section 2.3, we will also look into some of the properties and details of VAS and their utilities under complex scenarios where existing traditional approaches often fail to provide a consistent solution for a comprehensive analysis.
2.1
Approaches for Twitter Data Analysis
When it comes to discussion analysis on Twitter, both quantitative and qualitative modeling of the expressed comments (i.e., tweets), as well as the contributors, become important [39]. Assessing the validity of arguments, discerning the most and the least significant contributors, Understanding the sequence and the network of communications, identifying themes and intentions of an utterance, and reviewing the identities and the backgrounds of contributors are examples where one or both of these modeling approaches can be used to enhance the outcome. These modeling approaches, alongside the outcome of their analyses, can also be regarded as input for further advanced analyses [38,40]. By reviewing the literature it could be noted that in order to abstract most of the existing approaches, proposed for Twitter analysis, the analyst is ultimately trying to address the following questions [8, 11-13]:
- “Who” is discussing about a topic?
- “What” is being discussed?
- “How” does a comment get expressed?
To come to a conclusion about each of the above, different strategies can be used which will result in multiple scenarios for Twitter analysis. Although these questions are seemingly different ones, answering them and designing strategies to assess them can result in overlapping scenarios where in trying to address one question, others will be implicitly addressed, as well. Throughout the rest of this section, we will read short descriptions and some background information about each of the proposed assessments.
2.1.1
Assessing “who”
The identity and characteristics of the contributors can help the analyst address this question. By knowing who is making a comment, the analysis can be further enriched in details with regards to groups and communities of users [8]. Both qualitative and quantitative aspects can be of great importance.
Affiliation with a specific organization, a social class, a community, or generally a group can determine the credibility of the expressions in each discussion. Also, the background of users in terms of previous tweets can be used as an indication of their significance. Moreover, the role of the person in any given group can further expose hidden aspects of the expressions made by a user which directly relates to “why” a comment has been expressed. Some users might use multiple types of symbolisms (e.g., symbols as profile pictures, user descriptions as autobiographies, pinned tweets) in order to identify with a specific group. Gender as well as location (city, country, region, continent, etc.,) can also contribute to a particular point of view within discussions: identifying cultural clues in “what” being expressed and “how” it gets expressed.
Engagements and popularity measurements for a user can indicate the significance of that user in a discussion. Measures for the numbers of tweets, followers (people being followed by the given user), following (people who follow the given user), and retweets that a user gets are all among the characteristics that can be used in order to further assess and analyze the role of the users in discussions.
Some of the aforementioned characteristics are immediately available by acquiring the tweet, but some are derived attributes. Group affiliation for example can be determined as the result of inputting immediately available features such as ‘description’, ‘pinned tweet’
‘location’ and ‘gender’ of a user to a pre-trained1 model or to a clustering algorithm2.
Various ML and NLP techniques, alongside the metadata about the author of a tweet, can be used to derive such characteristics.
2.1.2
Assessing “what”
Identifying the topic(s) of interest in any given discussion can help the analyst to develop richer mental-models of the content. As a simple breakdown, we can consider that topics can consist of subtopics and under each topic/subtopic there can be threads of arguments. Diverse viewpoints can enrich the informativity of a discussion [11].
Through providing keywords or search terms, initial filtering can be done on the incoming tweets to discern and identify the underlying topics. Each topic can then get refined to fine-grained subtopics. Doing this will help the analyst to build tracks for each topic and distinguish expressed tweets and active users in each track, while keeping in mind the general, more abstract, idea of the overarching discussion. These topics and subtopics can be extracted using only keywords, hashtags, and search terms, which are available in the content of a tweet, or can be derived by employing computational (e.g., ML and NLP) techniques to analyze the textual as well as the multimedia content of a tweet.
Discerning the topics and dividing subtopics into compartments can also empower the analyst in identifying “how” and “why” a specific expression is being made. In some topics, e.g. political debates, the dynamics of the expressed sentiments and the underlying intentions would be worth considering, while in some, e.g. cancer treatments, focusing on the general trend of the content of tweets can be of significance [13].
2.1.3
Assessing “how”
While expressing comments, users might express information in both formal and informal ways. Also, these expressions can be made with positive or negative sentiments. Knowing
1 Referring to supervised learning techniques.
the way in which an expression is made can further enhance the mental-model of the analyst to get more information about the author of the tweet as well as generalizations about the aspects of a topic.
Users can express an argument in response to another idea (i.e., a retweet with quote or a reply) or they can open up the floor for a new idea (i.e., a normal tweet). Expressions (tweets) can include references to other users (mentions or replies) to invite them to participate or to be considered (e.g. as an answer to a previous tweet). Emoticons, images, videos, and hyperlinks can be used in conjunction to express connotations (emotions, metadata, etc.). Tweets, retweets, and replies can be expressed with large or tiny time gaps, depending on the popularity of topic.
ML and NLP techniques, again, can be used to extract some of the inherent characteristics, e.g. sentiment and factual information, of a tweet. By doing so one can gain further insight into “who”, “what”, and “why” questions as well.
2.1.4
Assessing “why”
The underlying intentions of expressions can further empower the analyst to determine the credibility or informativity of an expression within a specific context. Recently, for instance, fake news and spam content are becoming more and more widespread on Twitter, and on social media in general [10]. As another instance, news agencies, pharmaceutical companies, medical, and educational institutions are spreading educational content to increase awareness about dietary habits and its effects on cancer-prevention [6]. Implications of such intentions, if identified properly, could lead to manageable social transformations in various areas of everyday life [15].
Twitter allows users to participate in any discussion, globally. On such a scale, different backgrounds of participants will result in diverse viewpoints and therefore, different interpretations and reactions. Users can interpret a tweet posted by a news agency as educational, meant to increase awareness, or oppositely, as biased information, meant to mislead.
The underlying intensions also demonstrate the attitudes of participants and can gain insight into “how” different groups of people think about particular subject matters. Also, it can help to deepen our understanding of “who” is posting and “what” is the content. Similar to the above assessments, using various computational techniques can help the analyst to assess and address this question more elaborately.
2.2
Stream Processing
In computer science literature, stream processing is used generically to refer to the study of approaches for processing data flows. Viewed from a systems perspective, stream processing can be regarded as the study of subsystems and their interconnections incorporated within a larger system for processing data flows, i.e. data streams. Each subsystem is designed to compute in parallel and to communicate to other nodes. Depending on their role, subsystems can be of three kind: a) sources that receive and pass input data to inner subsystems; b) filters that perform some computation; and c) sinks that pass data to output feed [33]. Stream processing systems are often visualized as directed graphs. A typical example of such a system with three source, two sink and five filter subsystems (nodes) is represented in Figure 1.
Data streams can have great magnitudes in velocity, volume, and/or variety3. Furthermore, and more recently, these characteristics have been refined to include exhaustive (having a wide scope), detailed (being fine-grained in resolution), relational (having common field in conjunction with other data), and flexible (holding the traits of extensionality and scalability) aspects of such data [42]. Such characteristics can render specific design requirements for each subsystem (nodes) as well as the interconnections (links) between them. Pipelining4 these nodes will result in stages for processing the input stream in order to bring about the desired output and form the larger system which is referred to as the stream processing system.
Table 2: Eight Rules for Real-Time Stream Processing Systems [43].
# Rule Description
1 Keep the Data
Moving
To process messages “in-stream”, without any need for storage. Ideally, the system should use an active (i.e., non-polling) processing model.
2
Query Using SQL on Streams (StreamSQL)
To support a high-level query language with extensible stream-oriented primitives and operators.
3 Handle Stream
Imperfections
To have mechanisms to provide resiliency against stream “imperfections” (e.g. delayed, missing, or out-of-order data). 4
Generate Predictable
Outcomes
To guarantee predictable, deterministic, and repeatable outcomes.
5
Integrate Stored and Streaming
Data
To efficiently store, access, and modify state information, and combine it with live streaming data. For seamless integration, a uniform language must be used when dealing with either type of data.
6
Guarantee Data Safety and Availability
To ensure the availability of applications, and the integrity of the data maintained at all times, despite failures.
3
The well-renowned 3Vs of Big Data.
4 Pipelining is a technique where multiple instructions are overlapped during execution. A pipeline is
7
Partition and Scale Applications
Automatically
To have the capability to distribute processing across multiple processors and machines to achieve incremental scalability. Ideally, the distribution should be automatic and transparent.
8
Process and Respond Instantaneously
To have a highly-optimized, minimal-overhead execution engine to deliver real-time response for high-volume applications.
There have been attempts to adjust classical systems, such as database management systems (DBMS) or rule engines, so as to become more compatible with the stream-oriented characteristics [44]. However, they tend to fail in terms of the most important real-time processing requirements and processing stream-oriented workload.
As a guideline for designing and implementing real-time stream processing systems, Stonebraker et al. suggest eight characteristics “that a system must exhibit to excel at a variety of real-time stream processing applications” [43]. These characteristics can be regarded as general requirements or rules-of-thumb for designing any real-time stream processing system. They are summarized as rules in Table 2.
As mentioned in the previous chapter, Twitter provides developers with access to its real-time tweets. It requires users to establish and keep open an uninterrupted HTTP5 connection to access the most recent tweets. Tweets must be obtained by filtering. Keywords can be used as search criteria to filter tweets. Free accounts are supported to filter by up to 400 keywords on one connection; adjusting keywords requires the client program to restart and re-establish its connection to Twitter. Premium accounts, on the other hand, can request up to 250,000 keywords to be filtered from Twitter. Moreover, premium accounts can add/remove keywords, as filter rules, without disconnections and can adjust keywords seamlessly. In this project and for research purposes, the free version of Twitter API would suffice.
The term processing has been used here in a general sense to avoid specificity of the computational tools and techniques so as to provide an abstract view of these tools.
Nevertheless, given the current state of technology, the use of ML methods, specifically supervised learning techniques, and more specifically, classification6, seem to be inevitable in Twitter analysis. The online, ever-changing characteristic of Twitter’s discussions and its streams, therefore, will impose limitations with regards to the use of such computational tools. Dataset shift is a challenge apparent in stream processing, which causes invalid results in a deployed classifier. In the following section we will briefly discuss this phenomenon.
2.2.1
Covariate Shift
In the ML literature, training data and test data refer to the data available for building a model and the data on which the built model will be deployed, respectively. When the training data are not strictly representative of the test data, challenges arise. Considering the wide variety of neologisms and terminologies used to describe these challenges, in a comprehensive study, Moreno-Torres et al. [17] suggest generic definitions to capture the essence of what the existing research suggests. They begin by pointing out the components of a classification problem:
- A set of features or covariates: 𝑥 - A target variable (class variable): 𝑦 - A joint distribution: 𝑃(𝑦, 𝑥)
Dataset shift, they define, appears when the joint distribution in test data is different from that of in training data. That is, when 𝑃𝑡𝑟𝑎𝑖𝑛(𝑦, 𝑥) ≠ 𝑃𝑡𝑒𝑠𝑡(𝑦, 𝑥). In such cases, the accuracy of the trained model fluctuates dramatically. Different cases of the problem at issue can occur which are described in Appendix A: .
In a Twitter streaming set up, the distribution and the variety of the input tweets with regards to their content themes, user groups, and topics, are unknown and can change
6
Once again, we do not focus on the details of classifiers. A classifier might use a simple linear function as its model, while another could deploy a convolutional neural network. One has to look into current-day technology’s state-of-the-art approaches to determine these details in each application area.
anytime. These arbitrary and unpredictable changes in the distribution of the incoming data signify a particular type of dataset shift problems for Twitter streams: Covariate Shift.
Covariate shift can be noticed more vividly when we are using Twitter streams on a given topic: numerous users post tweets and express various viewpoints and the focus of the discussions, along with the used keywords, can change over time due to various arbitrary events (e.g. an earthquake in the midst of an electoral campaign). This shift can also violate the validity of data, since it tends to move the focus of data to a specific population, at each time [45, 46]. Covariate shift invalidates the output of classifiers and, consequently, poses challenges with regards to analytics based on the output.
In order to make sense of “who” is talking about “what”, and “how” or “why” they are talking on the subject matter, these streams must be processed--i.e., verified, normalized, categorized, summarized and expressed, in real-time. Identifying such stages and decomposing them to more concrete tasks, e.g. using a support vector machine as a classifier, is of necessity in designing the subsystems. Alongside, visualizations can be used to further enrich the analytical capabilities of the system. Having all of such capabilities under one umbrella, is a characteristic of visual analytics systems, the details of which have been discussed in the following section.
2.3
Visual Analytics
Visual analytics7 systems (VASes) are involved in supporting, scaffolding, and mitigating the execution and performance of complex cognitive activities. Combining visualizations, interaction techniques, computational tools, and analytical models, VASes are capable of providing both computational and cognitive possibilities. Not only through these possibilities is the user equipped with analytical tools but also a cognitive coupling of the system and the human user is created [36, 37, 43]. This allows the emergence of complex cognitive activities as a result of interaction and distributed cognition as suggested in [35].
7 From an etymological standpoint, analytics refers to the practice/art/science of a through and detailed
In a syncretic study, Sedig and Parsons [35] have presented an abstract framework for approaching the design of visualizations within a human-information interaction framework. Also, in another comprehensive study [48], the same researchers suggest a syncretic and coherent approach for interaction design called EDIFICE-AP8. Similar to [35], this research is also a part of a larger systematic framework for human-information interaction which enables the making of VASes.
2.3.1
Computational Tools and Techniques
Since computational tools help in reducing the cognitive load of the users and save them time and effort, their use in VASes is strongly advocated [47]. These tools are often constructed and utilized in an iterative and multi-step process of the progression of a data-intensive cognitive activity. From the viewpoint of VASes, the analytics component consists of various computational tools and analytical models. It is this component that processes the raw data and brings about high-level analytics.
Theoretically, this component is technology-independent and can include the use of simple and/or complex algorithms, external APIs, and any processing technique that fits best the needs of the application area. As mentioned in Section 2.1, classification and sentiment analyses are the two types required for a thorough analysis of Twitter discussions.
2.3.2
Visualizations
Data visualizations in a VAS can be visual representations of the information derived from the analytics component. Visualizations extend the capabilities of individuals to complete tasks by allowing them to analyze data in ways that would be difficult or impossible to do otherwise [36].
8 Epistemology and Design of human-InFormation Interaction in complex Cognitive activitiEs - Action
Nonetheless, we have to make a distinction. Regardless of the complexity, visualizations that do not supplement computational tools that allows them to be interactive, and to potentially perform computational and analytic operations, cannot be regarded as a VAS. Infographics and other static data representations are examples of such visualizations.
2.3.3
Interactions
When it comes to conducting complex analytical tasks, static visual representations are of no use. Designing interactions for specific activities with visual representations, therefore, becomes a problem that needs to be addressed in a coherent manner. The interactions of the components of the system must be solid and the system must seamlessly work. At the same time, the interactions of the human user with the underlying data must be designed in a way that enriches the users’ capabilities. In the next section we will discuss this subject, more.
2.3.4
Human-Information Interaction
As mentioned, visualizations, computational tools, and interactions mechanisms are combined and represented in a coherent manner in a VAS. Such possibilities are being utilized in an iterative and multi-step process of the progression of a data-intensive cognitive activity. One can regard these iterations as a discourse, i.e. a back and forth communication process between the user and the tool. As a result, the human user and the system will form a joint cognitive entity. The cognitive activity emerges as a result and from the whole process [48]. Therefore, the quality of the interaction is critical in determining the quality of the cognitive coupling [37]. The emergent nature of the cognitive activity and the quality of interaction, therefore, is one of the central issues in designing such a VAS.
Chapter 3
3
System Design
Translating Twitter data into actionable insights requires the analyst to be able to analyze the features of the sheer number of tweets in aggregate forms. In this regard, the metadata that is received from Twitter’s API, alongside the tweets, can be used to classify and categorize tweets. Such categorizations can essentially be generalized to be done by using two main types of features:
1- Features related to the author of a tweet (i.e., the tweeter); examples include:
a. Geographical location (country or city)
b. Impact factor(s) (number of followers, following, retweets, and mentions)
c. Affiliation with a group, social class, organization, etc.
2- Features related to the content of a tweet; such as:
a. The discussed topics (hashtags and keywords)
b. Content themes (the intention or the subject matter of the tweet which can be derived using NLP methods)
c. Expressed sentiments
d. Impact factor(s) (number of favorites and retweets)
Having an overview of the literature, it was demonstrated in the previous chapter that determination of these features for a specific tweet can be done directly through tweet’s metadata or through derivations and computations using various computational models (i.e., computational models with different complexities such as various ML models, proximity graphs, etc.). The latter sometimes requires mixing the available metadata with additional data derived from sources other than the tweet itself (e.g., the list of the users whom the author of a tweet follows or the average sentiment of all of the tweets of an author). Although using additional data sources other than the tweet in hand can help in deriving more detailed and more granular results, nevertheless the computational costs might increase as a result of increased complexity. For instance, to calculate the impact factor of a tweet a simple measure could be the number of retweets done on that tweet; while a more complex and detailed measure could be a weighted sum of the retweet count and the author’s overall impact factor – a measure which itself can be a result of multiple layers of computation.
Regardless of the computational methods used to derive these features, based on the aggregation methods used to summarize these features one can build different analytical approaches. Our focus in designing such a system for analysis is not to focus on the computational models; but rather, to
offer a generic stream processing system in order to incorporate any appropriate computational model so as to enable more comprehensive analyses given the above generalizations.
In this chapter we will examine the design of a VAS which provides its users with not only the ability to analyze the topics, user groups, and content themes in aggregate forms using various ML approaches and compare the results of each (e.g., deep learning techniques vs. linear models), but also enables them to suggest customized corrections for the errors resulted due to biases, concept drifts, covariate shifts, or other errors in the ML models. Furthermore, these aforementioned features are all being presented in real-time which further empowers the analysts to articulate and have instant access to actionable insights. In Section 3.23.1 we will see the pipeline designed to process the incoming streams from Twitter. In Section 3.2 we will see some of the functionalities offered by this tool. And finally, in Section 3.3 we will see two use-cases of this VAS as proofs of concept.
3.1
Data Flow Design: Pipeline Architecture
As mentioned in 2.2, stream processing systems are often described and understood in graph-like
structures where multiple components are concatenated and each is responsible for a specific task within the whole process. With such a break down, in order to provide real-time functionality, the system must also be able to publish its output as a data stream. This will result in another data stream dedicated for our usage. Subscribing to such a stream, the user interface is already fed with processed data in real-time. Tweets and any other data element mentioned in this chapter are all represented using JavaScript Object Notation (JSON).
In order to prevent overflows and keep the functionality, each component of such a structure must process its input data within a short time period. Furthermore, each component may offer various results according to the available technology/methods. Thus, in order to allow technology-independency these components consist of subcomponents that are implemented in an abstract level. Furthermore, instead of just one result for each step, tweets will receive an array of results, each element of which is determined by one particular subcomponent.
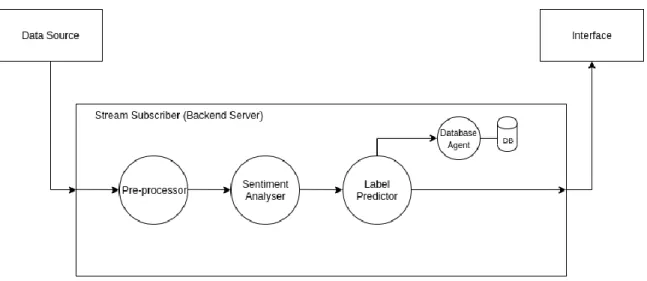
Figure 2: Data flow design from a source to an interface
A conceptual design of such a data flow is represented in Figure 2. In order to demonstrate the
extensibility of the system to incorporate multiple data processing techniques, consider the
following example, demonstrated in Figure 3: for analyzing the sentiment of a tweet using two
different NLP techniques (A and B), two subcomponents in the sentiment analyzer component must be implemented, each appending its own output to the result. Also, these subcomponents can be implemented regardless of the technology being used, e.g. a ML model that predicts a label based on a local file or an external API that acts as a black-box. Each data processing model must be coded and gets adapted to the abstract class definitions used in the system. In conclusion, various data processing techniques can be used in this system in a plug-and-play manner.
3.1.1
Pre-Processor
Similar to other components in the pipeline, this component, too, has been described at an abstract level in order to provide a certain level of flexibility. Each method of analysis may require a different type of pre-processing, using different filters.
Since here the stream of tweets is already filtered, we do not focus on filtering tweets based on their content. Rather, the focus in this stage is to handle the non-uniformity of the content of the tweets. Future stages in processing the tweet, may require some order/structure in the data to be present. When using NLP techniques to detect emotion based on the text or study the word-frequency, one of the main concerns is how to manage meaningless or unimportant words. In English, like any other language, there are many words that are repeated frequently that are not necessarily the key point of interest to a reader. Some of the more obvious examples of these words are “the”, “and”, and “of”. Other types of undesirable words can exist depending on the domain of interest (e.g., dates or numbers).
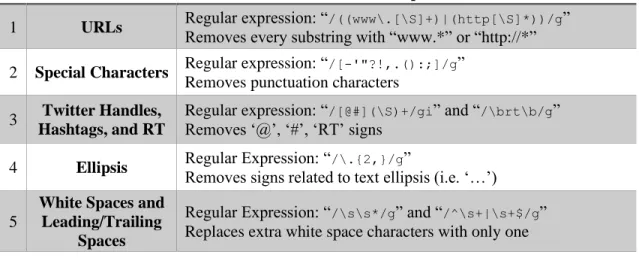
Table 3: Implemented rules for the pre-processing component.
# Rule Description
1 URLs Regular expression: “/((www\.[\S]+)|(http[\S]*))/g” Removes every substring with “www.*” or “http://*”
2 Special Characters Regular expression: “/[-'"?!,.():;]/g”
Removes punctuation characters 3 Twitter Handles,
Hashtags, and RT
Regular expression: “/[@#](\S)+/gi” and “/\brt\b/g” Removes ‘@’, ‘#’, ‘RT’ signs
4 Ellipsis Regular Expression: “/\.{2,}/g”
Removes signs related to text ellipsis (i.e. ‘…’) 5
White Spaces and Leading/Trailing
Spaces
Regular Expression: “/\s\s*/g” and “/^\s+|\s+$/g” Replaces extra white space characters with only one
Depending on the requirements, one can define different sets of rules, and focus on different aspects of the content. For instance, some approaches in sentiment analysis may require to use the included picture in the tweet. In that case, it should be checked that the corresponding field in tweet’s data is defined and not null. For the sake of simplicity, we
only implemented focused on textual analysis in this project, and the requirements for that are the details of which is available in Table 3.
3.1.2
Sentiment Analyzer
Similar to other components, Depending on the need, multiple subcomponents can be defined. In this project, we have implemented 5 sentiment analyzers. The list and description of each can be viewed in Table 4.
Table 4: Implemented sentiment analysis techniques
# Sentiment Analysis
Technique Description
1 NaturalJS Library
(AFINN-165 Vocab.)
Also called NaturalNode [49].
AFINN is a list of English words rated for valence [50].
2 NaturalJS Library
(SENTICON Vocab.)
Ibid. Analysis is done using a different approach mentioned in [51].
3 NaturalJS Library
(Pattern Vocab.)
Ibid. The Pattern vocabularies are from the Pattern project of the CLiPS Research Center [52].
4 SentimentJS Library Different library for an AFINN-based sentiment analysis for
Node.js [53] 5
IBM Natural Language Understanding API
Formerly known as AlchemyAPI, is an external API which provides various types of advanced analyses, including sentiment analysis[54].
As mentioned, access type, accuracy, and method of analysis for each of these techniques are different but they are all being employed in one system. The system is capable of adding another method in which case, the developer only needs to implement the abstract class defined as a template for subcomponents.
3.1.3
Label Predictor (Classifier)
As mentioned, we need to categorize our tweets in three major areas: - The topic under discussion (identified by keywords)
- The group which the user (author of the tweet) belongs - The theme of the tweet (summarizing the intentions)
Each of the above are the label classes that classifiers can predict for tweets. Depending on the context, user group can take on values such as media, general public, governmental agencies, etc. Accordingly, content theme can be educational, personal, unrelated, etc. Similarly, this component also supports plug-and-play by providing an abstract implementation. In order to make use of the advantage of such a design, 6 different classifying algorithms are implemented. The list is as follows:
- Long Short-Term Memory Model (LSTM) - Convolutional Neural Network (CNN) - Support Vector Machine (SVM) - K-Nearest Neighbors (KNN) - Random Forests (RF
- Multilayer Perceptron (MLP)
These methods are implemented using Scikit-learn and Tensorflow libraries in Python. Conceptually, these are incorporated within and as a part of the system. But in terms of technical considerations, in order to increase efficiency, these algorithms are implemented apart from the server. Communication with these algorithms are made through HTTP endpoints. Each algorithm listens on a specific endpoint and by emitting the tweet to that endpoint, will predict and return the labels. This allows the developer to off-load computational requirements to a more-powerful server and make use of a distributed architecture.
Initially, based on previous research in public health [55], these algorithms were fitted to a preliminary dataset to build models. Using such models, we were able to classify content into five themes. The details of which are represented in Table 5. Also, 6 user groups were identified which are listed in Table 6. These initial models are then used to classify the incoming tweets into appropriate user groups and content themes.
Table 5: Initial list of content themes gathered from a previous health-related research
# Content Themes Description
1 Educational Tweets that contain general health information, research, or information to raise awareness on a health issue.
2 Fundraising
Tweets that seek to raise funds or solicit money or services
for a health organization, cause, or individual needing medical treatments.
3 Personal
Tweets related to giving an opinion on a health issue, reporting on self-personal health status, or asking health-related questions.
4 Promotional Tweets related to promoting or advertising a for-profit health
event, organization or product.
5 Unrelated
Tweets that contains search terms, but are unrelated to health. For instance: “Nationalism is an infantile disease It is the measles of mankind”
Table 6: Initial list of content themes gathered from a previous health-related research
# User Groups Description
1 Businesses For-profit organizations, e.g., retailers, pharmaceutical companies, fitness companies.
2 Celebrities Famous people in pop culture, politics, sports and news media
3 Interest Groups
Unofficial organizations for specific health interests, e.g., school groups, health food groups, and anti-vaccination groups.
4 Media
Reputable news source such as New York Times, Washington Post, Wall Street Journal, Associated Press and reputable journals that publish health research.
5 Official Agencies
Government agencies and large non-government health agencies, e.g., National Institutes of Health, Centers for Disease Control and Prevention, and American Heart Association.
6 Public General public that does not fall into one of the
3.2
Interface Design
Using the proposed abstract design for data flow presented in last section, the interface is always connected to the processed data stream and therefore, is always being updated. Accordingly, the design of the visual representations must also take into account the fact that visualizations must be reactive to the incoming data and they must dynamically get updated. Furthermore, in order to actualize human-data interactions, in designing interactions with visualizations, the ability to communicate with the stream publisher (server) must be considered. It must be noted that in order to increase the quality of the interactions, the interface must be designed in a way that it preserves the current state of each page. If this requirement is implemented properly, it adds a great deal to the ability of the users to overcome cognitive challenges and go back-and-forth between the pages. Having a look on the state-of-the-art technologies, the details of a progressive web application using Vue.js framework is discussed in the next section.
3.2.1
A Progressive Web Application
Progressive Web Apps (PWAs) are a novel way to develop applications. They promise to combine Web technologies’ ease of development with the adaptability of native applications [56], [57]. This will result in a dramatic decrease in application size and thus, performance efficiency [58]. PWAs can be regarded as a unifying technology for cross-platform app development. Also, they can be regarded as an application development approach that overcomes the idiosyncrasies of cross-platform developments [56].
Vue.js is a programming framework developed in JavaScript that helps to build more approachable, versatile, performant, maintainable, and testable web applications [59], [60]. Using this framework PWAs can be implemented more easily and most of the problems related to the reactivity of the componen
![Figure 1: A typical stream processing system viewed from systems perspective [33]](https://thumb-us.123doks.com/thumbv2/123dok_us/811372.2602608/26.918.280.695.658.903/figure-typical-stream-processing-viewed-systems-perspective.webp)

![Figure 4: Lifecycle of a Vue.js component [62]](https://thumb-us.123doks.com/thumbv2/123dok_us/811372.2602608/41.918.356.631.261.952/figure-lifecycle-vue-js-component.webp)