Testing the PIN variable
Evangelos Benos and Marek Jochec
∗February 17, 2007
Abstract
This paper puts the PIN variable (Probability of INformation-based trading) to test. We find that for a large set of stocks, the PIN vari-able is lower (albeit insignificantly) in the periods before earnings an-nouncements dates than in the periods after earnings anan-nouncements dates. This is inconsistent with the idea of PIN capturing the proba-bility of informed trading.
Introduction
RECENT RESEARCH in financial market microstructure has tried to esti-mate the probability that a given stock is subject to informed trading over a certain period of time. An important contribution in this direction is the work of Easley, Kiefer, O’Hara and Paperman (1996)(henceforth EKOP) and Easley, Hvidkjaer and O’Hara (2002)(henceforth EHO). Based on previous theoretical work [Easley and O’Hara (1987, 1992) and Easley, Kiefer and O’ Hara (1997)] these authors impose an assumed microstructure model on the data and then estimate the model’s parameters in order to construct an estimate of the probability of informed trading (PIN). Key elements of their microstructure model are the assumptions that information events oc-cur (with a given probability) independently on a daily basis, that there is ∗Both authors are doctoral students in Economics and Finance respectively, at the University of Illinois. They can be reached at [email protected] and [email protected]. We would like to thank Dan Bernhardt, Thomas Henker, Søren Hvidkjær, Neil Pearson, Allen Pothesman, Mark Ready and Premal Vora for helpful comments and suggestions. We are otherwise entirely responsible for the contents of this article.
at most one information event per day and that informed investors1 act on
these events the very same day that they occur. If the news is good, informed traders will enter the market and more “buy” orders will be placed. If the news is bad, there will be more “sell” orders. In each case, the number of buy and sell orders are assumed to independently follow Poisson distribu-tions. Using actual stock trade prices and quotes, the authors classify trades as buy or sell-initiated and use them to estimate the parameters of the Pois-son distributions via maximum likelihood. These parameters then become the building blocks of the PIN variable, which is the ratio of the expected number of informed trades over the expected total number of trades. Thus, the PIN variable being a number between zero and one, should capture the probability of informed trading. EHO (2002) estimate the PIN variable an-nually for each common stock listed on NYSE from 1983 to 1998.
The PIN has in the meantime been widely used as an explanatory variable in studying the relationship between informed trading and a variety of phe-nomena that includes among others, spreads of less frequently traded stocks [EKOP (1996)], stock splits [Easley, O’Hara, Saar (2001)], stock analyst cov-erage [Easley, O’Hara, Paperman (1998)], cross-sectional expected returns [Easley, Hvidkjaer, O’Hara (2002)], purchased order flows [Easley, Kiefer, O’Hara (1996)] and ownership structure [Dennis, Weston (2001)]. Easley, Hvidkjaer and O’Hara (2005) use the returns of high and low-PIN portfolios to construct a risk factor that is shown to have some success in explaining portfolio returns, while Vega (2005) uses it in a test of market efficiency.
In most of these papers, the PIN variable is implicitly assumed to work (i.e., it accurately captures the probability of informed trading) and is then used as a tool to test hypotheses about the effect of informed trading on these other variables of interest. In these studies, the effect of informed trading on the other variables is usually not ex-ante clear-cut; that is, there are theo-retical arguments predicting both positive and negative relationships. If the theoretical arguments pointed in one specific direction only and the empirical findings confirmed the theory, then that would be significant evidence that PIN does work. To the extent however that PIN does play a significant role in affecting other variables in one or the other direction, one might be sus-picious that perhaps PIN is simply correlated with some other variable. To address this issue the authors of the above papers try to control for potential
1“Informed” are considered to be the investors with superior information and/or
above-average skills, such as analysts.
correlations of PIN. For example, in EKOP (1996) the microstructure model that the authors assume, predicts a direct positive relationship between the PIN variable and the bid-ask spread. In empirical tests, the authors verify that indeed less frequently traded stocks with larger bid-ask spreads have on average higher PINs. To control for the possibility that the observed negative relationship between spreads and volume is due to some reason other than informed trading risk, EKOP (1996) regress:
Σ =β0+β1·V ·P IN +β2 ·V +²
where Σ is the spread and V is volume. They find that the coefficient β1
is significant and positive, suggesting that PIN and informed trading have explanatory power over spreads, beyond any other volume-related factors.
Although this finding is consistent with PIN and the underlying model being correct, there may be other factors positively correlated with PIN and spreads and at the same time negatively correlated with volume that drive these empirical regularities. For example, a stock that is characterized by high information asymmetry among investors is also likely to be characterized by high information asymmetry between insiders and investors in general. In such a case, one could be observing low trading volumes because of an adverse selection effect, with the high spreads then showing up potentially due to an inventory effect. One could argue of course that if the PIN is correlated with some other factor and this factor is then correlated with the degree of infor-mation asymmetry between investors, then the PIN is effectively correlated with the probability of informed trading. However, this is not necessarily the case, because asymmetry of information and informed trading are not the same thing. Overall, we feel that the literature on PIN provides only weak evidence of its effectiveness. Confirming this, a recent study by Mohanram and Rajgopal (2006) finds that PIN is not a priced risk-factor in the cross-section of stock returns when the sample time period is extended relative to the one in EHO(2002).
The theoretical objection against PIN is that it is based on assumptions that do not seem very realistic. For instance, information events may not be independent across days; it is natural to imagine situations where good or bad news arrives over a sequence of days, which are then followed by days characterized by the complete absence of any news. Also, for various reasons informed investors may not trade on their private information the same day they acquired it. More importantly, the PIN does not take into account in
any way the number of shares bought or sold in any given trade2. Previous
empirical work [Easley, Kiefer, O’Hara (1997a) and (1997b)] based on mod-els similar to the ones used for the construction of PIN, has produced mixed results as to whether trade size has any information content. Easley, Kiefer, O’Hara (1997a) thus conclude that the effect of trade size on information is “model specific”. However, there is still a strong intuition that informed traders are likely to trade more heavily the stock for which they have ac-quired information. If this is true, then the PIN probably misses a good part of the information content of trades. For example, one can imagine that an informed investor who trades frequently and holds a broad portfolio of stocks will act on his information by simply reweighting his portfolio, without nec-essarily changing the number of trades. This case would go undetected by PIN. From a theoretical point of view, these arguments cast doubt on the reliability of PIN as an estimate of the probability of informed trading.
In this paper, we subject the PIN variable to a test. Our goal is to see whether it is consistent with a hypothesis that we think should be true if PIN is a reliable estimator of the informed trading probability. The idea is to compare for each stock a PIN that has been calculated using data from days that precede the Earnings Announcement Dates (EADs) to a PIN that has been calculated using data from days that follow Earnings Announce-ment Dates. Since on EADs a good amount of information about a given company becomes public, it is natural to think that there is more information asymmetry between investors and therefore more opportunities for informed trading on the days prior to EADs, than on the days after. The information asymmetry argument is verified by Brooks (1996) who uses an econometric model proposed by Hasbrouck (1991) to measure the degree of information asymmetry prior and after information events such as earnings and dividend announcements. The measure for information asymmetry is the variance of quote revisions attributable to private information, over the total variance of quote revisions. Consistent with the idea of less informational asymmetry after a public information event, the author finds that this ratio substantially decreases following an earnings announcement.
However, what we need for our test to be valid is not information asym-metry per se, but informed trading. The former is a necessary condition for the latter, but not a sufficient one. In this direction, Amin and Lee
2For a measure of informed trading that does take volume into account, see Bernhardt
(1997) show that a greater proportion of long positions is initiated in the call option market immediately before good earnings news on the underlying stock. Of course, this study examines what happens in the option market but the option market and the stock market are linked: any unusual/informed trading activity prior to an earnings announcement in the first, should also spread in the second as the informed option traders delta-hedge their posi-tions. Christophe, Ferri and Angel (2004) document a significant negative relationship between the amount of short selling prior to an EAD and the immediate post-announcement change in stock prices. This is direct evidence of informed trading prior to EADs since short-sellers are unlikely to be noise traders.
More striking evidence of informed trading prior to earnings announce-ments is provided by Frazzini and Lamont (2006) who find strong support for the “attention catching” hypothesis around EADs. Their work shows that small investors trade heavily right after an earnings announcement, presum-ably because the announcement caught their attention (hence the name of the hypothesis). This causes the stocks’ returns to increase substantially. How-ever, the price appreciation usually begins ten days prior to the announce-ment, suggesting that informed trading might be taking place. Consistent with this explanation, the authors document an abnormal amount of large trades3 in the ten-day period leading to an earnings announcement. Figure
1, taken from their paper, illustrates this fact. In their words, “one interpre-tation of this evidence is that “smart” money appropriately anticipates net buying by the “dumb” money: large investors tend to purchase announcing stocks prior to the announcement and then sell them (at inflated prices) to the smaller investors on the announcement date”.
To us, this provides ideal ground for testing the PIN variable. To the extent that the PIN is successful at estimating the probability of informed trading, we expect the PIN for the days preceding EADs to be significantly higher, in the statistical and economic sense, than the PIN calculated for the days after EADs. Our empirical work shows that this is not the case.
In what follows, we give a more detailed account of the PIN variable as it appears in EHO (2002)[Section I], we describe our data and methodology [Section II], we present the empirical tests and our results [Section III] and conclude [Section IV].
3Frazzini and Lamont classify as large trades worth $50,000 or more and as small,
I. The PIN variable
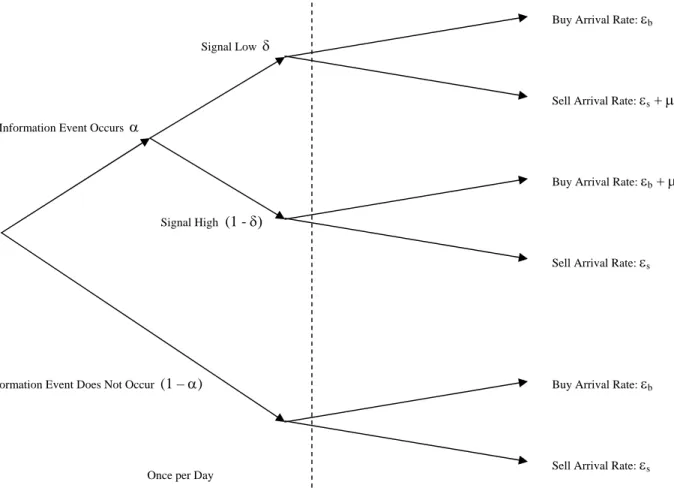
Although the PIN variable is defined and explained in EHO (2002) here we present it again for the purpose of completeness. In constructing the PIN, EHO start from a microstructure model that assumes informed and unin-formed traders, as well as an equally uninunin-formed market maker. In this setup, information events occur independently on a daily basis with prob-ability α. The news about a stock is either good (with probability 1−δ) or bad (probability δ). The market maker’s job is to set prices and execute orders as they arrive. The informed traders will buy a stock for which the news is good and will sell otherwise, on the same day the information event occurs. The rate of informed trading is µ and the rates of uninformed buy and sell orders are ²b and ²s respectively. Figure 2 (taken from EHO(2002)) gives a graphical representation of this model.
The next step is to make some assumptions about the conditional distri-bution of the number of buy and sell orders that occur on a given trading day (i.e. after nature has decided whether there is an information event and whether the news is good or bad). EHO assume the number of buy and sell trades to be independent of one another, to follow Poisson processes for a particular trading day and to be independent across trading days. Thus, the unconditional likelihood function for a single trading day is a mixed process that takes the form
L(θ|B, S) =(1−α)e−²b² B b B!e −²s² S s S! +αδe−²b² B b B!e −(µ+²s)(µ+²s)S S! +α(1−δ)e−(µ+²b)(µ+²b)B B! e −²s² S s S! (1)
where B and S are the total number of buy and sell trades respectively and θ = (α, µ, ²b, ²s, δ) is the parameter vector. Given the assumption of independence across days, the likelihood function over I days is
V =L(θ|M) = I
Y
i=1
L(θ|Bi, Si) (2) where (Bi, Si) are the day i trades and M = ((B1, S1),· · · ,(BI, SI)) is the data set. Maximizing expression (2) over θ is a way to estimate the parame-ters of the model. Using these parameparame-ters, we see that the expected number
of informed trades in a given day is αµ and the expected total number of trades is αµ+²s +²b. Thus, the fraction of informed trades to the total number of trades, is a way to estimate the probability of informed trading. Accordingly, EHO (2002) define PIN as:
P IN = αµ αµ+²s+²b
(3) Simulations show that the PIN takes on high values if there are relatively big and infrequent jumps in the number of trades. Intuitively, such jumps are more likely due to the arrival of good or bad news about a stock and to informed traders reacting by making buy or sell trades in that stock. It is important to mention that PIN does not generally take high values when there are frequent jumps. Although it is correlated with the coefficient of variation of the number of trades, this correlation is weak (0.26). Rather, PIN is big whenever there is a sharp contrast between the trading volume on a given day and that of the surrounding days.
II. Methodology and Data
A. Data
We construct our data set in the following way: At the end of January of every year, we sort by market capitalization all NYSE-traded ordinary common stocks (i.e. we use only CRSP share codes 10 and 11 to exclude financial companies, foreign companies, mutual funds, ADRs etc.) We record the ticker symbols of the 600 smallest companies, and obtain for these ticker symbols a time series of quotes and trades and a time series of EADs. Both of these series have a length of 13 years (1993-2005). The data on trades and quotes comes from the Trade and Quote (TAQ) database, while the EADs are from Compustat North America-Industrial Quarterly.
We only use NYSE traded stocks in accordance with EHO (2002), because this venue most closely resembles their market microstructure model. We restrict ourselves to the lower end of the size distribution for two reasons. First, smaller companies have fewer trades and thus calculating the PIN is computationally feasible for a larger number of ticker-years. Second, as EHO (2005) claim, the microstructure model probably describes better the informational environment of small stocks. For instance, the assumption of
one information event per day seems more fitting for small rather than large firms.
To facilitate comparison with the PINs calculated by David Easley4 we
further restrict our sample to those firms for which there is a one-to-one correspondence between their tickers and PERMNOs. In doing this, we drop 42 firms and 185 ticker-years from our sample. Next, we subject the data to additional cleaning by eliminating all ticker-years which have less than 80 observations i.e, less than 80 days of buy and sell data. We do this to ensure that there are enough data points for the PIN calculation in any given ticker-year. Finally, we merge for each stock the EADs with the daily buy/sell orders and drop these ticker-years for which there are fewer than 33 or more than 130 trading days between any consecutive EADs.5 Very frequent or rare
earnings announcements are usually associated with extraordinary events such as mergers and defaults, the effect of which on our results we would like to avoid. After this final data cleaning step, we are left with a total of 4706 ticker-years.
B. Buy-Sell Classification of Trades
To classify trades as buyer or seller-initiated, we apply a slightly mod-ified version of the Lee-Ready (1991) algorithm. In its original version, the algorithm classifies a trade as a buy (sell) if it is executed above (below) the midpoint of the bid and ask prices. The rationale is that a trade executed close to the bid (ask) price is more likely to be a sell (buy). For the trades that lie on the bid-ask midpoint, the “tick test” is used for their classification. This procedure classifies a midpoint trade as a buy if it is executed at a higher price than the previous trade (i.e., if it is an “uptick”) and as a sell if it is ex-ecuted at a lower price (“downtick”). If the previous trade is exex-ecuted at the same price, the tick test looks at the next most recent trade until it reaches a change in the trade price (“zero uptick” or “zero downtick”). To apply this algorithm, one evidently needs to match trade price data with quotes. Lee and Ready suggest matching trade prices with 5-second-old quotes because prior to the computerization of the trade process, new quotes would often be reported prior to the prices of trades that generated them.
The way we apply the Lee-Ready algorithm is different in two respects.
4These PINs are available on David Easley’s webpage.
5The earnings announcements that satisfy the 33-130 day criterion are about 97 percent
First, instead of matching trades with five second-old quotes we match trades with the most recent quotes.6 Henker and Wang (2006) argue that this
mod-ification yields more accurate classmod-ifications of trades, due to changes in data recording and reporting methods, brought by the introduction of computers in the exchanges. Another modification is the way we implement the “tick test”. We use the same methodology for an uptick or downtick, but for a zero-uptick/downtick instead of classifying a trade based on the previous price change, we give it the same classification as the previous classifiable trade. We do this because it often takes a long time (e.g. more than a day) until there is a price change.7
One characteristic of the stock trades and quotes in TAQ is that they are pooled from several different exchanges on which some NYSE stocks happen to trade as well. For instance, the most recent quote for a stock trade that oc-curred in Boston may come from the Pacific or the Midwest exchange, which is not necessarily the same with the most recent quote in Boston. However, this does not create any problems, since the quotes of any exchange are visi-ble to all other exchanges. Thus, we can safely use the raw TAQ data as an input to the Lee-Ready algorithm.
C. PIN Calculation
Maximizing expression (2) is a challenging task even for a powerful computer because for large numbers of buy (B) or sell (S) trades, the system easily overflows. In accordance with EHO (2005), we maximize instead
L((B, S)|θ) = T X t=1 [−²b−²s+Mt(lnxb + lnxs) +Btln(µ+²b) +Stln(µ+²s)] + T X t=1 ln[α(1−δ)e−µxSt−Mt s x−bMt +αδe−µxBbt−MTxs−Mt + (1−α)xsSt−MtxBbt−Mt] (4) where Mt = min(Bt, St) + max(Bt, St)/2, xs = µ+²s²s and xb = µ+²b²b. This transformation allows us to compute PINs for a larger number of ticker-years because it eliminates large numbers such as the factorials of the number of
6That is, we match trades with one second-old quotes because this is the frequency at
which the data is updated in TAQ.
buy and sell orders. Nevertheless, the overflow problem persists and the computer is not able to compute PINs for all of the 4706 ticker-years.
To make sure that our code is correct, we compute the PINs for the same ticker-years that we can unambiguously match with the PERMNO-years on David Easley’s website. It turns out that 4499 ticker-years can be matched and the resulting PINs have a correlation of 0.71 with those computed by Easley.
III. Empirical Tests and Results
The general methodology in our empirical tests is to split the time peri-ods between EADs (excluding the EADs themselves) into “proximate” and “distant” ones, the first half of a period between EADs being distant and the second half being proximate. The purpose of partitioning the time line is to compute PINs separately for proximate and distant periods and then com-pare them with each other. Figure 3 illustrates this procedure. Since there is higher information asymmetry and thus higher probability of informed trad-ing prior to earntrad-ings announcements, we would expect the PINs calculated over proximate periods to be significantly higher than the PINs calculated over distant periods. To make our PIN calculations reliable, we require each of our proximate and distant time segments to contain at least 28 trading days.8.
Since the PIN is calculated from trade data, it is instructive to first see how the trade data of our sample behaves around EADs. Figure 4 depicts the average number of daily trades as a function of the time since the last EAD. Since distant and proximate periods are defined relative to the next EAD, the first half of the graph depicts distant days and the second half depicts proximate days. The most striking feature of this graph is the well documented increase in trading volume on and immediately after an EAD. In our data, the average number of trades drops from around 50 on the first day after an earnings announcement to an average between 30 and 40 for the rest of the time. Since the PIN variable is sensitive to changes in trading volume, this means that the PINs calculated over distant periods should be affected by this regularity. We discuss this effect in more detail below when we perform our tests.
The fact that for a particular stock the PIN over a distant period is
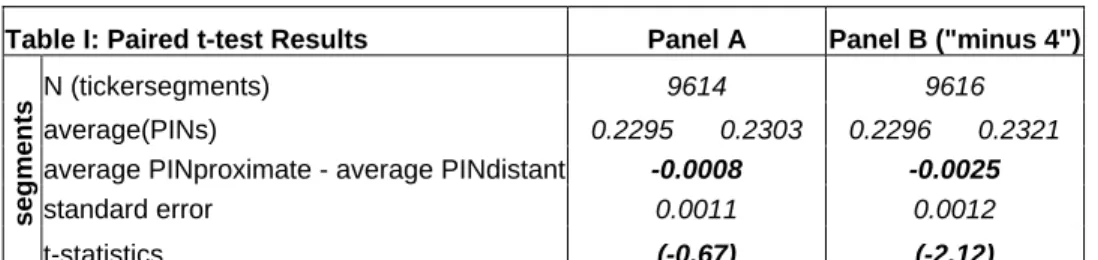
probably correlated with the PIN of the corresponding proximate period, suggests the use of a two sample paired t-test. This test is fitting as it does not require the two populations (proximate and distant PINs) to be independent of one another. The results are shown in Table I, Panel A. Ev-idently, the null hypothesis of equality between proximate and distant PINs (P INprox = P INdist) cannot be rejected. Not only is the t-statistic small (-0.67) but the point estimates have the opposite sign of what would be ex-pected if PIN worked.
One could argue that the variation in trading volume after an EAD might contaminate our test because it biases upward the PIN of distant periods. In principle, this should not be an issue because to the extent that PIN is intended to capture the probability of informed trading only, but instead it is sensitive to other regularities in the trade data, then this is a problem of PIN. However, to give PIN a chance and to eliminate the possibility that PIN fails to work only in the case of EADs because of this particular trading pattern, we repeat the above test excluding the first four trading days after an earn-ings announcement. The results (shown in Table I, Panel B) are now more strongly against the null which is rejected at 5 percent significance in favor of either of the alternatives that P INprox < P INdist or P INprox 6=P INdist.
These results raise the question of whether the standard errors allow for economically significant changes in the PIN before and after EADs. In their asset pricing regressions with PIN, EHO (2002) estimate that a level increase in PIN by 0.1 should increase the stock’s required return by 2.5% per annum. The upper bound of the 95% confidence interval of the first test that we re-port, is 0.0015. This corresponds to a negligible premium of 4 bps per annum for bearing the risk of trading against informed investors prior to earnings announcements.
The structure of our data implies that there may be a cross-sectional correlation among proximate/distant PINs. Intuitively, any large purchase of a big number of stocks by an institutional investor will cause the PINs of all these stocks to increase and us to underestimate the true standard error. To see if this is a problem with our data, we computed the cross-sectional averages of proximate and distant PINs and then we calculated the standard error of the average (across time) difference of these cross-sectional differ-ences. The resulting standard error (0.01) although higher, is still too small to allow for the PIN difference to be economically significant.
In its original version (e.g. EHO (2002) and most other related papers) the PIN variable is computed for each stock using as many as 250 trading
days which corresponds to one year of data. On the contrary, the PINs we have calculated so far use an average of 34 trading days. So, our next step is to do the empirical tests on PINs that have been calculated using a bigger number of trading days. To achieve this, we combine for every ticker-year all the “distant” segments together, calculate the PIN over this combined period and do the same with the “proximate” periods. This procedure is illustrated in Figure 5. After we have obtained “distant” and “proximate” PINs for each ticker-year, we again perform a paired t-test of mean equality. We repeat this exercise using thirds instead of halves9 as well as as 10-day time intervals.
We do this because as we move to longer proximate and distant periods, we should expect other public information events (e.g. appointment of a new CEO) to generate informed trading and therefore changes in PIN. However, these other events being random, are equally likely to lie on a proximate or a distant period. Thus, the longer the time segments are, the more noise our data contains and the less likely it is for PIN to be significantly different in one or the other period. In the case of “thirds” the PINs are effectively cal-culated over at least 70 trading days and in the case of 10-day time intervals the PINs are computed using data from more than 30 trading days. The summary statistics of all our different samples are given in Table II.
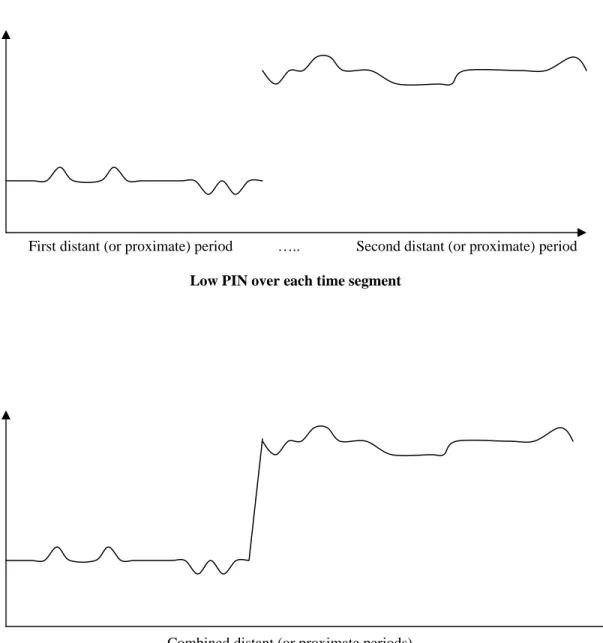
One concern about our methodology might be whether it is correct to calculate PINs over time periods that are the union of time intervals which lie afar from each other. One can easily think of situations where the re-sulting calculation is misleading. Suppose for example that in each of the time intervals/segments, the total number of buys and sells does not fluctu-ate significantly, but is nevertheless very different from interval to interval. In such a case, the true PIN should be small, since there is no evidence of informed trading in each time interval. However, when these time intervals are combined, it will look as if there are significant changes in the number of buy/sell orders and the PIN over the combined period will probably be high. Figure 6 illustrates this potential problem. However, our combined proximate and distant periods are formed from alternating proximate and distant time segments. This implies that even if the previously described bias exists, it will be equally pronounced for the combined proximate and distant periods.
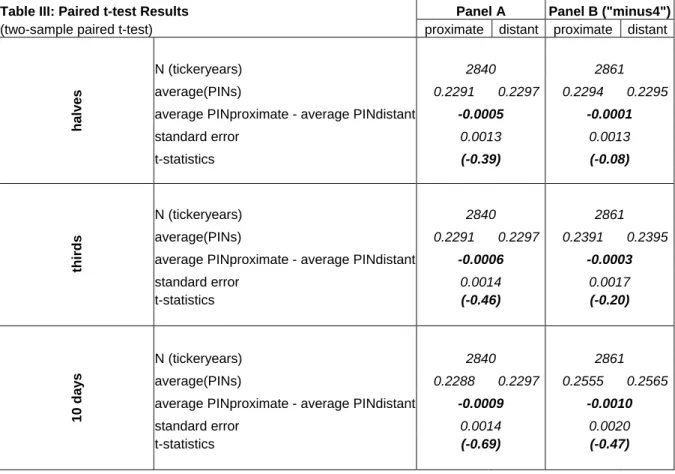
Consistent with our previous results, these tests also show (Table III)
9Now the first third is distant and the last third is proximate. Each third is about 20
that the average PINs computed over proximate periods are not only insignif-icantly different from the average PINs computed over distant periods, but they also tend to be lower. We also perform the tests omitting the first four days after earnings announcements (Panel B). As before, the t-statistics can-not reject the null hypothesis of mean equality ofP INprox andP INdist while the confidence interval bounds exclude the possibility thatP INprox−P INdist can take on economically significant positive values.
IV. Conclusion
Despite the fact that so far there has been some weak empirical evidence that PIN works, there are many theoretical objections as to whether it actu-ally should work. In constructing the PIN, EKOP (1996) and EHO (2002) make some strong assumptions about the occurrence of information events and the behavior of market participants. On the other hand, PIN ignores the actual size of any given trade. In this paper we have attempted to directly test whether PIN is a variable that can be trusted in providing an accurate estimate of the probability of informed trading. In this direction, we have shown that it does not significantly change before and after EADs. To the extent that our intuition and the available empirical evidence about more informed trading prior to major public information events - such as earnings announcements - is correct, the results of our work should caution researchers about the use of PIN. We feel this is important, since the PIN has been and is being used as an explanatory variable in many research articles.
References
Amin Kaushik, and Charles M. Lee, 1997, “Option Trading, Price Discovery and Earnings News Dissemination”, Contemporary Accounting Research 14, 153-192
Bernhardt Dan and Eric Hughson, 2002, “Intraday trade in dealership mar-kets”, European Economic Review 46, 1697-1732
Brooks Raymond, 1996, “Changes in Asymmetric Information at Earnings and Dividend Announcements”, Journal of Business Finance and Account-ing 23(3), 359-378
Christophe Steven, Michael Ferri and James Angel, 2004, “Short-Selling Prior to Earnings Announcements”, Journal of Finance 59, 1845-1875 Dennis Patrick and James Weston, 2006, “Who is Informed? An Analy-sis of Stock Ownership and Informed Trading”, working paper
Easley David, Soeren Hvidkjaer and Maureen O’Hara, 2002, “Is Information Risk a Determinant of Asset Returns?”, Journal of Finance 47, 2185-2221 Easley David, Soeren Hvidkjaer and Maureen O’Hara, 2005, “Factoring In-formation Into Returns”, working paper
Easley David, Nicholas M. Kiefer and Maureen O’Hara, 1996, “Cream-Skimming or Profit Sharing? The Curious Role of Purchased Order Flow”, Journal of
Finance 51, 811-833
Easley David, Nicholas M. Kiefer and Maureen O’Hara, 1997, “The Infor-mation Content of the Trading Process”, Journal of Empirical Finance 4, 159-186
Easley David, Nicholas M. Kiefer, Maureen O’Hara and Joseph B. Paperman, 1996, “Liquidity, Information, and Infrequently Traded Stocks”, Journal of
Finance 51, 1405-1436
in Securities Markets”, Journal of Financial Economics 19, 69-90
Easley David and Maureen O’Hara, 1992, “Time and the Process of Se-curity Price Adjustment”, Journal of Finance, 47, 577-605
Easley David and Maureen O’Hara, 2004, “Information and the Cost of Cap-ital”, Journal of Finance 59, 1553-1583
Easley David, Maureen O’Hara and Joseph B. Paperman, 1998, “Finan-cial Analysts and Information-Based Trade”, Journal of Financial Markets
1, 175-201
Easley David, Maureen O’Hara and Gideon Saar, 2001, “How Stock Splits Af-fect Trading: A Microstructure Approach”, Journal of Financial and
Quan-titative Analysis 36, 25-51
Frazzini Andrea and Owen Lamont, 2006, “The Earnings Announcement Premium and Trading Volume”, working paper
Hasbrouck Joel, 1991, “Measuring the Information Content of Stock Trades”,
Journal of Finance 46, 179-207
Henker Thomas and Jian-Xin Wang, 2006, “On the importance of timing specifications in market microstructure research”,Journal of Financial Mar-kets 9, 162-179
Lee M. Charles and Mark J. Ready, 1991, “Inferring Trade Direction from Intraday Data”, Journal of Finance 46, 733-746
Mohanram Partha and Shiva Rajgopal, 2006, “Is Information Risk (PIN) Priced?”, working paper
Vega Clara, 2005, “Stock Price Reaction to Public and Private Information”,
Figure 1: Abnormal trading volume (small and large trades) around earnings announcement dates. Abnormal Net Buy is the average (across firms) ratio of buyer-initiated volume minus seller-initiated volume for a firm, divided by the average daily volume of the same firm over the previous 250 trading days. Taken from Frazzini and Lamont (2006). See Frazzini and Lamont (2006) for more details.
Buy Arrival Rate: εb
Information Event Does Not Occur (1 – α)
Information Event Occurs α
Signal High (1 - δ)
Signal Low δ
Sell Arrival Rate: εs + μ
Buy Arrival Rate: εb + μ
Sell Arrival Rate: εs
Buy Arrival Rate: εb
Sell Arrival Rate: εs
Once per Day
EAD EAD EAD EAD EAD prox. dist. prox. dist. prox. dist. prox. dist.
Figure 3: The timeline split into distant and proximate “segments”.
0 10 20 30 40 50 60 1 2 3 4 5 6 7 8 9 10 11 12 13 14 15 16 17 18 19 20 21 22 23 24 25 26 27 28 29 30 31 32 33 34 35 36 37 38 39 40 41 42 43 44 45 46 47 48 49 50 51 52 53 54 55 56 57 58 59 60 61 62 63
Distance from EAD in days (1=EAD)
Nu mb er o f trad es (b u ys+sel ls )
Figure 4: Average number of daily trades as a function of the time since the last earnings announcement.
Table I: Paired t-test Results Panel A Panel B ("minus 4")
N (tickersegments) 9614 9616
average(PINs) 0.2295 0.2303 0.2296 0.2321
average PINproximate - average PINdistant -0.0008 -0.0025
standard error 0.0011 0.0012
seg
men
ts
t-statistics (-0.67) (-2.12)
Table I : This table presents the average PINs per proximate/distant time segment, their
difference and the two-sample paired t-statistics for testing mean equality.
EAD EAD EAD EAD EAD
COMBINED DISTANT PERIODS COMBINED PROXIMATE PERIODS PINDISTANT PINPROXIMATE
Figure 5: We compute PINs over time intervals that have been created by combining distant and proximate (relative to EADs) periods.
Summary statistics of the sample
proximate distant proximate distant
average # of trading days average # of trading days 71.07 73.28
(stdev) (stdev) (17.85) (15.45)
average # of trades 72.30 71.24 average # of trades 38.49 39.90
(109.82) (107.80) (49.67) (51.11)
- buys 36.51 36.10 - buys 19.61 20.41
(61.16) (60.21) (28.19) (29.12)
- sells 35.78 35.13 - sells 18.88 19.50
(59.68) (58.77) (26.22) (26.90)
average # of trading days 107.78 110.33 average # of trading days 34.41 35.42
(stdev) (26.30) (23.60) (stdev) (8.86) (7.67)
average # of trades 38.75 39.40 average # of trades 38.42 41.92
(50.05) (50.23) (49.18) (54.01) - buys 19.71 20.10 - buys 19.55 21.50 (28.44) (28.63) (27.88) (30.74) - sells 19.04 19.29 - sells 18.87 20.41 (26.40) (26.46) (26.06) (28.35) period 10 days hal ves 33.50 period th ir d s segment s (5.09)
Table II: Summary statistics of trading days, buys, sells and total trades for
Trading Volume
First distant (or proximate) period ….. Second distant (or proximate) period
Low PIN over each time segment
Trading Volume
Combined distant (or proximate periods)
High PIN over combined period
Figure 6: The above graphs illustrate the potential for wrong PIN
calculations when large changes in the number of buy/sell orders in the combined periods are due to different overall levels of volume in each of the distant/proximate periods.
Table III: Paired t-test Results Panel A Panel B ("minus4")
(two-sample paired t-test) proximate distant proximate distant
N (tickeryears) 2840 2861
average(PINs) 0.2291 0.2297 0.2294 0.2295
average PINproximate - average PINdistant -0.0005 -0.0001
standard error 0.0013 0.0013 h a lves t-statistics (-0.39) (-0.08) N (tickeryears) 2840 2861 average(PINs) 0.2291 0.2297 0.2391 0.2395
average PINproximate - average PINdistant -0.0006 -0.0003
standard error 0.0014 0.0017 thirds t-statistics (-0.46) (-0.20) N (tickeryears) 2840 2861 average(PINs) 0.2288 0.2297 0.2555 0.2565
average PINproximate - average PINdistant -0.0009 -0.0010
standard error 0.0014 0.0020
10 d
ays
t-statistics (-0.69) (-0.47)
Table III : This table presents the average PINs per proximate/distant recombined period, their