Original Article
Quantifying the Drying Phenomenon of Oaks by Highlighting
the Defoliation of Stands
TĂUT Ioan
1,2*, Vasile ŞIMONCA
1,2, Mircea MOLDOVAN
2, Tatiana BLAGA
31University of Agricultural Science and Veterinary Medicine Cluj-Napoca, 3-5 Manastur St., 5400372 Cluj-Napoca, Romania 2”Marin Drăcea”Institute of Forestry Research and Development in Forestry, Cluj-Napoca, 65 Horea St., Cluj-Napoca, Romania
3”Marin Drăcea”Institute of Forestry Research and Development in Forestry, Bacău, 3 Mihai Eminescu St., Bacău, Romania
Received 2 November 2015; received and revised form 20 November 2015; accepted 8 December 2015 Available online 31 December 2015
Abstract
The stands decline can be due to structural or functional disturbances, in which several categories of disruptive or harmful factors compete and interact in different ways and directions, but whose outcome is weakening the trees vigor, culminating with their death. The harmful agents may be abiotic or biotic. The biotic agents include bacteria, fungi and insects that are not able to invade in normal circumstances, and cause significant harm to healthy trees, but
can be very destructive when attack devitalized trees. Leaf defoliation or loss due to biotic or abiotic factors is the most
frequent and easier symptom to be quantified at the tree level and stand. Due to this phenomenon, trees slow their growth, suffer disturbances of nutritional regime, stands being subject to stress phenomenon that will culminate with the decline of those stands. In terms of defoliation, stands recorded values ranging between 4 to 38%. Weak or moderate defoliation were recorded only in oak subarea, where they ranged between 15-38%. Most affected were stands from the
Forestry District Satu Mare, defoliation being the result of Lymantria disapar pest attack (30-35%).
Keywords: Forestry District, attack, Lymantria dispar, analyze of the simple variance.
1. Introduction
The presence of forests multiple injuries, produced by various unknown causes, were reported since the middle of the last century. The rapid development of symptoms, their spatial spread and their effect on forest species, led to the description of the so-called syndrome of the "unknown decline" of forest [6, 16]. The aspects of this phenomenon, consequence of the harmful effects of biotic and abiotic factors, could not be explained by existing research at that time.
* Corresponding author. Fax: +40-264-593792 Tel: +40-264-596384
e-mail:simoncavasile@gmail.com
Finally, the decline of the forest ecosystems state was attributed to the negative effects of air pollution, highlighting the relationships between pollutant deposition border and the main components of the ecosystem, climate change or increased virulence of biotic agents [1, 2, 3, 4, 5].It is believed that abnormal drying phenomena exist within a stand, when the number of completely dry trees and the number of trees with dried crowns are over a third, and when the presence of bark insects or wood-eating, xylophagous fungi, regardless of dryness of the crown, represent over 10% of the number of trees [8, 12, 14, 15]. The effects of these phenomena are expressed by symptoms of decline
ProEnvironment
(traces of attacks of pests and pathogens on host trees), pathogenic attacks, pollution, etc.
The effects felt by the short or medium term are the reduced which in most cases is presented as a combination [7, 12, 11, 13]. They can grow sequentially or simultaneously and may have cumulative effects on development in the host environment, whose sensitivity increases in time [9, 12].
The involved factors act at different levels simultaneously, or one at a time.
Thus, at the crown level, are felt the negative effects of prolonged drought, late frosts, defoliationphotosynthesis, and nutritional imbalances, which finally result in crown loss [2, 5, 10, 11].
2. Material and Method
In order to achieve the objectives of our research, there were installed experimental fields in the stands affected in various ways, and characterized by different degrees of attack, various destabilizing factors, and framing in different age classes.
The observations were made according to the evaluation methodology used in the record of decline phenomena of stands both in our country and abroad.
For quantification, calculation and comparison of stands between them, or of drying phenomenon dynamics in a stand, the following parameters where were taken into account:
- Kraft classes;
- size and shape of the crown; - defoliation,
- state of vegetation;
- percentage of dry thin branches or their absence;
- number of thick dry branches;
- the presence of epicormic branches or agglomerations of dormant buds;
- the presence of pathogens and pests in the meantime with description of the encountered defects or degradations.
To compare the analyzed stands between them or to track their evolution over time, some of the analyzed characteristics were transformed from descriptive features in numerical characteristics, using an own graduation.
3. Results and Discussions
Leaf defoliation or loss due to biotic or abiotic factors represent the most frequent and easier symptom to be quantified at the tree level and stand. Due to this phenomenon, trees slow their growth, suffer disturbances of nutritional regime, stands being subjected to a stress phenomenon that will culminate with the decline of those stands.
In order to describe this phenomenon, repeated evaluations were carried out in stands analyzed during May-August (Table 1). The data presented in Table 1 show that from the point of view of defoliation, values between 4 to 38% are reported in stands.
Weak or moderate defoliation were recorded only in oak subarea, where they ranged between 15- 38%. Compared to 2014, there is an increase in the average percentage of defoliation in majority of the analyzed stands.
Table 1 shows that, due to Lymantria dispar
attack (30-35%), the stands most affected by defoliation were located in the Forestry District Satu Mare.
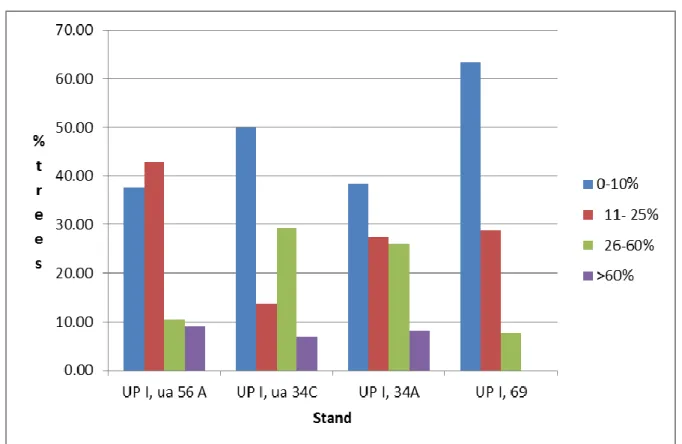
In terms of the tree distribution by defoliation intensity classes, predominate weak defoliated trees (40-60% for the oak area and about 70% for the sessile oak area (Figs. 1 and 2).
The differences between the stands were determined using the analysis of variance (ANOVA test).
Analyzing the data from Table 2, it is noted that in the concerning tree distribution by degrees of defoliation, between the analyzed stands from Forestry District Satu Mare and Livada no statistically significant differences are recorded (F calc< F 0.05).
In the stands from the Experimental Basis Lechinţa, the degree of defoliation strongly affects 0-13% of analyzed trees, while for moderate affected, the percent is lower, the values being of 40% of the trees are in this class harmed, except UA 28D. The common cockchafers are the causes of the defoliation affecting this stand. Later, the examined stands rebuilt their foliage (Table 3).
Despite the situation of UA 28 D, the defoliation distribution degrees among trees, on analyzed stands, in the Experimental Basis Lechinţa do not record the differences statistically significant (F calc< F 0,05).
Regarding the dynamics of oak defoliation subarea and durmast subarea (Table 4), statistically significant differences were reported between them ( Fcalc >F teor).
Table 1. The status of the analyzed stands according to the degree of defoliation
Figure 1. The distribution (%) of the analyzed trees by defoliation classes - Forestry District Satu Mare and Forestry District Livada
Forestry
Department Forest District U.P., u.a.
The degree of defoliation (%)
2013 2014 1 Satu Mare Satu Mare UP I. ua 34C 28.75 34.25 2 UP I, ua 56 A 21.34 29.05 3 Livada UP I. 34A 12.22 18.96 4 UP I. 69 15.54 17.23 5
Maramureș Șomcuta Mare
UP IV. ua 34 15.72 14.56 6 UP IV.ua 55B 22.58 29.56 7 UP IV. ua 65 15.47 19.25 8 Ulmeni UP I. ua 29 C 25.21 38.25 9 UP I. ua 30 D 5.72 4.44 Bistrița-Năsăud Bistrița UP I. ua 40 A 5.41 8.98 UP VII. ua 151B 7.21 11.96 Beclean UP IV. ua 140B 4.89 17.44 UP IV. ua 141B 5.15 9.75 UP IV. ua 154C 4.45 9.13 Cluj
Cluj Napoca UP II. u.a. 5A 8.96 7.55
Gherla UP III. ua 64A 23.44 18.56
UP III. ua 65C 15.66 17.17
INCDS O.S.E. Lechința
UP I. ua 63 B 15.33 16.11
UP I. ua 65 C 21.60 20.40
UP II. ua 21 B 9.81 7.58
UP IV. ua29 D 11.55 17.98
Table 2. The analyze of the simple variance in oak stands from the Forestry District Satu Mare and Forestry District Livada
Source of variation SPA GL S2
F Calculated F theoretical 0.05 Total (SPAt) 119 3 39.53 0.06 3.5
Between stands (SPAvar)
834 8 12 695.74
Between classes Error (SPA rep)
8467 15
Figure 2. The distribution (%) of the analyzed trees by defoliation classes - Experimental Basis Lechinţa
Table 3. The analyze of the simple variance in durmast stands from the Experimental Basis Lechinţa
Source of variation SPA GL S2
F Calculated
F theoretical, 0.05
Total (SPAt) 83 4 20.73
Between stands (SPAvar) 21356 15 1424 1.456 3.1
Table 4. The analyze of the simple variance in analyzed stands group
Source of variation SPA GL S2
F Calculated
F theoretical, 0.05
Total (SPAt) 232 8 29.09
Between stands (SPAvar) 29705 27 1100 2.64* 2.3
Between classes Error (SPA rep) 29937 35
Thus, in oak stands predominate trees with degrees of defoliation between 11 to 25% - weak injured, followed by moderately injured, while the
weak injured are the predominant in durmast
stands, the other classes of defoliation having
different degrees of participation, in general,
less than 10%.
4. Conclusions
The results presented in this paper, show that there are two types of decline or two models - the acute with rapid development and the chronic with slow spatial and temporal development.
The experimental fields were placed in stands affected in various ways and where different degrees of attack are manifested by various destabilizing factors, stands located in different age classes.
The observations were made according to evaluation methodology used in the record of decline phenomena of stands both in our country and abroad.
The most important predictors of short and medium term decline are those depicting changes in the crown on amending the shape, size or transparency.
The following health descriptors were analized: defoliation, percentage of dry thin branches, the number of dry thick branches, size and shape of the crown, the presence or absence of epicormic branches, insect galleries or rot on the tree trunk.
In terms of defoliation, stands have been between 4 to 38%. Weak or moderate defoliation was recorded only in oak subarea, where they ranged between 15- 38%. Most affected were stands from the Forestry District Satu Mare, the defoliation being the consequence of the Lymantria disappear
pest attack (30-35%).
Compared to 2014, there is an increase in the average percentage of defoliation in most analyzed stands. In terms of trees distribution by defoliation intensity class, prevails trees very weak defoliated.
The ANOVA test shows that regarding the distribution tree by defoliation classes, between oak subareas stands either in durmast subarea, there are not recorded statistically significant differences. However there are significant differences from one area to another.
References
[1] Alexe A., 1984, Analiza sistemică a fenomenului de uscare a cvercineelor și cauzele acestuia. Rev.Păd.1, 5-11. [2] Alexe A., 1985, Analiza sistemică a fenomenului de uscare a cvercineelor și cauzele acestuia. Rev.Păd., 1. 8-15. [3] Alexe A., 1986, Analiza sistemică a fenomenului de uscare a cvercineelor și cauzele acestuia. Rev.Păd., 1, 25-32. [4] Badea O., M. Tănase, 2003, Analiza dinamicii stării de sănătate a arboretelor şi determinarea pierderilor de creştere cauzate de vătămarea acestora. Silvologie, IIIA. Editura Academiei Române, Bucureşti.
[5] Badea O., 2006, Starea de sănătate a pădurilor din România în perioada anilor 1990-2005, evaluată prin sistemul de monitoring forestier, Revista Pădurilor, 1, 50-58.
[6] Badea O., 2008, Manual privind metodologia de supraveghere pe termen lung a stării ecosistemelor forestiere aflate sub acțiunea poluării atmosferice și modificărilor climatice, Tehnica Silvică, Bucuresti. [7] Delatour C., 1983, Les Dépérissements de Chênes en Europe, Revue forestière française, XXXV (4), 265-282. [8] Georgescu C., 1942, Uscarea în masă a stejarului. Revista pădurilor. Editura Fundaţiilor Regale, Bucureşti. [9] Georgescu C., N. Petrescu, 1954, Contribuții la cunoașterea ciupercilor parazite și saprofite pe stejarul rosu. Rev. Păd., 9, 295-307.
[10] Haring P., A. Crisan, A. Fabian, N. Fabian, 1984,
Uscarea gorunului (Quercus petraea Liebl.) cauzată de
[11] Marcu G., 1966, Studiul cauzelor și al metodelor de prevenire și combatere a uscării stejarului, Centrul de Docum. Tehn. Pt.. Ec. Forest.. Bucureşti.
[12] Oroian I., 2008, Protecţia plantelor şi mediul, Editura Todesco, Cluj-Napoca.
[13] Şimonca V., Tăut I., 2010, Oaks Decline in the
North and West of Transylvania,
Promediu/Proenvironment, 3, 17-22.
[14] Şimonca V., I. Oroian, I. Tăut, 2011, The
Research of some elements from climate regime with
the influence of the forests from River Somes upon
vegetation condition. Revista Promediu
/Proenvironment, 7, 20-26.
[15] Tăut I., 1995, Cercetări privind prevenirea şi
combaterea ciupercii Microsphaera abbreviata, Revista
pădurilor, 2, 20-28.
[16] Tăut I., V. Şimonca, L. Holonec, 2011, Detection
and Prognosis Defoliators Tortrix viridana and
Pristiphora abietina, Northwestern Transylvanian Forests.
”This is an open-access article distributed under the terms of the Creative Commons Attribution License, which permits unrestricted use, distribution and reproduction in any medium, provided the original author and source are credited.”