Theses, Dissertations, and Student Research in
Agronomy and Horticulture Agronomy and Horticulture Department
5-2016
Cover Crop Mixture Diversity and Function
Angela FlorenceUniversity of Nebraska-Lincoln
Follow this and additional works at:http://digitalcommons.unl.edu/agronhortdiss
Part of theAgronomy and Crop Sciences Commons,Biodiversity Commons, and theWeed Science Commons
This Article is brought to you for free and open access by the Agronomy and Horticulture Department at DigitalCommons@University of Nebraska -Lincoln. It has been accepted for inclusion in Theses, Dissertations, and Student Research in Agronomy and Horticulture by an authorized administrator of DigitalCommons@University of Nebraska - Lincoln.
Florence, Angela, "Cover Crop Mixture Diversity and Function" (2016).Theses, Dissertations, and Student Research in Agronomy and Horticulture. 100.
COVER CROP MIXTURE DIVERSITY AND FUNCTION
by
Angela M. Florence
A DISSERTATION
Presented to the Faculty of
The Graduate College at the University of Nebraska In Partial Fulfillment of Requirements For the Degree of Doctor of Philosophy
Major: Agronomy & Horticulture
Under the Supervision of Professor John L. Lindquist
Lincoln, Nebraska
COVER CROP MIXTURE DIVERSITY AND FUNCTION Angela M. Florence, Ph.D.
University of Nebraska, 2010 Advisor: John L. Lindquist
The objective of this study was to evaluate the effect of cover crop mixture diversity on cover crop function. Specifically, this study evaluated the effect of cover crop species and functional richness on aboveground biomass productivity, weed suppression, soil nutrient retention, soil microbial community characteristics, and
performance stability. Twenty to forty cover crop treatments were replicated three to four times at eleven sites across southeastern Nebraska using a pool of eighteen species representing three cover crop species each from six pre-defined functional groups: cool-season grasses, cool-cool-season legumes, cool-cool-season brassicas, cool-season grasses, warm-season legumes, and warm-warm-season broadleaves. Each species was planted in monoculture and the most diverse treatment contained all eighteen species. Remaining treatments represented intermediate levels of cover crop species and functional richness. Cover crop planting dates ranged from late July to late September with both cover crop and weed aboveground biomass being sampled prior to winterkill. Soil samples were taken in the following spring and analyzed for soil extractable nitrate, phosphorus, potassium, sulfate, and chloride as well as extracted for fatty acid methyl esters to characterize soil microbial biomass and community structure. Performance stability was assessed by evaluating the variability in cover crop biomass for each treatment across plots within each site. While increasing cover crop mixture diversity increased average aboveground biomass
monocultures being drawn down by low yielding species rather than due to niche complementarity or increased resource use efficiency. Furthermore, while increases in cover crop mixture diversity were often correlated with increases in weed suppression, increases in soil nutrient retention, increases in soil microbial biomass, alterations in soil microbial community structure, and increases in performance stability, I argue that this was a result of diversity co-varying with aboveground biomass, and that differences in aboveground biomass rather than differences in diversity drove the differences observed in weed suppression, nutrient retention, soil microbial community characteristics, and stability. The results of this study contradict many popular hypotheses regarding the relationship between plant mixture diversity and function.
Copyright
Angela M. Florence May, 2016
Dedication
Acknowledgements
I have been incredibly fortunate in the people I have been able to work with during my time at the University of Nebraska. For these people and to these people I would like to express my heartfelt thanks. First and foremost I want to thank my major advisor, Dr. John Lindquist. Thank you for being both understanding and expectant and supporting me throughout this process. Thank you also for all your thoughtful feedback on my work and for giving me all sorts of room to roam with this project. I could not have asked for a better adviser. Appreciation also goes to the other members of my supervisory committee— Dr. Rhae Drijber, Dr. Charles Francis, and Dr. Leon Higley. Thank you for helping me to think about things in new ways and for your wonderful senses of humor. I’ve enjoyed learning from all of you very much.
During my time at the University of Nebraska, I got to share an office and work with a group of wonderful fellows. They collectively made my time there a real joy and I want to thank them for that. A big thank you goes to Rodrigo Werle, John LaBorde, Strahinja Stepanovic, James Han, and Jared Schmidt. These gentlemen could be counted on for everything from heavy lifting to a game of catch to a delicious burrito at De
Leon’s to a rousing discussion of statistical programming. I could not imagine a more fun and helpful group. It’s been a delight to know you all.
I have a habit of biting off more than I can chew. Thankfully, there were a lot of people at the university who helped me to tackle my overzealous bites. From our own lab, I want to thank our research technician, Darren Binder, and all the undergraduates who helped me along the way. Michelle Dvoracek, Danny Friedrichson, Andre do Amaral Silva, Roberto Carlos, and Andrew Kennedy came in and out at various times to
help me with everything from weighing out seeds to cover crop sampling. From the soil microbiology lab, I want to thank Liz Jeske and Salvador Ramirez who helped me
prepare and analyze my soil samples. Thanks also to Liz for helpfully fielding so many of my questions about FAMEs analysis. From the Biological Systems Engineering
department, thank you to Paul Jasa. Paul knows a ton about cover crops and was kind enough to both let me and help me establish a study site out at Rogers Memorial Farm.
I was also most fortunate in the farmer cooperators I had the opportunity to work with during my time in Nebraska. These gentlemen let a virtual stranger tromp out onto their land and start strewing about seeds. For that, I am extremely grateful. Thank you to Ben Schole, Mike Herman, Paul Swanson, Keith Berns, and Nate Schroeder for letting me put my study out at their places. I want to give a special thank you to Ben Schole, who certainly deserves a mug for the best farmer cooperator in the world. Ben helped me mark out my plots, plant them, and harvest them. All the while he taught me so much about agriculture, environmental stewardship, and simple kindness. Even after giving me all of this, he still found it in him to feed me lunch on several occasions. So a big thank you goes to Ben.
Of course, emotional, intellectual, and physical support is important, but I would be remiss in not acknowledging the financial support that allowed me to conduct this research and meet all these wonderful people. Thank you to the National Science Foundation for keeping me fed and sheltered and thank you to North Central SARE for funding this project. Thanks also to Valerie Swartz, Heather Steffens, Cheryl Bogenrief, and Gene Hogan in the business office for helping me keep my bills paid and helping me navigate all sorts of financial questions.
At some point along this journey, I had the good fortune to have a baby. I also had the good fortune of having a very supportive family. Without them, I know that I would not have been able to finish this dissertation. If it takes a village to raise a child, it most certainly takes one to raise a child and finish a doctoral program. Thankfully, I have been blessed with a pretty great village.
I find that the hardest thank yous to express are the ones where you have the most to be thankful about. This is most certainly the case when it comes to my husband, Robert. There are not enough superlatives in the English language to help me express my gratitude to Robert, who has supported me with unbelievable good cheer throughout this entire endeavor. Robert and I met as a consequence of our labs being next to each other when we were both at Kansas State. One of my earliest encounters with him was when he dropped by my lab late one night and offered to help me process my samples. Little did he know at the time what he was getting himself into. Since then he has spent three years of his weekends helping me do my fieldwork in both the blistering heat and the freezing cold. He has tolerated my enthusiasm for relentlessly adding more sites and treatments to my study (knowing full well who would actually be doing the bulk of the physical labor for these sites and treatments) and has bolstered me up when that enthusiasm has waned. Thank you for all your hard work, patience, and support through these past three years.
I simply could not have asked for better friends or teachers in this endeavor. While at the surface, this document is simply a summary of numbers, underneath it are hours of conversation, camaraderie, and shared labor. The journey here has most certainly been its own reward. Thank you.
Table of Contents
List of Figures xiii
List of Tables xv
Chapter 1 - Introduction 1
Chapter 2 - Cover crop mixture diversity and productivity 4
ABSTRACT 4
INTRODUCTION 5
MATERIALS AND METHODS 9
Research sites 9
Experimental design 9
Plant sampling 14
Data analysis 14
RESULTS 17
Cover crop productivity by site 17
Cover crop productivity by treatment 18
Cover crop diversity and productivity 23
DISCUSSION 24
Classical ecological approach: a misleading use of regression analysis 26
Cover crop management conclusions 28
Parting thoughts regarding the plant mixture diversity and resource use efficiency 29
Chapter 3 - Cover crop mixture diversity and weed suppression 34
ABSTRACT 34
MATERIALS AND METHODS 37 Research sites 37 Experimental design 37 Plant sampling 38 Data analysis 38 RESULTS 41
Sown versus realized species richness 41
Classical ecological approach: mistaking correlation for causation 42
Cover crop diversity and weed suppression 44
Cover crop type and weed suppression 46
DISCUSSION 48
Diversity-invasibility hypothesis 48
Competition-relatedness hypothesis 53
Parting thoughts regarding diversity and resource pre-emption 55
Chapter 4 - Cover crop mixture diversity and soil nutrient retention 63
ABSTRACT 63
INTRODUCTION 64
MATERIALS AND METHODS 69
Research site 69
Experimental design 70
Plant sampling 70
Soil sampling and laboratory analysis 70
RESULTS 73
Cover cropping and nutrient retention 73
Total aboveground plant biomass and nutrient retention 76
Cover crop diversity and soil nutrient retention 79
DISCUSSION 80
Cover crop management conclusions 80
Parting thoughts regarding diversity and soil nutrient retention 81
Chapter 5 - Cover crop mixture diversity and soil microbial biomass and
community structure 88
ABSTRACT 88
INTRODUCTION 89
MATERIALS AND METHODS 90
Research site 90
Experimental design 90
Soil sampling and preparation 90
Lipid extraction and fractionation 91
Quantification and identification of FAMEs 92
FAME nomenclature 92
Soil microbial biomass and community structure 93
Data analysis 93
RESULTS 95
FAMEs identified 95
Cover crop biomass, diversity, and soil microbial biomass 96
DISCUSSION 100
Soil microbial biomass 100
Soil microbial community structure 102
Parting thoughts regarding plant specific effects on soil microbial community
characteristics 102
Chapter 6 - Cover crop mixture diversity and stability 110
ABSTRACT 110
INTRODUCTION 111
MATERIALS AND METHODS 112
Research sites, experimental design, and data collection 112
Data analysis 113
RESULTS 115
Correlation between coefficient of variation and cover crop mixture diversity 115 Relationship between mean aboveground biomass and coefficient of variation 116
Effect of diversity on stability 117
DISCUSSION 118
Parting thoughts regarding diversity-stability effect size expectations 120
List of Figures
Figure 2-1. Boxplots of cover crop aboveground biomass for treatments #2-20 by
planting date overlaid by individual data points. ... 18
Figure 2-2. Species specific cover crop biomass (±SEM) for treatments 2-20 by site for 2013. ... 20
Figure 2-3. Species specific cover crop biomass (±SEM) for treatments 2-20 by site for 2014. ... 21
Figure 2-4. Species specific cover crop biomass (±SEM) for treatments 21-39 by site for 2014. ... 22
Figure 2-5. Google Earth aerial imagery of Site 11 at time of cover crop harvest. ... 23
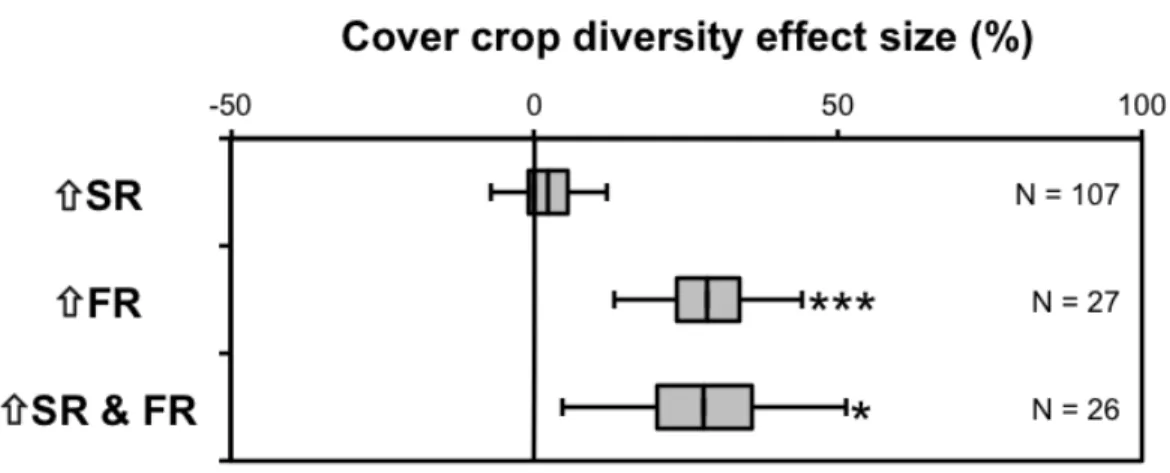
Figure 2-6. Mean effect size of increasing cover crop diversity on cover crop productivity—specifically the effects of increasing species richness (ñSR), increasing functional richness (ñFR), and increasing both species and functional richness simultaneously (ñSR & FR). ... 24
Figure 2-7. Mean cover crop biomass (±SEM) by cover crop species and functional richness for Site 3 with ordinary least squares regression lines. ... 27
Figure 3-1. Hypothesized effect of increasing cover crop diversity—as measured by species richness—on the relationship between cover crop biomass and weed
biomass reduction. ... 39
Figure 3-2. Hypothesized effect of cover crop type on the relationship between cover crop biomass and grass versus broadleaf weed biomass reduction. ... 40
Figure 3-3. Realized cover crop species richness versus planted cover crop species
richness. ... 42
Figure 3-4. Weed biomass reduction versus cover crop species richness with Pearson correlation coefficients (r) for each site. ... 43
Figure 3-5. Cover crop biomass versus cover crop species richness with Pearson
correlation coefficients (r) for each site.. ... 44
Figure 3-6. Weed biomass reduction versus cover crop biomass at each of the three sites. Exponential equation fit through each of the three data sets. ... 45
Figure 3-7. Grass and broadleaf weed biomass reduction versus cover crop biomass for grass (¯) and broadleaf (r) cover crop treatments at each of the three sites.
Exponential equation fitted through each of the three data sets.. ... 46
Figure 3-8. Reproduction of Table 2 from Tilman (1997). ... 49
Figure 3-9. Mean dry weed biomass versus mean dry crop biomass for wheat, pea, and canola in monoculture and mixtures. Data is from Szumigalski and Van Acker (2005). ... 51
Figure 3-10. Mean dry weed biomass versus mean dry crop biomass for barley and pea both in monoculture and mixtures. Data from Mohler and Liebman (1987).. ... 52
Figure 3-11. Mean percent weed cover versus mean percent cover crop cover for fourteen grass and legume cover crops. Data from Nelson et al. (1991). ... 54
Figure 4-1. Reproduction of Table 2 from Tilman et al. (1996). ... 66
Figure 4-3. Hypothesized effects of (a) increasing cover crop mixture species richness and (b) mixing plants on the relationship between soil nutrient concentration
changes and plant biomass. ... 72
Figure 4-4. Mean effect size of cover cropping on extractable soil nutrient concentrations from 0-10 cm (N=76). ... 74
Figure 4-5. Mean effect size of cover cropping on extractable soil nutrient concentrations from 0-10, 10-20, 20-30, and 30-60 cm (N=16).. ... 75
Figure 4-6. Extractable nutrient concentrations, 0-10 cm, versus total aboveground plant biomass with linear regressions plotted when slope parameter significantly different from zero at α = 0.05. ... 77
Figure 5-1. Hypothesized effect of increasing cover crop mixture diversity on soil
microbial biomass. ... 94
Figure 5-2. Total FAMEs extracted versus total aboveground plant biomass (N = 80) with linear regression for (a) all plots and (b) cover crop monoculture plots only. ... 96
Figure 5-3. Slope estimates of relationship between FAMEs and total plant biomass. .... 99
Figure 5-4. Soil microbial carbon versus total dry plant biomass (roots and shoots) for three grass species and three dicot species grown on two soils. Data from a
greenhouse study by Innes et al. (2004). ... 104
Figure 6-1. Hypothesized effect of increasing cover crop diversity on the relationship between standard deviation and mean cover crop biomass for each treatment. ... 114
Figure 6-2. Coefficient of variation for each treatment at each site plotted by species richness (left) and functional richness (right). ... 115
Figure 6-3. Coefficient of variation for each treatment at each site plotted by mean cover crop biomass.. ... 116
Figure 6-4. Standard deviation versus mean cover crop aboveground biomass for each treatment as averaged across plots within each site.. ... 117
Figure 6-5. Coefficient of variation versus mean dry crop biomass for wheat, pea, and canola in monoculture and in mixtures. Data is from Szumigalski and Van Acker (2005). ... 119
List of Tables
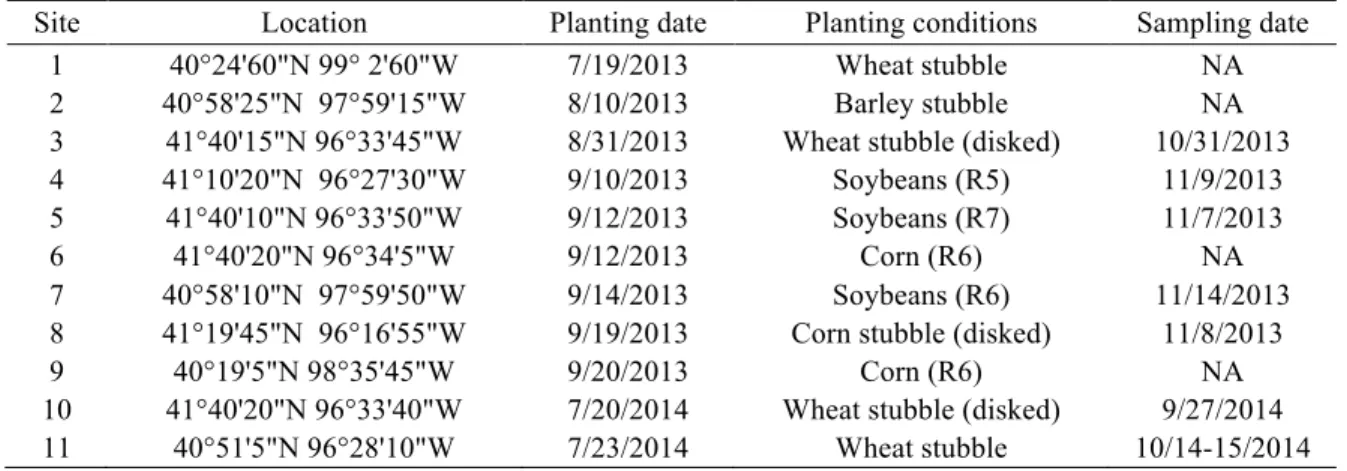
Table 2-1. Study locations, planting dates, planting conditions, and sampling dates. ... 9
Table 2-2. Summary of cover crop treatments for 2013. ... 10
Table 2-3. Summary of cover crop treatments added in 2014. ... 12
Table 2-4. Seeding rates used for each cover crop species in monoculture. ... 13
Table 3-1. Location, cover crop planting date, planting conditions, and aboveground biomass sampling date of the three sites used in this study. ... 37
Table 3-2. Parameter estimates for the exponential model fitted to weed biomass reduction versus cover crop biomass for each site with and without the inclusion of cover crop species richness (SR) as a predictive variable along with F-test results. 45 Table 3-3. Parameter estimates for the exponential model fitted to grass weed biomass reduction versus cover crop biomass for each site with grass and broadleaf cover crops separated and combined along with F-test results. ... 47
Table 3-4. Parameter estimates for the exponential model fitted to broadleaf weed biomass reduction versus cover crop biomass for site 10 with grass and broadleaf cover crops separated and combined along with F-test results. ... 47
Table 4-1. Soil chemical characteristics (±SEM) based on control plots (N=4). ... 69
Table 4-2. Parameter estimates for linear models relating soil extractable nutrient concentrations to total aboveground plant biomass by sampling depth. ... 76
Table 4-3. Parameter estimates for linear models relating soil nutrient concentration in the 0-10 cm depth (NC) for soil extractable NO3-N, P, K, SO4-S, and Cl to total aboveground plant biomass (BIOM) with cover crop species richness (SR) interacting with biomass (df = 78). ... 79
Table 4-4. Slope estimates for linear models relating soil extractable NO3-N, P, K, SO4-S, and Cl in the 0-10 cm depth to total aboveground plant biomass for cover crop monocultures (df = 36) and cover crop mixtures (df = 40) with F-test results. ... 80
Table 5-1. Classification, names, and amounts of individual FAMEs identified in bulk soil samples—absolute and relative . ... 95
Table 5-2. Parameter estimates for linear models (df = 77) relating total FAMEs to aboveground plant biomass (BIOM) with and without cover crop mixture species richness (SR) or functional richness (FR) interacting with plant biomass. ... 97
Table 5-3. Multivariate regression results for the relationship between FAMEs as (a) nmol·g-1 and (b) % total nmol and aboveground plant biomass (BIOM) with and without the addition of an interaction term between plant biomass and cover crop mixture species richness (SR) and functional richness (FR). ... 98
Table 6-1. Parameter estimates, degrees of freedom, and p-values for linear models relating standard deviation (SD) to mean cover crop aboveground biomass (BIOM) with and without cover crop species richness (SR) and functional richness (FR) interacting with cover crop aboveground biomass. ... 118
Chapter 1 - Introduction
Cover crops have long been used for a wide variety of functions including adding organic matter, suppressing weeds, decreasing nutrient leaching, and stimulating soil biota. Recently, however, there has been increased interest in the use highly diverse mixtures of cover crops. While it’s been asserted that mixing cover crops does everything from increasing biomass productivity, to increasing weed suppression, to enhancing nutrient retention, to fostering soil health through stimulating increased soil biota, to buffering against environmental variability, there is actually little empirical evidence to support these claims. It has been proposed that the many functions of cover crops are only improved with the use of more cover crop species, but these claims are based less on empirical evidence and based more on an intuition about diversity that prevails in both the fields of agriculture and ecology. The overarching objective of this project was to determine the effects of increasing cover crop mixture diversity on cover crop function. Cover crops are used for various functions and the goal of this project was to see if increasing cover crop diversity could be used as a tool to positively manage these functions.
In Chapter 2, I evaluate whether increasing cover crop mixture diversity increases average aboveground biomass. While increasing diversity did in many cases increase average aboveground biomass, I question the traditional interpretation of this kind of observation as evidence of the niche complementarity or increased resource use
efficiency of mixtures. I propose an alternate interpretation of this kind of observation— simply that monocultures tend to have lower average productivity because of the
In Chapter 3, I evaluate whether increasing cover crop mixture species richness increases weed suppression. While increased cover crop species richness was associated with increased weed suppression, once I controlled for the positive relationship between cover crop aboveground biomass and weed suppression, there was no observable effect of cover crop mixture species richness on weed suppression. In Chapter 3, I also evaluate whether grass cover crops are more suppressive of grass weeds than broadleaf cover crops and vice versa. I find no evidence that weeds are more suppressed by cover crops that are “more similar” to them.
In Chapter 4, I evaluate whether increasing cover crop mixture species richness increases soil nutrient retention. Specifically, I look at the concentrations and
distributions of soil extractable soil nitrate, phosphorus, potassium, sulfate, and chloride in the upper 60 cm of soil. I find evidence that cover cropping increases the retention of the relatively mobile soil nutrients—nitrate, sulfate, and chloride—in the upper portions of the soil profile and that these increases are mediated by cover crop biomass
productivity, but no evidence that increasing cover crop mixture species richness increases soil nutrient retention.
In Chapter 5, I evaluate the effect of increasing cover crop mixture diversity, as measured by both cover crop mixture species and functional richness, on soil microbial biomass and community structure. I find that cover cropping increases soil microbial biomass and that these increases are positively related to cover crop aboveground biomass but not to cover crop mixture diversity. Similarly, I find that while cover cropping alters soil microbial community structure and that these alterations are
predictably affected by cover crop biomass, they are not predictably affected by cover crop mixture diversity.
In Chapter 6, I evaluate the effect of increasing cover crop mixture diversity, as measured by both cover crop species and functional richness, on plot-to-plot
aboveground biomass variability. While increasing cover crop mixture diversity was correlated with decreases in variability and therefore increases in stability, I find that this relationship is driven by variations in aboveground biomass. More productive treatments tended to experience less variability. Once I accounted for the effect of productivity on variability, I found only marginal effects of cover crop mixture diversity on stability.
In each of the chapters, I challenge previous workers in the field on a variety of issues, but my primary criticism is that many previous workers simply misinterpret correlation as causation. That is, they interpret the correlation of diversity with various metrics of weed suppression, soil nutrient retention, soil microbial biomass, and stability as indications of diversity affecting these metrics. I found in this study and others, however, that once we take into account variations in biomass productivity between treatments, these apparent relationships between diversity and function disappeared. This is to say that productive monocultures were just as good at suppressing weeds, retaining nutrients, increasing soil microbial biomass, and performing stably as productive
mixtures and the reason that it sometimes appears that mixtures are better at doing these things is because productive mixtures are being compared to unproductive monocultures.
In Chapter 7, I attempt to consolidate each of these separate findings into a single, coherent narrative for cover crops and place this narrative into the broader context of existing diversity research.
Chapter 2 - Cover crop mixture diversity and productivity ABSTRACT
The diversity-productivity hypothesis proposes that increasing plant diversity increases average biomass productivity. The goal of this study was to test this hypothesis in the context of cover crop mixtures. Eighteen species of cover crops were used in this study representing six functional groups—cool-season grasses, cool-season legumes, cool-season brassicas, warm-season grasses, warm-season legumes, and warm-season broadleaves. Twenty to forty treatments reflecting varying levels of species and
functional richness were planted at eleven sites across southeastern Nebraska. Cover crop treatments ranged from containing one species to containing all eighteen species. Planting dates ranged from July 19 to September 20. Species specific aboveground biomass
measurements were taken prior to winterkill. Four sites were not sampled due to issues of cover crop establishment. Of the seven sites sampled, there was little evidence that increasing species richness without increasing functional richness increased average productivity. However, increasing functional richness had a marked positive effect on average aboveground biomass. The implications of this, however, are more mathematical than practical. The lower yielding legumes lowered the average productivity of the low functional richness category as compared to the high functional richness category where the higher yielding grasses and brassicas compensated for the low production of the legumes. In terms of practical cover crop management, there was no evidence of any mixture out-yielding the highest yielding monoculture at each site. While the diversity-productivity hypothesis was supported—this study suggests a rather simple, mathematical mechanism by which increasing diversity can increase average productivity.
INTRODUCTION
The diversity-productivity hypothesis proposes that greater diversity should lead, on average, to greater total biomass productivity (Tilman, 2001). The most common argument is that a single species leaves resources unexploited that another species might be able to come in and exploit—i.e., that more diverse systems are more productive due to increased niche complementarity or resource use efficiency. While many authors have observed a positive correlation between manipulated diversity and average productivity, the interpretation of these results as evidence of niche complementarity is contested (rev. deLaplante and Picasso, 2011).
Despite the controversy surrounding the diversity-productivity hypothesis, the idea that increased diversity equates increased average productivity has been entrenched in many fields as fact—particularly in agriculture. It’s not uncommon, for example, to read in the agricultural sciences that mixed cropping is associated with increased productivity (e.g., Anil et al., 1998; Ćupina et al., 2011; Lithourgidis et al., 2011; Seran
and Brintha, 2010).1 In one telling line, Ćupina et al. (2011) states that intercropping is “a
practical application of ecological principles based on biodiversity.” Thus, it’s clear that at least by some agricultural scientists, the diversity-productivity hypothesis is taken as proven principle instead of as an unproven hypothesis.
1 It should be noted that other workers in the field are much more cautious with their language. Rather than saying that intercropping increases productivity, they say that carefully designed mixtures have the potential to increase productivity—a subtle, but important difference (e.g., Francis, 1989; Malezieux et al., 2009).
Putting aside empirical evidence in favor of or against the hypothesis for a moment, why might we expect diversity to be positively related to productivity? The reasons given in both the ecological and agricultural sciences are the same—though slightly different language is favored. In the field of ecology, it’s not uncommon to hear reference to “niche differentiation”, “partitioning”, and “complementarity” (Lawton et al., 1998). In the field of agriculture, it’s more common to hear reference to “resource use efficiency” (iterum, Anil et al., 1998; Ćupina et al., 2011; Lithourgidis et al., 2011; Seran
and Brintha, 2010). The logic, however, is the same—that each species has different resource needs and different resource acquisition abilities. A monoculture therefore leaves some resources unexploited that another species might be able to exploit—e.g., through its differential root or canopy architecture. Thus, plant mixtures should have the potential to out produce plant monocultures because mixtures should be able to more fully exploit available resources (Vandermeer et al., 2002). That is, mixing plants should be able to raise the ceiling on biomass productivity reached by plant monocultures. This, however, is a different conclusion than increasing diversity increases average
productivity.
Interestingly, the logic commonly used to argue in favor of the diversity-productivity hypothesis, when taken to its logical conclusion, supports a different hypothesis. Increasing average productivity is not the same as increasing the ceiling on productivity. According to the logic of niche complementarity, increasing diversity shouldn’t necessarily increase average productivity. Rather it should increase the ceiling on productivity. This disconnect between the theoretical underpinnings of the diversity-productivity hypothesis and the theoretical conclusions of the diversity-diversity-productivity
hypothesis indicates two things. First, it indicates that we should be testing the theory of niche complementarity by testing whether increasing mixture diversity raises the ceiling on productivity rather than average productivity. Second, it indicates that niche
complementarity is not a sensible explanation for the diversity-productivity hypothesis as stated, or the necessary conclusion to be drawn from diversity-productivity observations.
The original objective of this study was to test the diversity-productivity hypothesis in the context of cover crop mixtures. The result has been to technically support the diversity-productivity hypothesis—i.e., to show an increase in average productivity with increased diversity—but to also demonstrate some flaws with the traditional interpretation of this as evidence of niche complementarity.
The primary and most unrelenting criticism of diversity-productivity research has been that the experimental designs of these studies are such that more productive species are more likely to be present in the higher levels of diversity. This effect has been
variously called the “sampling effect”, the “selection effect”, the “sampling bias”, and the “selection bias” with the results of a study with such an effect being called “experimental artifact” (Aarsen, 1997; Huston, 1997; Huston et al., 2000; Wardle, 1999). In this study I demonstrate that (1) even without sampling bias, positive diversity-productivity
relationships can still persist, and (2) even so, niche complementarity need not be invoked as the driving mechanism. Rather, a simple mathematical explanation exists to explain the observation—specifically, the average productivity of lower levels of
diversity is drawn down by low yielding species while the average productivity of higher levels of diversity is not drawn down to the same degree because high yielding species make up for low yielding species in mixture.
Before delving into the study, however, I want to briefly address the topic of facilitation. Facilitation effects between species are also cited as a possible mechanism for positive diversity-productivity relationships. However, I think listing this as an additional mechanism to niche complementarity confuses the issue. Facilitative effects are a mechanism by which a particular species might enhance the growth of another. This is more of a pair-wise interaction rather than the effect of diversity itself. Certainly the likelihood of this pair-wise interaction increases with increasing diversity, but if we use that logic to support the diversity-productivity hypothesis, how do we resolve that with the fact that increasing diversity also increases the likelihood of negative pair-wise interactions such as allelopathic interactions? It’s my opinion that we cannot point to positive pair-wise interactions in our justification of the diversity-productivity hypothesis without also acknowledging the potential for negative pair-wise interactions.
Furthermore, while the likelihood of including particular pair-wise interactions increases with increasing diversity, the relative effect of that pair-wise interaction is decreased or diluted with increasing diversity.
As yet another source of potential confusion, facilitation is sometimes regarded as a kind of complementarity (e.g., Cardinale et al., 2007). Here, however, I have chosen to draw a sharp distinction between complementarity, which I regard as the result of individual species having differing requirements, and facilitation, which I regard as the ability of one species or individual to modify the environment favorably for another (Callaway, 1995; Callaway and Pugnaire, 2007; Scherer-Lorenzen, 2008). It’s within this framework and with these definitions that I evaluate the positive diversity-productivity relationships observed in this study.
MATERIALS AND METHODS Research sites
This study was conducted at eleven sites across southeastern Nebraska. Cover crops were planted at a variety of points in a variety of crop rotations (Table 2-1). With the exception of site numbers 1 and 4, which were irrigated, all other sites were rain-fed.
Table 2-1. Study locations, planting dates, planting conditions, and sampling dates.
Site Location Planting date Planting conditions Sampling date 1 40°24'60"N 99° 2'60"W 7/19/2013 Wheat stubble NA 2 40°58'25"N 97°59'15"W 8/10/2013 Barley stubble NA 3 41°40'15"N 96°33'45"W 8/31/2013 Wheat stubble (disked) 10/31/2013 4 41°10'20"N 96°27'30"W 9/10/2013 Soybeans (R5) 11/9/2013 5 41°40'10"N 96°33'50"W 9/12/2013 Soybeans (R7) 11/7/2013 6 41°40'20"N 96°34'5"W 9/12/2013 Corn (R6) NA 7 40°58'10"N 97°59'50"W 9/14/2013 Soybeans (R6) 11/14/2013 8 41°19'45"N 96°16'55"W 9/19/2013 Corn stubble (disked) 11/8/2013 9 40°19'5"N 98°35'45"W 9/20/2013 Corn (R6) NA 10 41°40'20"N 96°33'40"W 7/20/2014 Wheat stubble (disked) 9/27/2014 11 40°51'5"N 96°28'10"W 7/23/2014 Wheat stubble 10/14-15/2014
Experimental design Treatments
The study was started in 2013 with twenty treatments representing monocultures and mixtures of nine species—barley, oat, wheat, Austrian winter pea, red clover, yellow sweetclover, radish, rapeseed, and turnip (Table 2-2). The nine species were selected to represent three functional groups—cool-season grasses, cool-season legumes, and brassicas. Note that the cool-season grasses used were all spring varieties, which winterkilled along with the legumes and brassicas.
Table 2-2. Summary of cover crop treatments for 2013.
No. Functional group(s) Treatment species No. of groups No. of
1 - No cover 0 0 Mo no cu lt ur es 2 Cool-season grasses (CG ) Barley (BAR) 1 1 3 Oats (OAT) 1 1 4 Wheat (WHT) 1 1 5 Cool-season legumes (CL)
Austrian winter pea (PEA) 1 1
6 Red clover (RED) 1 1
7 Yellow sweetclover (YEL) 1 1
8 Cool-season brassicas (CB) Radish (RAD) 1 1 9 Rapeseed (RAPE) 1 1 10 Turnip (TURN) 1 1 Mi xt ur es 11 CG BAR + OAT + WHT 3 1
12 CL PEA + RED + YEL 3 1
13 CB RAD + RAPE + TURN 3 1
14 CG + CL BAR + OAT + WHT + PEA + RED + YEL 6 2 15 CG + CB BAR + OAT + WHT + RAD + RAPE + TURN 6 2 16 CL + CB PEA + RED + YEL + RAD + RAPE + TURN 6 2 17 CG + CL + CB All 9 cool-season species 9 3 18
CG + CL + CB
BAR + PEA + RAD 3 3
19 OAT + RED + RAPE 3 3
20 WHT + YEL + TURN 3 3
Treatment 1 was a no cover control. Treatments 2-10 were all the species included in the study grown in monoculture.
Treatment 11 was a mixture of all three cool-season grasses, while treatments 12 and 13 were mixtures of all three cool-season legumes and brassicas, respectively. These treatments served to evaluate the effect of increasing species diversity without increasing functional diversity.
Treatment 14 combined the cool-season grasses with the cool-season legumes, and treatment 15 combined the cool-season legumes with the brassicas, while treatment
16 combined the cool-season grasses with the brassicas. The reasons for these treatments were to be able to observe any specific interactions between functional groups and to have a level of functional diversity intermediate between the prior treatments and treatment 17. Treatment 17 combined all nine species used.
Treatments 18-20 were random combinations of one season grass, one cool-season legume, and one brassica. These treatments were included as a way to evaluate the effect of increasing species richness without increasing functional richness and as a way to evaluate the effect of increasing functional richness without increasing species
richness. These last three treatments were designed so that each of the nine species was present in one of the three treatments. This was to avoid the issue of sampling bias.
In designing all of the treatments used, a point was made to make sure that each species was equally represented at each level of species and functional richness to address the issue of sampling bias.
In 2014, the study was expanded to include an additional 20 treatments (Table 2-3). Of these additional treatments, treatments 21-39 represented warm-season
analogues of treatments 2-20. That is, warm-season grasses, warm-season legumes, and warm-season broadleaves were used instead of the cool-season grasses, cool-season legumes, and brassicas. The species used were proso millet, sorghum sudangrass, teff, chickpea, cowpea, sunn hemp, buckwheat, safflower, and sunflower.
Treatment 40 was a combination of the original nine cool-season species and these nine warm-season species. This treatment wasn’t used in the analysis for this particular study into biomass productivity but it was used in the chapters that follow and has been included here for the sake of comprehensiveness.
Table 2-3. Summary of cover crop treatments added in 2014. No. Functional group(s) Treatment No. of species No. of groups Mo no cu lt ur es 21 Warm-season grasses (WG )
Proso millet (PROSO) 1 1
22 Sorghum sudangrass (SORG) 1 1
23 Teff (TEFF) 1 1 24 Warm-season legumes (WL) Chickpea (CHICK) 1 1 25 Cowpea (COW) 1 1
26 Sunn hemp (SUNN) 1 1
27 Warm-season broadleaves (CB) Buckwheat (BUCK) 1 1 28 Safflower (SAFF) 1 1 29 Sunflower (SUNF) 1 1 Mi xt ur es
30 WG PROSO + SORG + TEFF 3 1
31 WL CHICK + COW + SUNN 3 1
32 WB BUCK + SAFF + SUNF 3 1
33 WG + WL PROSO + SORG + TEFF + CHICK + COW + SUNN 6 2 34 WG + WB PROSO + SORG + TEFF + BUCK + SAFF + SUNF 6 2 35 WL + WB CHICK + COW + SUNN+ BUCK + SAFF + SUNF 6 2 36 WG + WL + WB All 9 warm-season species 9 3 37
WG + WL + WB
PROSO + CHICK + BUCK 3 3
38 SORG + COW + SAFF 3 3
39 TEFF + SUNN + SUNF 3 3
40 CG + CL + CB + WG + WL + WB All 18 species 18 6
Seeding rates
Seeding rates for the different cover crops in monoculture are presented in Table 2-4. These seeding rates were based on recommended broadcast rates (Clark, 2007). Cover crop mixture seeding rates were proportional to the rates used in
monoculture. For example, in a three species mix, each species was planted at one-third the full rate listed. The seeding rates for the brassica species were reduced in the second
year of this study as it was deemed the original seeding rate was higher than necessary to achieve maximum biomass.
Table 2-4. Seeding rates used for each cover crop species in monoculture. Functional
group Species Scientific Name
Seeding rate (g · m2) CS-G
Barley Hordeum vulgare L. 16.8
Oats Avena sativa L. 16.8
Wheat Triticum aestivum L. 16.8 CS-L
Austrian winter peas Pisum sativum L. ssp. sativum var. arvense 11.2 Red clover Trifolium pratense L. 1.7 Yellow blossom sweetclover Melilotus officinalis (L.) Lam. 1.7 CS-B
Radish Raphanus sativus L. 1.7* Rapeseed Brassica napus L. var. napus 1.7* Turnip Brassica rapa L. var. rapa 1.7*
WS-G
Proso millet Panicum miliaceum L. 2.8 Sorghum sudangrass Sorghum bicolor(L.) Moench var. sudanese (L.) Moench x Sorghum bicolor 5.6 Teff Eragrostis tef (Zuccagni) Trotter 0.6 W-SL
Chickpea Cicer arietinum L. 16.8 Cowpea Vigna unguiculata (L.) Walp. 11.2 Sunn hemp Crotalaria juncea L. 5.6 WS-B
Buckwheat Fagopyrum esculentum Moench 11.2 Safflower Carthamus tinctorius L. 2.8 Sunflower Helianthus annuus L. 0.6 *Seeding rate decreased to 1.1 g · m2 in 2014.
Treatment establishment
Treatments were arranged in a randomized complete block design with four replications at each site with the exception of site 11, which had only three replications for each treatment due to space constraints. Plots were 5 x 10 m—though these
6, 7, and 9. Treatments were hand broadcast into a variety of field conditions—after small grains harvest, after corn harvest, and into maturing corn and soybeans. In some instances harvested small grain fields were disked prior to cover crop establishment, in others the cover crop seeds were broadcast into standing stubble (Table 2-1). Field management decisions were left up to each cooperating farmer.
Plant sampling
Cover crop aboveground biomass was harvested approximately two months after planting. Vegetation was sampled using two randomly placed quadrats (0.18 m2) in each plot for site 3 and one randomly placed quadrat in each plot for the rest of the sites harvested. Cover crops were cut at the soil surface, separated by species and dried at 55°C for 7 days and weighed to determine dry biomass. Where present, weed
aboveground biomass was also sampled at this time. This data is presented in Chapter 3, which discusses cover crop diversity and invasibility.
Data analysis
The typical approach in ecology to analyzing the relationship between productivity and diversity is to regress productivity against diversity—treating a significant positive trending regression as evidence of the diversity-productivity hypothesis. I have avoided this approach because I think that there’s a more
straightforward way to test the hypotheses. Moreover, the use of regression analysis in this context can be misleading—an issue I will explore further in the discussion section of this chapter. Instead, the approach taken here has been to calculate estimates of the
“effect size” of increasing species and functional richness and then to test whether or not that effect is equal to zero using a simple one-sample t-test.
Species richness
To separate the effects of species richness from the effects of functional richness, I asked the question: “Does increasing species richness without increasing functional richness increase aboveground biomass?” I approached this question in two ways: (1) by tripling species richness within each functional group, and (2) by tripling the species richness of already functionally diverse mixtures. In the first case, for example, I took the aboveground biomass of the mixture that contained all cool-season grasses (treatment 11) and subtracted the average performance of the constituent monocultures (treatments 2, 3, and 4—barley, oats, and wheat, respectively). I then divided the difference by the
monoculture average and multiplied by 100 to express the effect size as a percent.
Effect size % = B3 species mix- Bmono
Bmono
* 100
In the second case, I compared the aboveground biomass of treatments 18, 19, and 20— these treatments each contained one cool-season grass, one cool-season legume, and one brassica (B̅18,19,20)—to treatment 17, which contained three cool-season grasses, three
cool-season legumes, and three brassicas (B17).
Effect size % = B17 -B18,19,20 B18,19,20
* 100
Functional richness
To determine the effect of increasing functional richness alone, I held species richness constant at three species and increased functional richness from one functional group to three. That is I compared the aboveground biomass of treatments 11, 12, and 13 to treatments 18, 19, and 20.
Effect size % = B18,19,20 - B11,12,13
B11,12,13 * 100 Species richness and functional richness combined
The effect of increasing species richness and functional richness simultaneously was tested by taking the aboveground biomass of the nine-species mixture (i.e., treatment 17) and subtracting the average aboveground biomass of those nine species (i.e.,
treatments 2-10), and then dividing by that average production of the monocultures.
Effect size % = B17 - B2-10 B2-10
* 100
Performing these calculations across multiple blocks and sites results in multiple estimates of effect size. To these approximately normal populations of estimates, I applied simple one-sample t-tests to determine the effects of (1) increasing species richness alone, (2) increasing functional richness alone, and (3) increasing species and functional richness together. In addition to reporting a simple dichotomous yes or no result of the t-test—i.e., “is there or isn’t there an effect?”—I report the 50% and 95% confidence intervals (CI) of the estimates.
Due to irregularities in the warm-season species data, which will be discussed in the results, as well as the low number of repetitions of these treatments, these treatments were excluded from this analysis, though treatment summary data are provided. All statistical analyses were conducted using R 3.1.0 (R Core Team, 2014).
RESULTS
Cover crop productivity by site
Of the 11 sites planted, 4 were not harvested for cover crops. At site 1, cover crop establishment was patchy throughout the site due to wheat stubble being swathed after cover crop planting. At site 2, there was no cover crop growth due to extreme weed pressure. At sites 6 and 9 there was minimal cover crop growth (< 25 g m-2)—likely due to a combination of moisture, light, and heat limitations.
Of those sites that were harvested, the earlier planting dates had the greatest aboveground biomass, with negligible biomass for those sites planted after the beginning of September (Figure 2-1). This result is consistent with the observation by Odhiambo and Bomke (2001) that late planted fall cover crops produce less dry matter than earlier planted fall cover crops. While there were likely other factors also affecting the variation between sites observed in Figure 2-1 (e.g., moisture, light, planting conditions),
successful fall cover crop establishment is much more likely with an earlier planting time—dry matter production being significantly correlated with growing degree days (Brennan and Boyd, 2012).
Figure 2-1. Boxplots of cover crop aboveground biomass for treatments #2-20 by planting date overlaid by individual data points which are jittered horizontally to aid in viewing.Three data points with biomass beyond 1000 g m-2 not shown but included in the creation of the boxplots. Note that planting dates are not temporally equidistant.
Cover crop productivity by treatment
Cover crop productivity by treatment varied widely across sites but a few patterns were consistent across all sites.
Monocultures
With regard to the cool-season species, the grasses and brassicas almost always out-produced the slower growing legumes (Figure 2-2; Figure 2-3). The best performing cool-season grass and brassica varied between sites. However, of the cool-season
legumes, winter pea consistently out-produced red clover and yellow blossom sweetclover, which produced negligible aboveground biomass at all sites.
As with the cool-season grasses and cool-season legumes, warm-season grasses tended to out-produce the warm-season legumes (Figure 2-4). The warm-season legumes, tended to produce more than their cool-season counterparts, with the exception of
chickpea, which performed poorly at both sites. As for the warm-season broadleaves, buckwheat was consistently one of the most productive warm-season species, safflower was generally one of the least productive, and sunflower productivity was highly inconsistent across the two sites. This is likely due to deer having grazed on the sunflower plants at site 11 but not site 3 prior to sampling.
Sampling at sites 3 and 11 happened after some of the warm-season species began to shed their foliage, leading the aboveground biomass values for some of the warm-season species to be less than they might have been had plant biomass been sampled earlier in the season. Figure 2-5 shows how warm-season species were beginning to senesce at cover crop harvest—brown colored plots—while cool-season species were continuing to grow—green colored plots. These irregularities in the warm-season species should be kept in mind when considering their biomass performance.
Figure 2-2. Species specific cover crop biomass (±SEM)for treatments 2-20 by site for 2013. The vertical dotted line separates monoculture (left) from mixtures (right).
Figure 2-3. Species specific cover crop biomass (±SEM) for treatments 2-20 by site for 2014. The vertical dotted line separates monoculture (left) from mixtures (right). One extreme outlier (1156 g·m2) for rapeseed was omitted from the bar chart for Site 11.
Figure 2-4. Species specific cover crop biomass (±SEM) for treatments 21-39 by site for 2014. The vertical dotted line separates monocultures (left) from mixtures (right).
Figure 2-5. Google Earth aerial imagery of Site 11 at time of cover crop harvest.
Mixtures
The cool-season mixtures tended to be dominated by brassicas when present. The warm-season mixtures tended to be dominated by sorghum sudangrass and buckwheat when present. A species performance in monoculture was fairly predictive of its
performance in mixture (i.e., high yielding species in monoculture continued to be high yielding in mixture and low yielding species in monoculture continued to be low yielding species in mixture). At no site did any mixture significantly out-yield the most productive monoculture.
Cover crop diversity and productivity
Increasing species richness while holding functional richness constant did not significantly increase average aboveground biomass (mean effect size = 2.3%, 95% C.I.
= [-7.2, 11.9%], N = 107, p-value = 0.65). However, increasing functional richness while holding species richness constant, increased aboveground biomass by an average of 28.6%, and increasing both functional and species richness simultaneously increased aboveground biomass by an average of 27.9% (Figure 2-6).
Figure 2-6. Mean effect size of increasing cover crop diversity on cover crop
productivity—specifically the effects of increasing species richness (ñSR), increasing functional richness (ñFR), and increasing both species and functional richness
simultaneously (ñSR & FR). Boxes and bars represent 50% and 95% confidence
intervals, respectively. N = number of observations for each estimate. One observation is missing from the ñSR & FR category. Asterisks indicate p-value for the following test— H0: µ = 0; Ha: µ ≠ 0. P-value > 0.05 (no asterisk); < 0.05(*);< 0.01(**);< 0.001(***).
DISCUSSION
Increasing plant mixture diversity, particularly functional richness, was associated with increased average aboveground biomass. This is consistent with previous findings using manipulated grasslands and other plant mixtures (rev. Cardinale et al., 2007; rev.
Cardinale et al., 2011; Spehn et al., 2005). I argue, however, that there is no need to invoke niche complementarity or increased resource use efficiency to explain this observation. Rather, the positive effect of increasing plant mixture diversity on average productivity is easily explained by low yielding species pulling down the average at low levels of diversity but not at high levels of diversity.
Specifically, the pattern observed was simply the consequence of the average productivity of the monocultures and low functional richness category being brought down by the low yields of the legumes. In the high diversity treatments, the high yields of grasses and brassicas compensated for the low yields of legumes. This is why mixing across functional groups led to increased average productivity but not mixing within a single functional group. Mixing the grasses or the brassicas with each other did not increase average productivity because there were no low yielding species being
compensated for in the mixture. Similarly, mixing the legumes together did not increase average productivity because there was no high yielding species in the mix to compensate for the low yields of the legumes.
Much attention has been paid to the difference between species and functional richness in the literature, with some authors arguing that we pay more attention to functional richness (Diaz and Cabido, 2001). I argue that the issue is not so much about increasing species versus functional richness, but about whether the species we are mixing produce markedly different amounts of biomass when planted in monoculture. I suspect the reason functional richness appears to be a driver of productivity in many studies is that plants from the same functional group tend to produce similar amounts of biomass.
Classical ecological approach: a misleading use of regression analysis
Classical diversity-productivity studies present their results by plotting average biomass productivity against a diversity metric—most often that metric is species
richness. The general approach is to regress productivity against the diversity metric. The statistical significance of such a regression is then used as evidence of the positive effect of diversity on biomass production (e.g., Fornara and Tilman, 2009; Fridley, 2002; Hector et al., 1999; Klironomos, 2000; Roscher et al., 2005; Schnitzer et al., 2011; Tilman et al., 1996; Tilman et al., 1997; Tilman et al., 2001; Zhang et al., 2010). Within this generalization there are many variations. For example, sometimes instead of using species richness as the diversity metric, functional richness or phylogenetic diversity is used (e.g., Cadotte et al., 2008; Connolley et al., 2011; Hooper, 1998; Hooper and Dukes, 2004; Hooper and Vitousek, 1997). Additionally, the x- or y- metric is sometimes
transformed. For example, the logarithm of species richness might be used instead of species richness itself (e.g., Loreau et al., 2001; Naeem et al., 1996; Naeem et al., 1995) or sometimes biomass productivity is log-transformed (e.g., Jiang et al., 2007). There is also variation in terms of the form of the regression that is used. While simple linear regression is quite common, it is also popular to use non-linear regression—particularly models that show a saturating effect of diversity—i.e., decreasing returns on increasing diversity. For example, exponential, logarithmic, power, and hyperbolic functions are frequently tested and used (e.g., Cardinale et al., 2006; Hooper et al., 2005; Symstad et al., 1998, Tilman et al., 1997). All of this slight variation in analysis, however, is peripheral to and distracts from the fact that regression analysis is a poor tool for the purpose of testing and understanding the diversity-productivity hypothesis. We have
prematurely asked, “What is the shape of the diversity-productivity relationship?” before we have asked “Is there a diversity-productivity relationship?” and “Why is there a diversity-productivity relationship?” Moreover, the results of regression analysis are easily misinterpreted by both casual observers and scientists deeply entrenched in the subject matter. It’s easy to misinterpret plots like the ones shown in Figure 2-7 where I have analyzed the results from Site 3 much in the fashion it would have been analyzed in the field of ecology. It’s easy to think that this figure shows that increasing plant mixture diversity increases potential biomass yield, but this is not the case with the data. While there is nothing false about what has been presented in the figure, it is nevertheless misleading.
Figure 2-7. Mean cover crop biomass (±SEM) by cover crop species and functional richness for Site 3 with ordinary least squares regression lines.
Significant regressions like these are routinely used by scientists as evidence of the diversity-productivity hypothesis and furthermore of niche complementarity. My
interpretation of what is happening is different, almost embarrassingly simplistic, and more apparent when we use estimated effect sizes rather than regressions to test the diversity-productivity hypothesis. Simply, when there is bare space on the ground left by a not very productive species and you add more vegetation by adding another species, you get more vegetation. While this may seem like a simple description of niche complementarity, consider the fact that we could also get more vegetation by adding more of the same species rather than a different species. For example, He et al. (2005) found that the positive relationship between diversity and productivity decreased with increasing plant density—that is, simply increasing the density of the monocultures brought the biomass up to the high levels of the mixtures. One of the untested
assumptions in many plant diversity and mixed cropping studies is that the monoculture densities used are optimal, but this assumption is rarely tested.
Cover crop management conclusions
While the goal of this study was not to see if mixing cover crops could raise the ceiling on monoculture productivity, I found no evidence that simply increasing the number of species or functional groups in a cover crop mixture increased the ceiling on biomass productivity. None of the twenty-one mixtures tested outperformed the best performing monoculture of the eighteen species tested at any of the seven sites. Though there are some cases in the scientific literature where mixtures perform better than the best performing species in monoculture, in the overwhelming majority of cases they do not (Donald, 1963; Garnier et al., 1997; Picasso et al., 2008; Smith et al., 2014; Trenbath, 1974; Vandermeer et al., 2002; Wortman et al., 2012). Thus, to cover crop managers looking to maximize cover crop biomass production, I recommend picking a productive
species, giving it as long of a growing season as possible as well as a weed free start. There is no indication that increasing cover crop mixture diversity will increase potential cover crop biomass productivity.
Parting thoughts regarding the plant mixture diversity and resource use efficiency
Niche theory predicts that diverse systems should have the potential to be more productive than even the most productive of monocultures by capturing a greater
proportion of the available resources—but this is not what has been observed. Cardinale et al. (2006) called understanding this disconnect between theory and observation one of the foremost challenges in the diversity-productivity field. However, if a monoculture can entirely capture a single necessary resource to plant growth, such as and very often light, even if another species is able to capture additional remaining resources, that species cannot do so without that one necessary resource. Therefore the addition of species does not necessarily equate the capturing of more resources and the increasing of total biomass productivity. This idea is further explored in Chapter 3, where I discuss how a single species can be just as weed suppressive as a diverse mixture of species.
References
Aarsen, L.W. 1997. High productivity in grassland ecosystems: effects by species diversity or productive species? Oikos 80:183-184.
Anil, L., J. Park, R. H. Phipps, and F. A. Miller. 1998. Temperate intercropping of cereals for forage: A review of the potential for growth and utilization with particular reference to the UK. Grass Forage Sci. 53:301-317.
Brennan, E. B., and N. S. Boyd. 2012. Winter Cover Crop Seeding Rate and Variety Affects during Eight Years of Organic Vegetables: I. Cover Crop Biomass Production. Agron. J. 104:684-698.
Cadotte, M. W., B. J. Cardinale, and T. H. Oakley. 2008. Evolutionary history and the effect of biodiversity on plant productivity. PNAS 105(44):17012-17017. Callaway, R. B., and F. I. Pugnaire. 2007. Facilitation in Plant Communities. In: F. I.
Pugnaire, and F. Valladares, editors, Functional Plant Ecology, 2nd ed. CRC Press, Boca Raton, FL. p. 435-455.
Callaway, R. M. 1995. Positive Interactions among Plants. Bot. Rev. 61(4):306-349. Cardinale, B. J., D. S. Srivastava, J. E. Duffy, J. P. Wright, A. L. Downing, M. Sankaran,
and C. Jouseau. 2006. Effects of biodiversity on the functioning of trophic groups and ecosystems. Nature 443(26):989-992.
Cardinale, B. J., J. P. Wright, M. W. Cadotte, I. T. Carroll, A. Hector, D. S. Srivastava, M. Loreau, and J. J. Weis. 2007. Impacts of Plant Diversity on Biomass
Production Increase through Time because of Species Complementarity. P. Natl. A. Sci. USA 104(46):18123-18128.
Cardinale, B. J., K. L. Matulich, D. U. Hooper, J. E. Byrnes, E. Duffy, L. Gamfeldt, P. Balvanera, M. I. O’Connor, and A. Gonzalez. 2011. The functional role of producer diversity in ecosystems. Am. J. Bot. 98:572-592.
Clark, A., editor. 2007. Managing Cover Crops Profitably. 3rd ed. Sustainable Agriculture Network, Beltsville, MD.
Connolly, J., M. W. Cadotte, C. Brophy, A. Dooley, J. Finn, L. Kirwan, C. Roscher, and A. Weigelt. 2011. Phylogenetically diverse grasslands are associated with
pairwise interspecific processes that increase biomass. Ecology 92(7):1385-1392.
Ćupina, B., A. Mikić. F. L. Stoddard, Đ. Krstić, E. Justes, L. Bedoussac, J. Fustec, and B. Pejić. 2011. Mutual Legume Intercropping for Forage Production in Temperate Regions. In: E. Lichtfouse, editor, Genetics, Biofuels and Local Farming Systems. Sustainable Agriculture Reviews. Springer Science. Dordrecht, Netherlands. p. 347-365.
deLaplante, K. and V. Picasso. 2011. The Biodiversity-Ecosystem Function Debate in Ecology. In:D. M. Gabbay, B. Brown, P. Thagard, K. De Laplante, K. Peacock, and J. Woods, editors, Philosophy of Ecology. Handbook of the Philosophy of Science Vol. 11. Elsevier, Oxford, UK. p. 169-200.
Díaz, S. and M. Cabido. 2001. Vive la différence: plant functional diversity matters to
ecosystem processes. Trends Ecol. Evol. 16(11)646-655.
Donald, C. M. 1963. Competition among crop and pasture plants. Adv. Agron. 15:1-118. Fornara, D. A., and D. Tilman. 2009. Ecological Mechanisms Associated with the
Positive Diversity—Productivity Relationship in an N-Limited Grassland. Ecology 90(2):408-418.
Francis, C.A. 1989. Biological efficiencies in multiple cropping systems. Adv. Agron. 42:1-42.
Fridley, J. D. 2002. Resource availability dominates and alters the relationship between species diversity and ecosystem productivity in experimental plant communities. Oecologia 132:271-277.
Garnier, E., M-L. Navas, M. P. Austin, J. M. Lilley, and R. M. Gifford. 1997. A problem for biodiversity-productivity studies: how to compare the productivity of
multispecific plant mixtures to that of monocultures. Acta Oecol. 18(6):657-670. He, J., K. S. Wolfe-Bellin, B. Schmid, and F. A. Bazzaz. 2005. Density may alter
diversity-productivity relationships in experimental plant communities. Basic Appl. Ecol. 6:505-517.
Hector, A., B. Schmid, C. Beierkuhnlein, M.C. Caldeira, M. Diemer, P.G.
Dimitrakopoulos, J. Finn, H. Freitas, P.S. Giller, J. Good, R. Harris, P. Högberg, K. Huss-Danell, J. Joshi, A. Jumpponen, G. Körner, P.W. Leadley, M. Loreau, A. Minns, C.P.H. Mulder, G. O’Donovan, S.J. Otway, J.S. Pereira, A. Prinz, D.J. Read, M. Scherer-Lorenzen, E-D. Schulze, A-SD. Siamantziouras, E. Spehn, A.C. Terry, A.Y. Troumbis, F.I. Woodward, S. Yachi, J.H. Lawton. 1999. Plant
diversity and productivity experiments in European grasslands. Science 286:1123-1127.
Hooper, D. U. 1998. The role of complementarity and competition in ecosystem responses to variation in plant diversity. Ecology 79(2):704-719.
Hooper, D. U., and J. S. Dukes. 2004. Overyielding among plant functional groups in a long-term experiment. Ecol. Lett. 7:94-105.
Hooper, D. U., and P. M. Vitousek. 1997. The Effects of Plant Composition and Diversity on Ecosystem Processes. Science 277:1302-1305.
Hooper, D. U., F. S. Chapin, J. J. Ewell, A. Hector, P. Inchausti, S. Lavorel, J. H. Lawton, D. M. Lodge, M. Loreau, S. Naeem, B. Schmid, H. Setälä, A. J. Symstad, J. Vandermeer, and D. A. Wardle. 2005. Effects of biodiversity on ecosystem functioning: a consensus of current knowledge. Ecol. Monogr. 75:3-35.
Huston, M. A., L. W. Aarssen, M. P. Austin, B. S. Cade, J. D. Fridley, E. Garnier, J. P Grime, J. Hodgson, W. K. Lauenroth, K. Thompson, J. H. Vandermeer, and D. A. Wardle. 2000. No Consistent Effect of Plant Diversity on Productivity. Science 289:1255.
Huston, M.A. 1997. Hidden treatments in ecological experiments: re-evaluating the ecosystem function of biodiversity. Oecologia 110:449-460.
Jiang, X. L., W. G. Zhang, and G. Wang. 2007. Biodiversity effects on biomass
production and invasion resistance in annual versus perennial plant communities. Biodivers. Conserv. 16:1983-1994.
Klironomos, J. N., J. McCune, M. Hart, and J. Neville. 2000. The influence of arbuscular mycorrhizae on the relationship between plant diversity and productivity. Ecol. Lett. 3:137-141.
Lawton, J. H., S. Naeem, L. J. Thompson, A. Hector, and M. J. Crawley. 1998. Biodiversity and Ecosystem Function: Getting the Ecotron experiment in it Correct Context. Funct. Ecol. 12(5):848-852.