Institute for Empirical Research in Economics
University of Zurich
Working Paper Series
ISSN 1424-0459
Working Paper No. 334
Awards as Incentives
Susanne Neckermann and Bruno S. Frey
* The authors thank Hans Hofmann for making this study possible and Claudia Bernasconi for excellent research assistance. We further thank Christine Benesch, Matthias Benz, Charles Efferson, Silke Humbert, Simon Lüchinger, Adrian Röllin, Katja Rost, Alois Stutzer, Thorsten Teichert, and Antoinette Weibel for helpful comments.
Awards as Incentives*
Susanne NeckermannUniversity of Zurich, CH-8006 Zurich, Switzerland [email protected]
Bruno S. Frey
University of Zurich, CH-8006 Zurich, Switzerland
CREMA, CH-4052 Basle, Switzerland
This Version November 2008 Abstract:
Non-monetary incentives in the form of awards have so far escaped the attention of economists despite their widespread use. This paper presents an experiment conducted online at IBM to assess the impact of these kinds of extrinsic incentives. Introducing a hypothetical award has statistically significant effects on stated contributions to a public good. Our design allows the estimation of the impact of different award characteristics related to, for example, how public or how valuable the award is. We illustrate these findings by providing predictions about the behavior induced by a new award at IBM. (94 words)
JEL classification: C99, J33, M52
1. Introduction
Awards are present just about anywhere one looks in society, but they have nevertheless been neglected in economics as incentive instruments. They are used extensively by states in the form of decorations and medals. In arts, culture, sports and media, awards are also of central importance. Furthermore, awards are increasingly popular in the corporate sector, where managers consider innovative human resource practices, such as awards, to be essential for firm competitiveness (Ichniowski and Shaw 2003). In his book 1001 Ways to Reward Employees (Nelson 2005) provides ample evidence of the number and variety of awards in companies. The prevalence and popularity of awards in the corporate sector suggest that awards fulfill important functions in principal-agent relationships. These kinds of social incentives derive their value from the combination of status and esteem, positive feedback, and material benefits that they offer. Recent advances in behavioral economics have made efforts to explicitly model the impact of such considerations on work effort. However, to date there is basically no convincing empirical knowledge on awards despite their prevalence. One reason for this is that awards are extremely hard to study. In the lab, it is difficult to create a meaningful award situation. In the field, it is hard to find suitable control groups, as awards are typically not handed out randomly, and to measure performance, as awards typically reward vague outputs that go beyond normal duty. In two other papers we have demonstrated that awards have a measurable impact on performance (see Neckermann, Cueni and Frey 2008; Neckermann and Kosfeld 2008). However, it is still unclear how awards work as incentives. This paper addresses two main questions:
(1) What features of awards motivate employees (e.g. their scarcity, their publicity, the associated monetary bonus)?
(2) What happens when employees receive an award? Do winners increase or decrease their performance? How do non-recipients react?
To answer these questions, a survey experiment was conducted online with the employees of the IBM research lab in Rüschlikon, Switzerland. The survey focuses on the quantitative effect of introducing and handing out an award on voluntary work behaviors and analyzes what award characteristics determine the size of the effect. We find that respondents react systematically to the announcement of the award: the willingness to contribute to a public good increases monotonically with the value of the monetary payment or gift that comes with the award and is lower for gifts than payments of equal value. Contributions are significantly higher for awards whose winners are publicized within the company and for awards whose winners are celebrated in a public ceremony. We find that non-recipients decrease and recipients increase their stated contributions as compared to the motivation they indicated before the award was announced. Overall, we conclude that awards have a significant impact on motivation and induce systematic changes in behavior. Therefore, awards have the potential to serve, and should be taken seriously, as incentive instruments.
The following section provides an overview of the literature relevant to the study of awards. Section 3 describes the vignette technique, set-up of the study, as well as the theories guiding the research design. In section 4 we present the results and section 5 concludes.
2. State of research
Economic research has largely disregarded awards. However, there are analyses that address isolated aspects of awards. Auriol and Renault (2008), Ederer and Patacconi (2004), and Loch et al. (2001), for example, demonstrate that status considerations are
important determinants of work effort. Ellingsen and Johannesson (2007) show that the same is true for respect. Sururov and van de Ven (2006) argue that discrete rewards motivate due to the feedback they provide. At the same time, awards can induce organizational commitment, for instance, via their impact on employee identity, as is discussed in Akerlof and Kranton (2005). Moreover, awards are aspired due to their value as signals of high motivation and talent to outsiders (see e.g. Spence 1973, 1974). Findings from the tournament literature, beginning with Lazear and Rosen (1981), are relevant for understanding and optimizing award procedures.1
Rare exceptions of economic analyses of awards are Gavrila et al. (2005) describing the optimal solution for the management of awards over time, Besley and Ghatak (2008) analyzing a principal-agent setting with social rewards of zero marginal costs, Markham et al. (2002) showing that the introduction of a public recognition program reduces absenteeism, Neckermann and Kosfeld (2008) reporting that the announcement of an award significantly increases work performance in a field experiment, and Neckermann et al. (2008) documenting that receiving an award increases subsequent work performance in a call center.
3. Design of the study and operationalization
3.1. The vignette technique
We use the vignette study technique, in which subjects are presented with short descriptions of hypothetical situations called vignettes and asked to indicate their behavior if they were in the described situation. Each vignette consists of randomly
1 Of course, some of these issues also apply to bonuses. Hence, our analysis also
selected values for each vignette dimension. The vignette dimensions are the factors that define the situation and represent those variables whose impact on behavior the researcher wants to study. The systematic variation of the values in the different dimensions allows the researcher to estimate the effects of changes in combinations of variables as well as changes in individual variables. Further methodological information is, for instance, provided in Rossi and Anderson (1982), McFadden (2001), and Hensher et al. (1999).
Traditional survey approaches tend to elicit unreliable and biased self-reports, as the questions are too abstract (see Bertrand and Mullainathan 2001, and Alexander and Becker 1978). The vignette technique is preferable, because vignettes closely resemble real-life decision-making situations and are precisely specified, so that the information subjects have at their disposal when making their decisions is standardized. In particular, respondents evaluate a complete situation description (bundle of different factors), rather than having to state how isolated factors influence their behavior. The researcher only later connects the answers of the different individuals with the variables in the description to isolate the impact of particular factors. This is cognitively less challenging and more natural for the respondents and decreases the risk that respondents consciously bias their answers towards socially desirable responses. It also alleviates the problem that most people are not very insightful about the factors that enter their own decision making process, particularly when factors are highly correlated in the real world. Hence vignette studies are more likely than other survey approaches to elicit stable and true preferences. Among many others, Telser and Zweifel (2007), demonstrate the ability of vignette experiments to predict choice behavior. Moreover, results from vignette studies have been shown to be reliable over time, attribute sets, and data collection methods (Bateson et al. 1987).
We deliberately chose a survey experiment rather than a laboratory or field experiment to investigate awards for the following reasons. First, awards present social incentives. Their value – or at least a great part of it – depends on a meaningful relationship of the recipients with both the award giver and the co-workers. Hence, we would expect that awards would not function well in an anonymous lab setting with an abstract effort task and the experimenter as the award-giver. Second, the investigation of the relative impact of certain award characteristics requires a variation of these features over employees. Such a discrimination of employees in similar positions at the same company is typically not possible in the field, especially the variation of such sensitive reward features as the dollar amount of the associated bonus. Third, a great advantage of vignette studies is that they provide more control than qualitative or observational studies but, at the same time, put respondents in situations that are very natural for them and involve decisions about bundles of factors. Subjects may consider it easier and more natural to make decision under such circumstances than under laboratory conditions. At the same time, vignette studies exhibit a high degree of uniformity and control over the stimulus situation approximating that achieved by researchers using laboratory experimental designs. Confounding factors are not a problem, because vignettes are randomly constructed and randomly assigned to a large number of subjects. This ensures that the causal factors are uncorrelated on average, which allows the clean econometric estimation of effects.
Vignette studies are typically not incentivized and one might doubt the accuracy of the stated answers and their capacity to predict actual work behavior. In our particular case, however, these issues are unimportant for two reasons. First, the subject pool consists of experienced researchers that are well aware of the importance of making accurate answers for the validity of the scientific study that they participate in. Further,
participation was voluntary, so we are confident that those employees that participated in the study also took the time to carefully think about their answers. Second, any potential upward biases in the stated contributions to the public good does not matter for the analysis, as we only look at differences in stated contributions for awards with different characteristics. Moreover, we control for individual fixed effects, which filters out some – if not all – of the potential upward bias in the level of contributions.
While vignettes studies are a common research tool in sociology, marketing, and health economics and there exists a large literature on the method and its reliability and external validity, only Falk and Kosfeld (2006) use this technique in behavioral economics to complement their set of experiments assessing the impact of control on effort in the workplace.
3.2. Theory and operationalization of reward treatments
Each vignette describes the introduction of a new incentive for all employees at the IBM research lab in Rüschlikon. All vignettes have identical textual descriptions; they only differ in terms of the realized factor levels in each of the five different vignette dimensions. Each subject is randomly assigned an award with a particular set of factor levels, and the assignment procedure is precisely analogous to assigning experimental subjects to different treatment combinations in an experimental study. In a pre-study we surveyed awards at different companies and conducted interviews with a number of human resource managers. For the present study, we chose those four, orthogonal factors that that were considered to be important by all managers and that varied most between the different awards surveyed.2
.
2
The supplementary material at the end of this paper contains the wording of the four factors as well as
Factor 1, type of accompanying reward. According to standard economic theory compensation should always be in cash, as it is the most efficient means of compensation due to its fungibility and option value (e.g. Waldfogel 1993, 1996). A gift of the same monetary value does not lead to a higher utility than the equivalent payment in cash making gifts worse as incentives. However, motivational crowding and signaling theory argue that gifts can lead to a higher motivation because gifts are less likely to be perceived as controlling or as destroying the signaling value of certain actions (e.g. Frey 1997, Frey and Jegen 2001, or Bénabou and Tirole 2004). Social and cognitive psychology describe further advantages of gifts, so far neglected in economics, that may be sufficient to reduce or eliminate any inherent advantage of cash as an incentive (Jeffrey and Shaffner 2007).
To shed light into this theoretical discord about whether cash or gifts of equal monetary value are better motivators, we used cash as well as gifts as prizes associated with receiving the reward.
Factor 2, degree of publicity. In addition to the motivational power of the prospect of winning the incentive per se, rewards can function as signals to outsiders of the recipient’s ability and motivation and bring social recognition by an extended set of colleagues. This requires a degree of publicity; other persons need to know about the award.
To measure the behavioral impact of visibility, each vignette contained one of the following three types of publicity. First, the list of recipients remains undisclosed. Second, the list of recipients is published on the worldwide intranet for all other employees to see. Third, in addition to publicizing the list of recipients on the intranet, the company arranges a formal ceremony in which the award is handed to the
recipients. As with all vignette dimensions, the type of publicity was randomly selected for each vignette.
Factor 3, amount of cash/value of gift. The accompanying cash payment or gift of the rewards described in the vignettes varied in value between CHF 0 and CHF 10000.3
We expect that motivation increases with the value of the reward.
Factor 4, the maximum number of recipients. Awards only work as incentives if the prospective recipients value them. The perceived (positional) value of an award depends critically on the award being scarce (e.g. Hirsch 1976). This is a major difference between awards and money. The value of money per se is not decreased by the fact that other employees also receive a salary.4 Hence, the effect of awards should
be lower the greater the number of recipients. However, there is a countervailing effect. An increase in the number of reward recipients, ceteris paribus, increases the chances an individual employee will be a winner. Hence, we hypothesize an inverted u-shaped relationship between the number of recipients and motivation. The same prediction follows from the tournament literature, which shows that maximal
3
The set of possible values was CHF 0, CHF 50, CHF 150, CHF 300, CHF 1000, CHF 2000, CHF 4000, CHF 6000, CHF 8000, and CHF 10000. The equivalent Dollar amounts are approximately equal to $ 0, $ 43, $ 128, $ 257, $ 857, $ 1713, $ 3427, $ 5140, $ 6854, $ 8567. In the statistical analysis, monetary value was treated as a continuous variable. Hence, the number of observations necessary to reliably estimate the effect can be substantially lower than when the variable is categorical.
4 For both awards and salaries it is true that recipients might gain utility from having more awards/ a higher salary than their colleagues. However, this social comparison effect (relative income effect) is different from the inflation effect discussed above.
incentives occur for intermediate promotion rates, and lower incentives occur for lower and higher promotion rate (Gibbs 2001).
To study the impact of additional recipients on motivation, the maximum number of award recipients per year varied between 1, 2, 6, 10, 16, and 20 in the reward descriptions.5
Table 1 gives an overview of the factors and their levels. Further details are provided in the supplementary material at the end of this paper. The number of factors and their levels appears to be rather large. However, by asking people to answer to many situation descriptions, a large number of observations can be generated, which can be evaluated with multiple-regression analysis (rather than mean-comparison). Therefore, fewer observations per factor combination are necessary to reliably estimate the impact of a certain factor.
TABLE 1 ABOUT HERE
3.3. An illustration of a vignette
Individual vignettes, i.e. award descriptions, are constructed by randomly choosing one factor level from each of the independent factors.6
The total pool of vignettes
5 Like the monetary value of the reward, the number of recipients is treated as a continuous
variable in the statistical analysis.
6
While the assignment of vignettes to individual respondents was random, we ensured that the four award descriptions each subject was confronted with differed in terms of factor levels (e.g. we ensured that each person received one award with zero, small, medium, and high monetary value). Further, each person received at least one award with a cash payment, and one award with a gift. This was necessary to ensure that subjects were not confused by the potential close similarity of award realizations caused by a purely random assignment. Further,
comprises all possible factor combinations. The four vignettes for each subject were sampled without replacement from this pool. Not all possible vignettes have to be answered as long as the levels of the different factors in the set of vignettes are uncorrelated, i.e. as long as there is little multi-collinearity, and as long as there is sufficient variation in the vignettes. In the sample of vignettes drawn in our study both of these conditions are met. We also have no endogeneity problems as the respondents answered to all the vignettes presented to them.7
Below a specific vignette is exhibited with realized factor levels in bold. The factors and their levels are shown in parentheses; subjects did not see this information. The introductory text that was displayed in front of each vignette is presented in the supplementary material at the end of this paper.
IBM introduces a new “Cooperation Award”. Nominations must originate within the team and be supported by the project leader/manager. One level of management in the home office needs to approve the award for the nominated person.
In recognition of the recipients’ contribution, the award comes with a ballpoint pen labeled “Thank you for your exceptional contribution!” (factor: type of accompanying reward; level: gift; factor: value of gift; factor level: CHF 0).
There will be up to 16 recipients (about 6% of researchers and non-technical staff)
we randomized the order in which the different factors appeared in the award description to control for order effects.
7
Of the 220 observations for the willingness to contribute only nine present instances in which “no answer” was marked. These “no answers” do not appear to correlate with any specific award features, but rather stem from three researchers who answered to zero, one and two vignettes respectively, i.e. researcher who indiscriminately chose not to answer to the question.
per year in the Rüschlikon lab (factor: maximum number of recipients; factor level:
16).
The lab director congratulates the winner(s) in the presence of the other members of the lab at the kick-off meeting in January 2008. Award recipients arepublished on the intranet (factor: degree of publicity; factor level: ceremony and publication on the intranet).
3.4. Operationalization of the dependent variable
The subjects were asked to indicate their willingness to share an important finding with their team before publishing it under their own name. Individuals were told that sharing the finding now would increase the quality and speed of the team project, but expose them to the personal risk that the finding could be used and published without giving them the appropriate personal credit for the discovery. Alternatively, they could wait and publish the finding in a scientific journal under their own name before sharing it with team colleagues. Respondents marked their willingness on a 10-point scale ranging from 1="I definitely would not share now." to 10="I would certainly share now." Employees were familiar with this type of public good situation in their everyday work life, as was confirmed in interviews preceding the study. In the survey, about 84% of the respondents rated the situation description as realistic or very realistic. The supplementary material contains the wording of the situation description and the questions asked.
3.5. Study design
First, we asked the respondents to state their willingness to share the finding assuming they were working in their current work environment (status quo). Then, subjects were sequentially confronted with four vignettes, i.e. the scenarios describing the
introduction of a reward, and asked to indicate their willingness to share the finding in each of them. As each subject answers to four different vignettes, we have multiple observations per person and can control for effects specific to the individual. Due to time constraints, it was not possible to ask about more than four vignettes per subject. These four reward descriptions per individual present a random set out of the total pool of over 100 different reward descriptions, i.e. combinations of values in the four dimensions that characterize each reward. After the fourth vignette, subjects were asked to imagine that they either did or did not receive the reward that was described to them in the final award introduction scenario (vignette 4) and asked again how willing they would be to share the finding now that they know whether they received reward 4 or not.8
Because this question was asked only once, we have only one observation of the motivation after revealing the recipients per respondent (rather than four in the case of motivation after incentive announcement). However, we can still draw general conclusions, as the fourth and final reward descriptions represent a random draw from the set of all possible vignettes. The survey ended with a section in which respondents
8
Reasons for inquiring about motivation after revealing the recipients only once and after the last vignette are the following: 1) Answers to the different incentive descriptions may otherwise have been biased by whether the person had or had not received the previous reward; 2) Studying the effect of receiving versus not receiving an award is a delicate issue in surveys since it heavily relies on subjects’ willingness to imagine their emotional reaction. In general, people are not willing to do this often; 3) Subjects had to state their willingness to share the finding 5 times prior to this question (with respect to their current work environment and after each of the four incentive introduction scenarios). Adding the scenario on winning or not winning the award as well as the associated questions after each reward introduction scenario would have made the questionnaire overly long and repetitive.
were asked questions about personal characteristics,9
their perception of the role of awards in organizations, and the determinants of award effectiveness in motivating employees. The questions in the survey section were the same for all participants and placed at the end of the experiment to ensure that subjects are primed as little as possible. Participants were informed about this entire sequence of questions at the beginning of the survey.
The respondents progressed through the questionnaire in the following fashion:10
Vignettes 1 to 4 were different for each subject.
1. Each subject is asked about her behavior in the public good situation given their current work environment, i.e. no additional new incentive.
2. Each subject is presented with her particular realization of vignette 1 and then asked about her behavior in the public good situation.
3. Each subject is presented with her particular realization of vignette 2 and then asked about her behavior in the public good situation.
9
Specifically, we inquired age, gender, income range, and award history at IBM. A question about the respondents’ level of education was not included in the survey as all researchers have a university degree and most also have a PhD.
10
To ensure that subjects did not use the first award description as their baseline/reference point and evaluated awards 2 – 4 in comparison to the first award scenario, we informed the subjects in advance what kinds of different incentives they could expect; for instance, that the rewards would come with or without a monetary bonus ranging in value from CHF 50 to CHF 10000. This was necessary to make the answers comparable across subjects, since the realized values and therefore the description of reward 1 was different for each subject.
4. Each subject is presented with her particular realization of vignette 3 and then asked about her behavior in the public good situation.
5. Each subject is presented with her particular realization of vignette 4 and then asked about her behavior in the public good situation.
6. Each subject learns whether she receives the reward described in vignette 4 and then asked about her behavior in the public good situation.
7. Each subject is asked a number of survey questions regarding her personal characteristics, her thoughts on the determinants of award success, and her ideas about how awards function in organizations.
3.6. Implementation
The vignette study was conducted in a two-week period in January/February, 2007, with the 177 researchers of the IBM research lab in Rüschlikon, Switzerland. The lab is one of eight research labs that IBM maintains worldwide. In collaboration with clients and universities, researchers at these labs conduct basic as well as applied research in chemistry, information technology, physics, electrical engineering, and materials science among others. To date, four researchers have been awarded Nobel prizes in physics for research conducted during their time as employees at the IBM lab in Rüschlikon. The management in Rüschlikon hands out the approximately 20 different awards that are available in all IBM research labs. The awards are broadly separated into formal and informal awards. Formal awards recognize outstanding scientific contributions and innovations, are associated with substantial monetary compensations, and recipients are announced on the worldwide intranet of IBM research. Informal awards honor exceptional motivation in general; examples are contributions to teams, knowledge sharing, passion for work, and customer service.
Informal awards are typically associated with smaller monetary bonuses or gifts such as dinners or weekend trips. Only the more important informal awards are publicized on the local intranet of the Rüschlikon lab. Given the large number of established awards, respondents can be assumed to be familiar with their own behavior and feelings with respect to striving for and receiving awards. This is an advantage for the study, since it increases reliability and the predictive power of our findings.
The participants were invited to the study via an e-mail of the HR Manager and were reminded with a second e-mail at the end of the first week. The questionnaire could be accessed via a link provided in the e-mail. Anonymity was guaranteed. Participation in the study was voluntary and there were no monetary incentives associated with it. During the survey period, 54 researchers (response rate 31%) completed the questionnaire, resulting in 211 observations. The respondents are representative of the workforce (and therefore also to the non-respondents) with respect to all objective criteria available from the company.11
4. Results
4.1. Awards as incentives
The data are analyzed with random effects OLS models (see Greene 1997, p. 623ff). Unlike fixed effects models, these allow the inclusion of time-invariant independent variables. The random effect for each individual captures the individual specific propensity to respond to incentive introductions irrespective of the realized award factor levels. This propensity is potentially independent of the initial motivation that
11
Among the workforce of the IBM lab in Rüschlikon average age, proportion of females, and length of employment are 41 years, 13.2%, and 12 years. The respective numbers are 42 years, 10%, and 12 years among our sample of respondents.
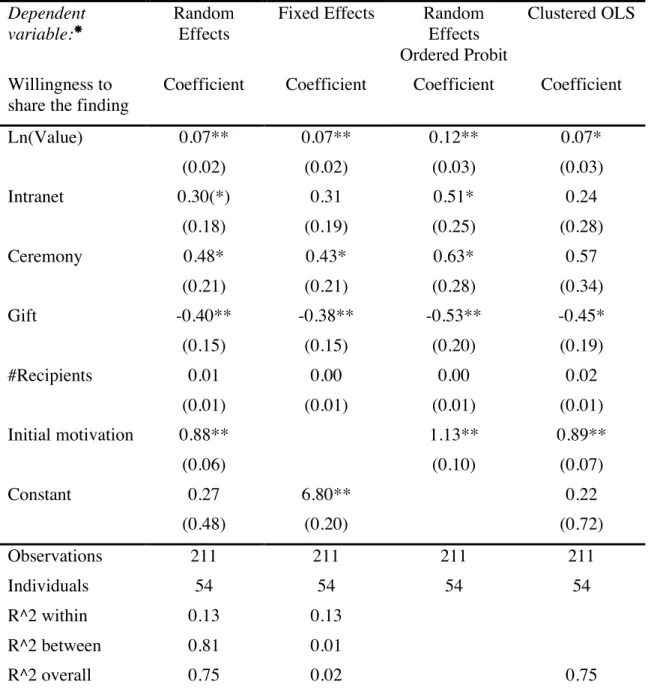
we control for separately. Random effect models require that the unobserved individual effect is uncorrelated with all explanatory variables for all observations of that individual. Since the explanatory variables, i.e. the treatments, were randomly assigned to the individual there should be no such correlation. However, our results are robust with respect to other estimation techniques like ordered probit, fixed-effect models, and OLS-regressions that do not include random effects.12 Table A in the Appendix
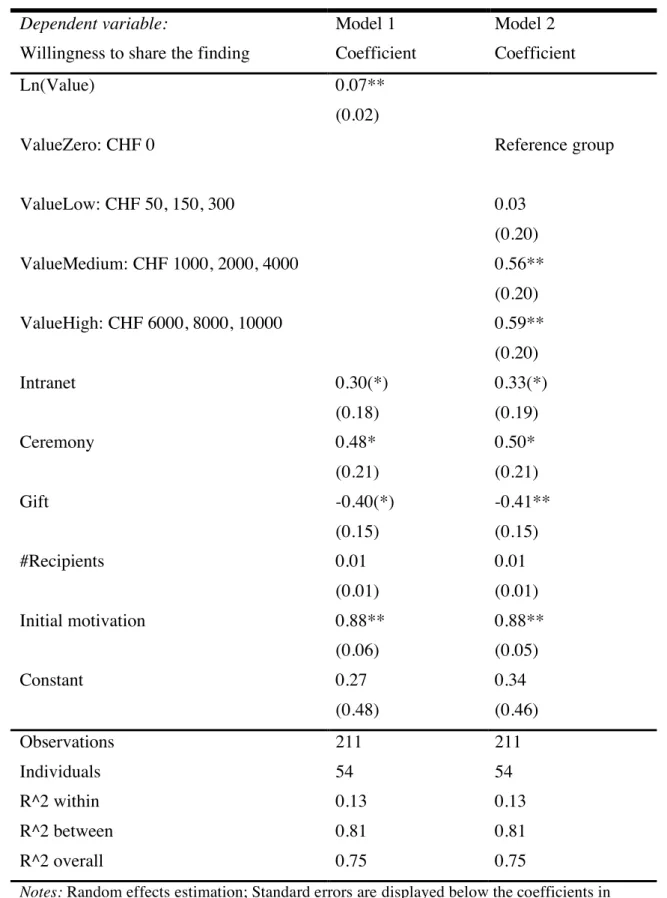
presents the results of the different models. As the results are robust with respect to the specific model, we present the random effects OLS rather than the ordered probit results in this section for ease of interpretation. The main regression includes four predictor variables associated with the four factors that were varied to produce specific vignettes. All observations are pooled as subjects receive no feedback in between the different vignettes so that there should be no dynamic adjustment of contributions over time. We also included a variable to control for variation in initial motivation among subjects. Model 1 in table 2 shows the results.
12Since respondents indicated their answer on a 10-point scale (1: "I definitely would not share now." to 10="I would certainly share now."), one could argue for the use of ordered probit models. However, studies have shown that 10-point scales can be interpreted as continuous (e.g. van Praag 1991, Ferrer-i-Carbonell and Frijters 2004, Moffit et al. 1999). Further, one might advocate the use of fixed effects models and only study within person variation. This is preferable when the unobserved individual effect ai is correlated with any explanatory variable.
However, there should be no such correlation in our design. An OLS-model with neither fixed nor random effects, controlling for baseline motivation only, might be suitable when the individuals are not heterogeneous in their reaction to the introduction of an incentive per se (irrespective of reward characteristics). However, a priori this assumption is not necessarily fulfilled.
TABLE 2 ABOUT HERE
The monetary value of the reward has a robust and statistically significantly positive impact on contributions, i.e. the willingness to share the sensitive finding with colleagues. We use the log of monetary value to account for potential non-linearities like those associated with marginal effects that decrease in the value of the reward.13
The coefficient of 0.07 implies that an increase in the value of the award from CHF 0 to CHF 150 increases the stated contributions by 0.34 on a 10-point scale. An increase from CHF 0 to CHF 2000 increases it by 0.52; an increase from CHF 0 to CHF 8000 increases the stated willingness by 0.62 points. Model 2 of table 2 presents the regression results when dummies are used to represent reward value categories. It turns out that zero and small monetary values do not have a statistically significantly different impact on contributions. Also, contributions for medium and high reward values are not statistically different. Compared to the latter, zero or small monetary values lead to a motivation that is half a point lower on a 10-point scale. This difference is statistically significant. In the qualitative survey conducted after the vignette study, the responding employees confirmed the importance of the monetary value of rewards. Almost all indicated that they considered it to be essential for an award to be accompanied by a substantial monetary bonus. This can be interpreted in two ways: First, the money that comes with the award and not the award per se motivates employees. Or second, it is the award per se that motivates employees, but the appreciation of an award depends on whether or not the award is costly for the
13
To construct the variable ln(Value), (Value+1) is used, since Value can be equal to CHF 0. We assume that observed behavior for CHF 0 is not markedly different from what one would observe for CHF 1. Including a dummy for every possible monetary value, which is the most flexible functional form, confirms that the logarithmic specification is appropriate.
employer: Only awards that involve real costs for the employer ensure that the award is meant seriously and is not merely used as a cheap incentive device.
Both forms of publicity, announcements of the winners on the intranet and ceremonies, have a statistically significantly positive effect on stated contributions to the public good. Compared to a situation with no publicity, contributions are on average 0.48 points higher when there is a ceremony, which is substantial. Naming the recipients and having a ceremony increases contributions by as much as increasing the value of the award from CHF 0 to about CHF 1000. The finding that publicity is important is in line with answers from the survey part of the study. Almost all respondents agreed that awards are important as signals of one’s qualities to other employees and outsiders. The coefficient of having a ceremony and announcing the winners on the intranet is substantially larger than the coefficient of an announcement on the intranet alone. For the rewards to serve as signals only the announcement is necessary. Hence, the larger coefficient on the combination of intranet and ceremony indicates that employees value the ceremony per se.
For a given monetary value, gifts works less well than payments in cash. Holding the value of the reward constant, a gift leads to a willingness to share that is 0.40 points lower than the willingness induced by an equivalent payment in cash. The size of this effect is substantial. For a gift to induce the same willingness to share as a payment in cash of CHF 50, it needs to increase in value from CHF 50 to CHF 2000. Again, this is in line with remarks by the respondents. In the comment section, a substantial number stated that they preferred money or paid vacation to other kinds of prizes.
The number of recipients does not have a statistically significant effect. The two hypothesized countervailing effects might cause this insignificance: an increase in the number of recipients reduces the scarcity value of the award but raises the perceived
chances of winning. We also check for the hypothesized inverted u-shaped relationship by including the square term of number of recipients. While the coefficients of number of recipients and its square term are statistically insignificant, they have opposing signs, indicating that two countervailing effects might be at work.
Initial motivation has a highly statistically significant positive effect on the willingness to share the finding. The respective coefficient implies that a person with a 1-point higher willingness to share the finding in the current work environment is about 0.9 points more willing to share the finding after incentives have been introduced. Hence, subjects that differ in their initial motivation do not markedly differ in their reaction to the introduction of an incentive.
Demographic variables such as age, gender, and experience with international teams do not play a role. We also checked whether the award history of the participants, i.e. the number and value of the IBM awards received in the past, was an important determinant for stated sharing behavior. All of these variables are statistically insignificant and the Akaike information criterion indicates that adding them to the models discussed above does not increase the informational content enough to justify their inclusion. The same is true for interaction effects. While there may be order effects, they only introduce noise, but do not bias our results. Further, they average out over all participants, as each subject receives a different vignette at each stage.
Our data show that rewards have significant and systematic effects on stated contributions of employees in a public good situation that they were well familiar with in their work experience: (1) contributions strictly increase with the monetary value of the reward and a value of zero leads to no increase in contribution; (2) Gifts are valued less than the cash equivalent; (3) Publicity matters. That ceremonies have a larger
impact than a publication on the intranet suggests that recipients value direct personal recognition.
4.2. The effect of receiving and not receiving the award
Our design also allows us to study how people react when they receive or do not receive the reward. While economic status models (e.g. Auriol and Renault 2008) and some psychological literature (e.g. Ambrose and Kulik 1999) posit a positive effect on effort of receiving and a negative effect of not receiving the award on effort, incentive considerations suggest that winners should be less motivated by the prospect of winning the award a second or third time. Additionally, observing the recipients and their behavior can influence non-recipients by providing new information on the type and level of effort required to win the reward.
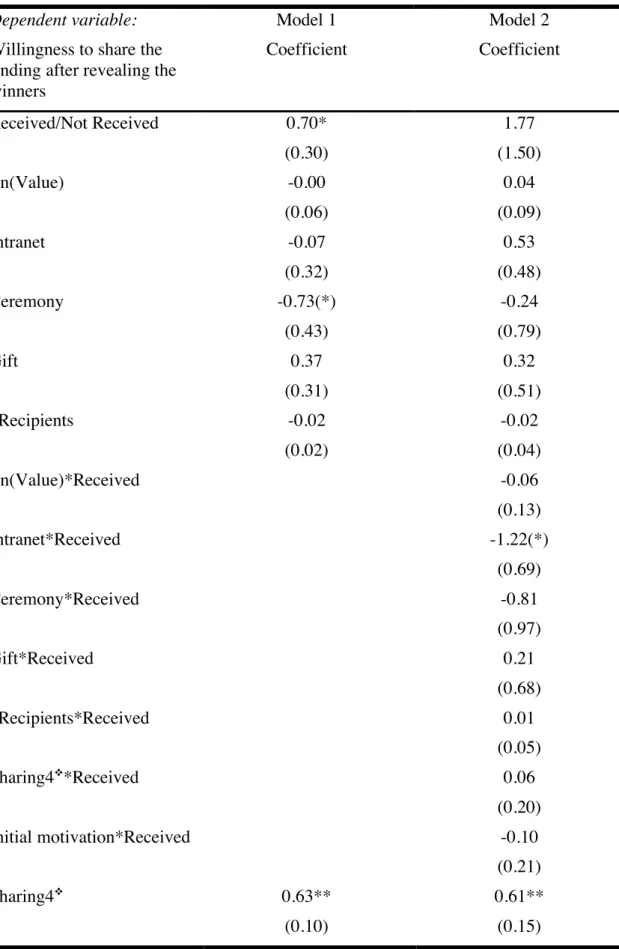
After having stated their contribution to the public good when vignette four was presented, we then told each respondent whether she received the presented reward. Then we asked each respondent again to indicate how willing she was to share the finding now that she knew whether she was a winner or a non-recipient of reward 4. Model 1 in table 3 presents the results of the basic regression in which the willingness to share the finding after revealing the winners is the dependent variable and whether the person receives the reward or not is the main independent variable. In addition to the reward factors, we control for initial motivation and the incentive effect of the award, i.e. the motivation stated after incentive 4 was announced but not yet handed out (this variable is called Sharing4 in table 3).
TABLE 3 ABOUT HERE
The motivation of winners is statistically significantly higher than the motivation of losers. The difference in contribution is 0.70 on a 10-point scale. Persons with a higher
initial motivation and those with a higher willingness to share the finding after reward 4 was introduced are more willing to share the finding after announcing the winners independently of whether they receive the reward or not. The award factors do not have a robust statistically significant effect on the motivation after announcing the winners other than via the contribution stated after the introduction, but prior to conferral of reward 4, marked as Sharing4 in the table 3. The previous analysis showed that Sharing4 is influenced by the award factors. Ceremony exhibits a weakly significant, negative impact in model 1. This effect is, however, not robust. To check whether award factors or the size of motivation prior to revealing the recipients have different effects on winners and losers, we include interaction effects of all award factors and whether the reward was received or not. The results, which are displayed in model 2 of table 3, indicate that the award factors do not have statistically significantly different effects on winners and losers.14
In a separate calculation we subtracted the motivation after revealing the winners from the motivation upon announcement but before conferral of reward 4 for each respondent. This shows that losers on average decrease their motivation by 0.4, while winners increase it by approximately the same amount. The effect on the non-recipients is negative at the 90% confidence level, while the effect on the non-recipients is positive at the 95% confidence level. Hence, winners do indeed increase their motivation upon receipt. In contrast, losers experience a decrease in motivation, which could be due to disappointment or information updating. The magnitude of the effects
14
The only exception is the weakly significant negative interaction effect between winning and
intranet. This finding seems plausible in light of the fact that intranet has a substantial positive impact on contributions when the award is announced. Hence, there is less room for further increases subsequent to winning.
of winning and losing are substantial. Hence, at the aggregate level it is not enough to assess the effects of awards upon announcement in order to determine the profitability of an award.
5. Conclusion
Awards are omnipresent, but have so far escaped the attention of economists. In particular, empirical evidence is lacking. This paper addresses the question about which characteristics drive the effect of an award and how winners and non-recipients react to the conferral of an award. Our findings suggest that awards raise performance. They should therefore be considered as an additional instrument in principal-agent relationships. It is, however, necessary to design awards carefully. Specifically, good award systems minimize the negative impact of awards on non-recipients and incorporate those award characteristics that the employees value, such as publicity. This is necessary, because the establishment of awards, as is the case for all incentive schemes, is not without risk; badly designed awards may backfire.
This study uses the vignette technique, which is a powerful empirical tool that permits the isolation of the effects of individual factors, while not artificially restricting the number of factors present. Vignette studies should be taken seriously in behavioral economics as a valuable method in addition to laboratory or field studies.
Literature
Akerlof, George A. and Rachel E. Kranton (2005). Identity and the Economics of Organizations. Journal of Economic Perspectives 19(1): 9-32.
Alexander, Cheryl S. and Henry J. Becker (1978). The Use of Vignettes in Survey Research. The Public Opinion Quarterly 42(1): 93-104.
Ambrose, Maureen L. and Carol T. Kulik (1999). Old Friends, New Faces: Motivation Research in the 1990s. Journal of Management 25(3): 231-292.
Auriol, Emmanuelle and Régis Renault (2008). Status and Incentives. The RAND Journal of Economics 39(1): 305-326.
Bateson, John E. G., David Reibstein and William Boudling (1987). Conjoint Analysis Reliability and Validity: A Framework for Future Research. Review of Marketing: 451-481.
Bénabou, Roland and Jean Tirole (2006). Incentives and Prosocial Behavior. American Economic Review 96(5): 1652-1678.
Bertrand, Marianne and Sendhil Mullainathan (2001). Do People Mean What They Say? Implications for Subjective Survey Data. American Economic Review 91 (2): 67-72.
Besley, Timothy and Maitreesh Ghatak (2008). Status Incentives. American Economic Review 98 (2): 206-211.
Ederer, Florian and Andrea Patacconi (2004). Interpersonal Comparsions, Status and Ambition in Organisations. Mimeo, Department of Economics, University of Oxford.
Ellingsen, Tore and Magnus Johannesson (2007). Paying Respect. Journal of Economic Perspectives 21(4): 135-150.
Everitt, Brian S. (1998). The Cambridge Dictionary of Statistics. Cambridge: Cambridge University Press.
Falk, Armin and Michael Kosfeld (2006). The Hidden Costs of Control. American Economic Review 96(5): 1611-1630.
Ferrer-i-Carbonell, Ada and Paul Frijters (2004). How Important Is Methodology for the Estimates of the Determinants of Happiness? Economic Journal 114(497): 641-659.
Frey, Bruno S. (1997). Not Just for the Money: An Economic Theory of Personal Motivation. Cheltenham, UK: Edward Elgar.
Frey, Bruno S. and Reto Jegen (2001). Motivation Crowding Theory. Journal of Economic Surveys 15(5): 589 - 611.
Gavrila, Caius, Jonathan P. Caulkins, Gustav Feichtinger, Gernot Tragler and Richard F. Hartl (2005). Managing the Reputation of an Award to Motivate Performance. Mathematical Methods of Operations Research 61(1): 1-22. Gibbs, Michael (2001). Promotions and Incentives. Mimeo, Graduate School of
Business, Universtiy of Chicago.
Greene, William H. (1997). Econometric Analysis. Third. Upper Saddle River, NJ: Prentice Hall.
Hensher, David, Jordan Louviere and Joffre Swait (1999). Combining Sources of Preference Data. Journal of Econometrics 89 (1-2): 197-221.
Hirsch, Fred (1976). Social Limits to Growth. Cambridge, Mass.: Harvard University Press.
Ichniowski, Casey and Kathryn Shaw (2003). Beyond Incentive Pay: Insiders' Estimates of the Value of Complementary Human Resource Management Practices. Journal of Economic Perspectives 17 (1): 155-180.
Jeffrey, Scott A. and Victoria Shaffer (2007). The Motivational Properties of Tangible Incentives. Compensation & Benefits Review 39(3): 44-50.
Lazear, Edward P. and Sherwin Rosen (1981). Rank-Order Tournaments as Optimum Labor Contracts. Journal of Political Economy 89(5): 841-864.
Loch, Christoph H., Michael Yaziji and Christian Langen (2001). The Fight for the Alpha Position: Channeling Status Competition in Organizations. European Management Journal 19(1): 16-25.
Markham, Steven E., K. Dow Scott and Gail H. McKee (2002). Recognizing Good Attendance: A Longitudinal, Quasi-Experimental Field Study. Personnel Psychology 55(3): 639-660.
McFadden, Daniel (2001). Economic Choices. American Economic Review 91(3): 351-378.
Moffitt, Robert A., Orley Ashenfelter and David Card (1999). New Developments in Econometric Methods for Labor Market Analysis. In. Handbook of Labor Economics. Volume 3a. Handbooks in Economics, vol. 5. Amsterdam; New York and Oxford: Elsevier Science, North-Holland:1367-1397.
Neckermann, Susanne, Reto Cueni and Bruno S. Frey (2008). What Is an Award Worth? An Econometric Assessment of the Impact of Awards on Employee Performance Mimeo, University of Zurich.
Neckermann, Susanne and Michael Kosfeld (2008). Working for Nothing? The Effect of Awards on Employee Performance. Mimeo, University of Zurich, Switzerland.
Nelson, Bob (2005). 1001 Ways to Reward Your Employees. New York: Workman Publishing Company.
Rossi, Peter H. and Andy B. Anderson (1982). The Factorial Survey Approach: An Introduction. In: Peter H. Rossi and Steven S. Nock (eds). Measuring Social Judgments: The Factorial Survey Approach. Beverly Hills: Sage:15-67.
Spence, A. Michael (1973). Job Market Signaling. Quarterly Journal of Economics
87(3): 355-374.
Spence, A. Michael (1974). Market Signaling. Cambridge: Harvard University Press. Sururov, Anton and Jeroen Van de Ven (2006). Discretionary Rewards as a Feedback
Mechanism. Mimeo, Amsterdam Center for Law & Economics, Univeristy of Amsterdam.
Telser, Harry and Peter Zweifel (2007). Validity of Discrete-Choice Experiments – Evidence for Health Risk Reduction. Applied Economics 39(1): 69-78.
Van Praag, Bernard M. S. (1991). Ordinal and Cardinal Utility: An Integration of the Two Dimensions of the Welfare Concept. Journal of Econometrics 50(1-2): 69-89.
Waldfogel, Joel (1993). The Deadweight Loss of Christmas. American Economic Review 83(5): 1328-1336.
Waldfogel, Joel (1996). The Deadweight Loss of Christmas: Reply. American Economic Review 86(5): 1306-1308.
APPENDIX
1. Comparison of Different Estimation Techniques
Table A: Comparison of Different Estimation Techniques:
Dependent variable:
Random Effects
Fixed Effects Random Effects Ordered Probit
Clustered OLS
Willingness to share the finding
Coefficient Coefficient Coefficient Coefficient
Ln(Value) 0.07** 0.07** 0.12** 0.07* (0.02) (0.02) (0.03) (0.03) Intranet 0.30(*) 0.31 0.51* 0.24 (0.18) (0.19) (0.25) (0.28) Ceremony 0.48* 0.43* 0.63* 0.57 (0.21) (0.21) (0.28) (0.34) Gift -0.40** -0.38** -0.53** -0.45* (0.15) (0.15) (0.20) (0.19) #Recipients 0.01 0.00 0.00 0.02 (0.01) (0.01) (0.01) (0.01) Initial motivation 0.88** 1.13** 0.89** (0.06) (0.10) (0.07) Constant 0.27 6.80** 0.22 (0.48) (0.20) (0.72) Observations 211 211 211 211 Individuals 54 54 54 54 R^2 within 0.13 0.13 R^2 between 0.81 0.01 R^2 overall 0.75 0.02 0.75
Notes: ** statistically significant at 99% level, * significant at 95% level, (*) significant at 90% level.
Standard errors are displayed below coefficients in parentheses.
Tables for text
Table 1: The factors and their levels
Factor Factor levels
Type of accompanying reward:
(categorical)
gift, cash payment
Degree of publicity: (categorical)
anonymous, intranet announcement, intranet with ceremony
Monetary value of cash payment or gift:
(continuous)
zero1, small2, medium3, high4
Maximum number of recipients: (continuous) 1, 2, 6, 10, 16, 20 Notes:1 {CHF 0}; 2 {CHF 50, 150, 300}; 3 {CHF 1000, 2000, 4000}; 4 {CHF 6000, 8000, 10000}
Table 2: Effect of Introducing an Award on the Contribution to a Public Good
Dependent variable: Model 1 Model 2
Willingness to share the finding Coefficient Coefficient
Ln(Value) 0.07**
(0.02)
ValueZero: CHF 0 Reference group
ValueLow: CHF 50, 150, 300 0.03 (0.20) ValueMedium: CHF 1000, 2000, 4000 0.56** (0.20) ValueHigh: CHF 6000, 8000, 10000 0.59** (0.20) Intranet 0.30(*) 0.33(*) (0.18) (0.19) Ceremony 0.48* 0.50* (0.21) (0.21) Gift -0.40(*) -0.41** (0.15) (0.15) #Recipients 0.01 0.01 (0.01) (0.01) Initial motivation 0.88** 0.88** (0.06) (0.05) Constant 0.27 0.34 (0.48) (0.46) Observations 211 211 Individuals 54 54 R^2 within 0.13 0.13 R^2 between 0.81 0.81 R^2 overall 0.75 0.75
Notes: Random effects estimation; Standard errors are displayed below the coefficients in parentheses.
Table 3: The Effect of Receiving or Not Receiving an Award
Dependent variable: Model 1 Model 2
Willingness to share the finding after revealing the winners Coefficient Coefficient Received/Not Received 0.70* 1.77 (0.30) (1.50) Ln(Value) -0.00 0.04 (0.06) (0.09) Intranet -0.07 0.53 (0.32) (0.48) Ceremony -0.73(*) -0.24 (0.43) (0.79) Gift 0.37 0.32 (0.31) (0.51) #Recipients -0.02 -0.02 (0.02) (0.04) Ln(Value)*Received -0.06 (0.13) Intranet*Received -1.22(*) (0.69) Ceremony*Received -0.81 (0.97) Gift*Received 0.21 (0.68) #Recipients*Received 0.01 (0.05) Sharing4*Received 0.06 (0.20) Initial motivation*Received -0.10 (0.21) Sharing4 0.63** 0.61** (0.10) (0.15)
Initial motivation 0.35** 0.39* (0.10) (0.15) Constant -0.05 -0.79 (0.67) (1.20) Observations 52 52 Adj R^2 0.86 0.84
Notes: OLS – Estimation; Standard errors are displayed below the coefficients in parentheses. ** statistically significant at 99% level, * significant at 95% level, (*) significant at 90% level.
Sharing4 is the willingness to share the finding that the subjects indicated after vignette 4,
i.e. after the announcement of reward 4, but before learning whether they received reward 4 or not.
Supplementary Material
(not intended to be published)1. Explanation of the procedure to respondents
We will now present you with four different scenarios:
• Introduction of Incentive 1
• Introduction of Incentive 2
• Introduction of Incentive 3
• Introduction of Incentive 4.
In each scenario, a hypothetical incentive for international cooperation is introduced at IBM Rüschlikon. Every respondent receives a different set of 4 incentives. The 4 incentives are randomly assigned to you. Here is an overview over the range of possible incentives: The incentives are either cash incentives or awards. They are worth between CHF 50 and CHF 10 000. Some of the described awards come with a cash bonus, some with nothing, others with a material gift such as a pen, a voucher for gourmet dinner, or a 4-day vacation (including additional days of paid vacation). In the scenarios, the maximum number of recipients per year varies between 1 and 20. In some scenarios, a list of recipients will be published on the intranet. In some instances there will be a ceremony for the winners.
For each scenario we will ask you the same question:
• What is your willingness to share the finding now?
Please look at these questions as a thought experiment and try to answer them by putting yourself into each scenario.
2. How the vignettes were introduced to respondents
Please imagine the following.
(This description is valid for all 4 incentive descriptions. We will repeat it each time so that you can look at it again if you want to.)
In addition to the existing bonuses and awards, IBM Research announces a new incentive for individuals who have made great efforts to promote cooperation
between labs.
Recipients will be selected annually, starting in December 2007.
The incentive is for individuals demonstrating exceptional efforts to promote cooperation on projects involving employees from different research labs and IBM units.
All employees on the IBM payroll are eligible. Criteria for selection are:
• Initiation and maintenance of successful collaborations among research labs.
• Exceptional dedication to making teamwork succeed across national boundaries.
• The sharing of ideas and knowledge among labs.
3. How the willingness to share the finding was elicited from the
respondents
Situation Description: Please imagine the following:
• You are assigned to an international project that involves several research laboratories.
• Apart from you, there are two employees from Beijing and two from New York on the team.
• You have never worked with the employees from the other labs on a team before. On this team, management does not intervene much in the project.
• You have made an important finding on this team.
• This finding can be used to greatly enhance the international project you are working on at the moment.
• However, the finding is fundamental in the sense that it is very relevant to a variety of other projects as well.
Now you have two options.
publishing it under your own name.
This would solve some important problems on the project and greatly enhance the quality and speed of the project.
• Second, you can wait and share the finding later, after it has been published.
This would eliminate the risk that it could be used by your Chinese or U.S. colleagues in their own work without giving you the appropriate credit for your work, both within the company and when writing papers. You don’t think that this is very likely, but the risk exists.
Please indicate how realistic you consider the described situation. 6: very realistic … 1: very unrealistic; no answer
On a scale between 1 and 10, what is your willingness to share the finding now? (Sharing the finding now means choosing the first option.)
10: I would certainly share now. … 1: I definitely would not share now; no answer.
4. Wording of the levels of the reward characteristics
A particular vignette is constructed by randomly selecting one factor level for each of the four factors. In the following, we present the four different factors, their levels, the corresponding texts in the vignettes, and the operationalization of the factors in the statistical analysis.
Factor 1, the type of accompanying reward.
The wording of this factor depended on the monetary value of the reward (factor 3) and will be presented in the description of factor 3 below.
Factor 1, level a, gift.
Factor 1, level b, cash payment.
In the regression models factor 1 was treated as a dummy variable, Gift, that took the value 1 if the reward was accompanied by a gift and the value 0 if the reward was accompanied by a payment in cash.
Factor 2, the degree of publicity.
The three factor levels had the following texts. Factor 2, level a, anonymous.
“The lab director congratulates the winner(s) privately. Award recipients are not published on the intranet.”
Factor 2, level b, announcement on the intranet.
“The lab director congratulates the winner(s) privately. Award recipients are published on the intranet.”
Factor 2, level c, announcement on the intranet and ceremony.
“The lab director congratulates the winner(s) in the presence of the other members of the lab at the kick-off meeting in January 2008. Award recipients are published on the intranet.”
In the regression models the factor levels were represented with 2 dummy variables. The variable Intranet was a dummy that took on the value 1 if the list of recipients was published on the intranet without a ceremony. The variable Ceremony was a dummy that took the value 1 if the recipients were announced on the intranet and the award was handed out in a ceremony. Factor level a was represented by both dummies taking the value 0, factor b was represented as Intranet = 1 and Ceremony = 0, and factor level c was represented as Intranet = 0 and Ceremony = 1.
Factor 3, monetary value of cash payment or gift associated with the reward. To determine the monetary value of the reward we used a two-step sampling procedure. We did this to ensure that we sampled the space of monetary values adequately. Specifically, we first randomly determined whether the reward would have no monetary value, a small monetary value, a medium monetary value, or a high monetary value. Second, if the award came with a cash payment (Factor 2, level b), one of three numerical values was selected from the category selected in step one. Factor 3, level a, Category 1: Zero monetary value
Factor 3, level b, Category 2: Small monetary value (CHF 50, 150, or 300)
Factor 3, level d, Category 4: High monetary value (CHF 6000, 8000, or 10000) In the regression models the variable Value was treated as quantitative and took one of the following values: 0, 50, 150, 300, 1000, 2000, 4000, 6000, 8000, 10000.
The wording of factor 3 depended on the type of accompanying reward (factor 1). Because the values of gifts are typically vague, our set of possible gifts had four elements, namely one gift for every category described above. Importantly, the set of possible gifts did not include one gift for each of the possible monetary values listed above. Depending on the category of monetary value drawn, a gift of corresponding value was described to the participants. The associated monetary value used in the statistical analysis was equal to the intermediate amount in the category. For example, if the gift was of medium value, the value used in the statistical analysis was CHF 2000. In case the reward came with a payment in cash, a random draw decided which of the values in each category was displayed to the participant.
The texts associated with the different levels of factor 3 are displayed below. Factor 3, level a: Zero monetary value
Factor 1, level a, award with gift:
“In recognition of the recipients’ contribution, the award comes with a ballpoint pen labeled ‘Thank you for your exceptional contribution!’ ”. The value of this gift used in the regression was CHF 0.
Factor 1, level b, award with cash payment.
“The award is not accompanied by a payment in cash.” Factor 3, level b: Small monetary value (CHF 50, 150, or 300)
Factor 1, level a, award with gift:
“In recognition of the recipients’ contribution, the award comes with a gift basket including a good bottle of champagne, two bottles of wine, and various specialty food items.”
The value of this gift used in the regression was CHF 150. Factor 1, level b, award with cash payment.
“The award comes with CHF Y in cash.”, where Y is randomly chosen from {50, 150, 300}.
Factor 3, level c: Medium monetary value (CHF 1000, 2000, or 4000) Factor 1, level a, award with gift:
“In recognition of the recipients’ contribution, the award comes with an additional day of paid vacation and a voucher for a gourmet menu for four people at the Restaurant Petermann’s Kunststuben in Küsnacht, where the star cook Horst Petermann will personally cater the party.”
The value of this gift used in the regression was CHF 2000 Factor 1, level b, award with cash payment.
“The award comes with CHF Y in cash.”, where Y is randomly chosen from {1000, 2000, 4000}.
Factor 3, level d: High monetary value (CHF 6000, 8000, or 10000) Factor 1, level a, award with gift:
“As a symbol of recognition, the award comes with a voucher for a trip of 4 days for two adults and children to a destination of their choice, all-inclusive. This trip will not be deducted from your normal paid vacation and thus presents additional paid vacation days.”
The value of this gift used in the regression was CHF 8000. The value of the gift is based on the fact that IBM estimates that one workday for one employee is worth about CHF 1000.
Factor 1, level b, award with cash payment.
”The award comes with CHF Y in cash.”, where Y is randomly chosen from {6000, 8000, 10000}.
Factor 4, the maximum number of recipients per year.
“There will be up to X recipients (Z% of researchers and non-technical staff) per year in the Rüschlikon office.”, where X and Z are chosen from the set {(1, 0.4%), (2, 1%), (6, 2%), (10, 4%), (16, 6%), (20, 8%)}.
In the regression models, factor 5 was treated as a quantitative variable, #Recipients,